
Rationale and Objectives
The purpose of the present study was to obtain a cutoff value of liver fat content for the diagnosis of hepatic steatosis by comparing magnetic resonance (MR) spectroscopy results in children and adolescents with normal and excess weight.
Materials and Methods
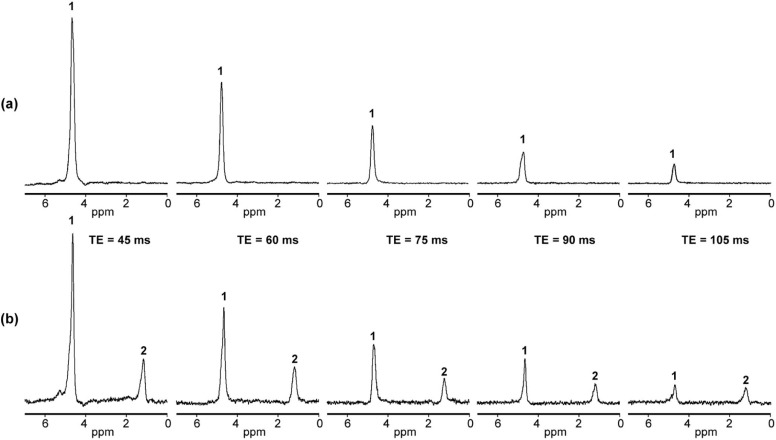
The study included 420 children and adolescents (91 normal-weight, 99 overweight, and 230 obese) 8–18 years of age. Proton magnetic resonance spectroscopy was performed with a 3T MR system using point resolved spectroscopy sequence with series echo times.
Results
The mean absolute mass concentration of liver fat was obtained: 0.5 ± 0.04% in normal-weight boys; 0.5 ± 0.03% in normal-weight girls; 0.9 ± 0.16% in boys with overweight; 1.1 ± 0.24% in girls with overweight; 1.7 ± 0.24% in boys with obesity; and 1.4 ± 0.21% in girls with obesity.
The cutoff value of absolute mass concentration of liver fat for hepatic steatosis was found to be 1.5%. Based on this cutoff value, hepatic steatosis was diagnosed in 16% of boys with overweight, 11% of girls with overweight, 32% of boys with obesity, and 27% of girls with obesity.
Conclusions
Proton magnetic resonance spectroscopy was successfully applied to obtain the cutoff value of absolute mass concentration of liver fat for the diagnosis of hepatic steatosis in children and adolescents. Children and adolescents with obesity have higher risk of hepatic steatosis than their peers with overweight.
Introduction
Obesity has become a growing health challenge all over the world, beginning at early age in children and progressing into adulthood . One of the major complications caused and worsened by obesity is nonalcoholic fatty liver disease (NAFLD). NAFLD ranges from simple steatosis through steatohepatitis and fibrosis to end-stage liver disease (cirrhosis) and is defined as triglyceride accumulation in hepatocytes exceeding 5% of the liver weight . Liver biopsy is the gold standard of diagnosis and severity assessment of NAFLD . However, it is an invasive procedure associated with serious risks .
Get Radiology Tree app to read full this article<
Get Radiology Tree app to read full this article<
Materials and Methods
Study Population
Get Radiology Tree app to read full this article<
Table 1
Study Population
Normal-weight Girls ( n = 51) Normal-weight Boys ( n = 40) Age, y BMI SDS Age, y BMI SDS Mean 13.6 0.02 12.6 0.12 Standard deviation 2.8 0.87 2.3 0.74 Minimum 8.1 −1.72 9.0 −1.70 Maximum 17.8 1.27 17.3 1.18
Girls With Overweight ( n = 62) Boys With Overweight ( n = 37) Age, y BMI SDS Age, y BMI SDS Mean 13.2 1.94 13.0 1.96 Standard deviation 2.6 0.28 2.4 0.30 Minimum 7.3 1.32 9.7 1.31 Maximum 17.8 2.32 17.9 2.32
Girls With Obesity ( n = 122) Boys With Obesity ( n = 108) Age, y BMI SDS Age, y BMI SDS Mean 13.6 2.82 13.0 3.00 Standard deviation 2.2 0.36 1.9 0.40 Minimum 8.8 2.34 8.6 2.33 Maximum 17.9 4.18 17.3 4.11
Get Radiology Tree app to read full this article<
Get Radiology Tree app to read full this article<
Magnetic Resonance Examination
Get Radiology Tree app to read full this article<
Get Radiology Tree app to read full this article<
Measurement of Liver Fat Content
Get Radiology Tree app to read full this article<
LFSF=(fat peak area at TE=0ms/[fat peak area at TE=0ms+water peak area at TE=0ms])×100. LFSF
=
(
fat peak area at TE
=
0
ms
/
[
fat peak area at TE
=
0
ms
+
water peak area at TE
=
0
ms
]
)
×
100
.
Get Radiology Tree app to read full this article<
Get Radiology Tree app to read full this article<
Get Radiology Tree app to read full this article<
Get Radiology Tree app to read full this article<
LFC=0.856×([LFSF/100][1.138−0.339×{LFSF/100}]) LFC
=
0.856
×
(
[
LFSF
/
100
]
[
1.138
−
0.339
×
{
LFSF
/
100
}
]
)
Get Radiology Tree app to read full this article<
Get Radiology Tree app to read full this article<
Statistical Analysis
Get Radiology Tree app to read full this article<
Results
Get Radiology Tree app to read full this article<
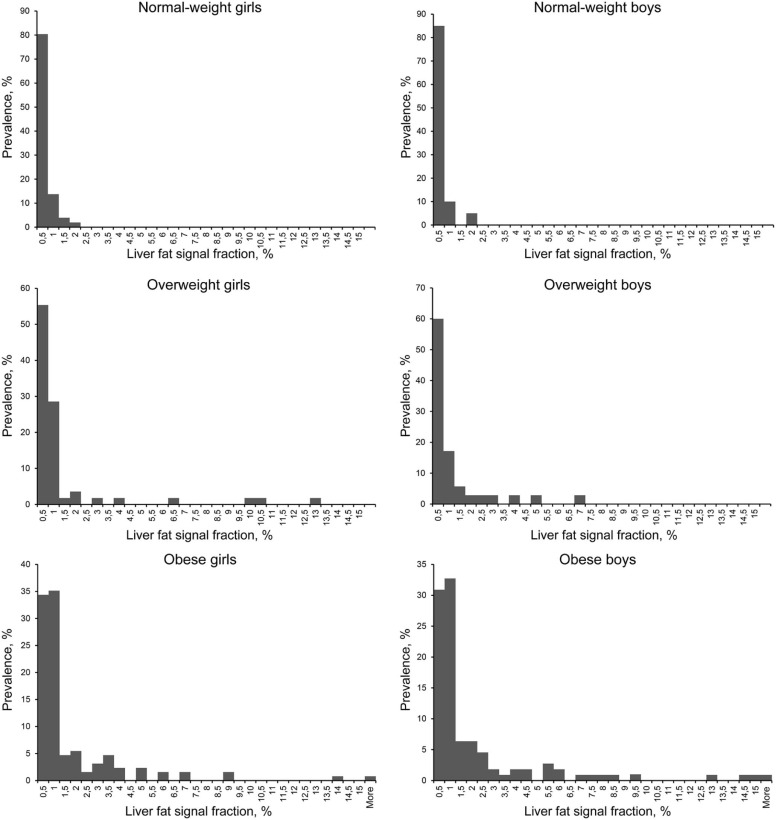
Table 2
Prevalence of Hepatic Steatosis (Liver Fat Signal Fraction [LFSF] Over 2%; Corresponding Absolute Mass Concentration of Liver Fat [LFC] Over 1.5%) in the Overweight and Obese Study Groups
Girls Boys Overweight 11% 16% Obese 27% 32%
Get Radiology Tree app to read full this article<
Get Radiology Tree app to read full this article<
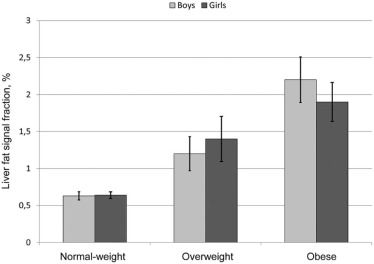
Table 3
Mean and Standard Errors of the Mean Values (SD) of Liver Fat Signal Fraction (LFSF) and the Absolute Mass Concentration of Liver Fat (LFC) in the Study Groups
LFSF, % LFC, % Mean (SD) Mean (SD) Normal-weight girls ( n = 51) 0.6 (0.04) 0.5 (0.03) Girls with overweight ( n = 62) 1.4 (0.30) 1.1 (0.24) Girls with obesity ( n = 122) 1.9 (0.26) 1.4 (0.21) Normal-weight boys ( n = 40) 0.6 (0.05) 0.5 (0.04) Boys with overweight ( n = 37) 1.2 (0.23) 0.9 (0.16) Boys with obesity ( n = 108) 2.2 (0.31) 1.7 (0.24)
Table 4
Correlation Between Liver Fat Signal Fraction (LFSF) and Body Mass Index Standard Deviation Score (BMI SDS) in the Study Groups
Girls Boys Normal-weight r = 0.014, P = .9 r = 0.15, P = .36 Overweight r = 0.22, P = .11 r = 0.17, P = .33 Obese r = 0.38, P = .0001 r = 0.05, P = .63
Get Radiology Tree app to read full this article<
Discussion
Get Radiology Tree app to read full this article<
Get Radiology Tree app to read full this article<
Get Radiology Tree app to read full this article<
Get Radiology Tree app to read full this article<
Get Radiology Tree app to read full this article<
Get Radiology Tree app to read full this article<
Acknowledgments
Get Radiology Tree app to read full this article<
References
1. Harrison S.A., Day C.P.: Benefits of lifestyle modification in NAFLD. Gut 2007; 56: pp. 1760-1769.
2. Bellentani S., Scaglioni F., Marino M., et. al.: Epidemiology of non-alcoholic fatty liver disease. Dig Dis 2010; 28: pp. 155-161.
3. Paradis V., Bedossa P.: Definition and natural history of metabolic steatosis: histology and cellular aspects. Diabetes Metab 2008; 34: pp. 638-642.
4. Ma X., Holalkere N.S., Kambadakone R.A., et. al.: Imaging-based quantification of hepatic fat: methods and clinical applications. Radiographics 2009; 29: pp. 1253-1277.
5. Patton H.M., Lavine J.E., Van Natta M.L., et. al.: Clinical correlates of histopathology in pediatric nonalcoholic steatohepatitis. Gastroenterology 2008; 135: pp. 1961-1971.
6. Wieckowska A., Feldstein A.E.: Diagnosis of nonalcoholic fatty liver disease: invasive versus noninvasive. Semin Liver Dis 2008; 28: pp. 386-395.
7. Kobyliak N., Abenavoli L.: The role of liver biopsy to assess non-alcoholic fatty liver disease. Rev Recent Clin Trials 2014; 9: pp. 159-169.
8. Parente D.B., Rodrigues R.S., Paiva F.F., et. al.: Is MR spectroscopy really the best MR-based method for the evaluation of fatty liver in diabetic patients in clinical practice?. PLoS ONE 2014; 9: e112574
9. Kukuk G.M., Hittatiya K., Sprinkart A.M., et. al.: Comparison between modified Dixon MRI techniques, MR spectroscopic relaxometry, and different histologic quantification methods in the assessment of hepatic steatosis. Eur Radiol 2015; 25: pp. 2869-2879.
10. Krishan S., Jain D., Bathina Y., et. al.: Non-invasive quantification of hepatic steatosis in living, related liver donors using dual-echo Dixon imaging and single-voxel proton spectroscopy. Clin Radiol 2016; 71: pp. 58-63.
11. Rehm J.L., Wolfgram P.M., Hernando D., et. al.: Proton density fat-fraction is an accurate biomarker of hepatic steatosis in adolescent girls and young women. Eur Radiol 2015; 25: pp. 2921-2930.
12. Lange T., Buechert M., Baumstark M.W., et. al.: Value of MRI and MRS fat measurements to complement conventional screening methods for childhood obesity. J Magn Reson Imaging 2015; 42: pp. 1214-1222.
13. Bohte A.E., Koot B.G., van der Baan-Slootweg O.H., et. al.: US cannot be used to predict the presence or severity of hepatic steatosis in severely obese adolescents. Radiology 2012; 262: pp. 327-334.
14. Krssák M., Hofer H., Wrba F., et. al.: Non-invasive assessment of hepatic fat accumulation in chronic hepatitis C by 1H magnetic resonance spectroscopy. Eur J Radiol 2010; 74: pp. e60-e66.
15. Koot B.G., van der Baan-Slootweg O.H., Bohte A.E., et. al.: Accuracy of prediction scores and novel biomarkers for predicting nonalcoholic fatty liver disease in obese children. Obesity (Silver Spring) 2013; 21: pp. 583-590.
16. Holm J.C., Gamborg M., Bille D.S., et. al.: Chronic care treatment of obese children and adolescents. Int J Pediatr Obes 2011; 6: pp. 188-196.
17. Fonvig C.E., Chabanova E., Andersson E.A., et. al.: 1H-MRS measured ectopic fat in liver and muscle in Danish lean and obese children and adolescents. PLoS ONE 2015; 10: e0135018
18. Fonvig C.E., Chabanova E., Ohrt J.D., et. al.: Multidisciplinary care of obese children and adolescents for one year reduces ectopic fat content in liver and skeletal muscle. BMC Pediatr 2015; 15: pp. 196.
19. Nysom K., Molgaard C., Hutchings B., et. al.: Body mass index of 0 to 45-y-old Danes: reference values and comparison with published European reference values. Int J Obes Relat Metab Disord 2001; 25: pp. 177-184.
20. Cole T.J., Green P.J.: Smoothing reference centile curves: the LMS method and penalized likelihood. Stat Med 1992; 11: pp. 1305-1319.
21. Hamilton G., Middleton M.S., Bydder M., et. al.: Effect of PRESS and STEAM sequences on magnetic resonance spectroscopic liver fat quantification. J Magn Reson Imaging 2009; 30: pp. 145-152.
22. Yahya A., Fallone B.G.: T2 determination of the J-coupled methyl protons of lipids: in vivo illustration with tibial bone marrow at 3 T. J Magn Reson Imaging 2010; 31: pp. 1514-1521.
23. Chabanova E., Bille D.S., Thisted E., et. al.: MR spectroscopy of liver in overweight children and adolescents: investigation of 1H T2 relaxation times at 3T. Eur J Radiol 2012; 81: pp. 811-814.
24. Szczepaniak L.S., Nurenberg P., Leonard D., et. al.: Magnetic resonance spectroscopy to measure hepatic triglyceride content: prevalence of hepatic steatosis in the general population. Am J Physiol Endocrinol Metab 2005; 288: pp. E462-E468.
25. Longo R., Pollesello P., Ricci C., et. al.: Proton MR spectroscopy in quantitative in vivo determination of fat content in human liver steatosis. J Magn Reson Imaging 1995; 5: pp. 281-285.
26. Hamilton G., Yokoo T., Bydder M., et. al.: In vivo characterization of the liver fat 1 H MR spectrum. NMR Biomed 2011; 24: pp. 784-790.
27. Hetterich H., Bayerl C., Peters A., et. al.: Feasibility of a three-step magnetic resonance imaging approach for the assessment of hepatic steatosis in an asymptomatic study population. Eur Radiol 2016; 26: pp. 1895-1904.
28. van Werven J.R., Marsman H.A., Nederveen A.J., et. al.: Assessment of hepatic steatosis in patients undergoing liver resection: comparison of US, CT, T1-weighted dual-echo MR imaging, and point-resolved 1H MR spectroscopy. Radiology 2010; 256: pp. 159-168.