
Rationale and Objectives
Sodium and proton magnetic resonance imaging ( 23 Na/ 1 H-MRI) have shown that muscle and skin can store Na + without water. In chronic renal failure and in heart failure, Na + mobilization occurs, but is variable depending on age, dialysis vintage, and other features. Na + storage depots have not been studied in patients with acute kidney injury (AKI).
Materials and Methods
We studied 7 patients with AKI (mean age: 51.7 years; range: 25–84) and 14 age-matched and gender-matched healthy controls. All underwent 23 Na/ 1 H-MRI at the calf. Patients were studied before and after acute hemodialysis therapy within 5–6 days. The 23 Na-MRI produced grayscale images containing Na + phantoms, which served to quantify Na + contents. A fat-suppressed inversion recovery sequence was used to quantify H 2 O content.
Results
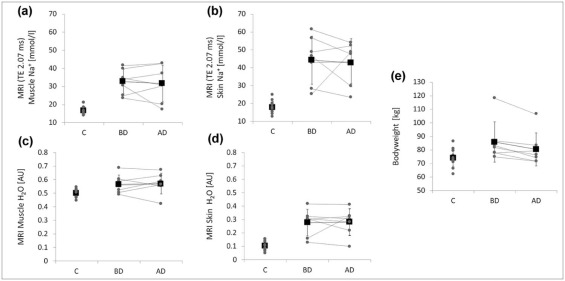
Plasma Na + levels did not change. Mean Na + contents in muscle and skin did not significantly change following four to five cycles of hemodialysis treatment (before therapy: 32.7 ± 6.9 and 44.2 ± 13.5 mmol/L, respectively; after dialysis: 31.7 ± 10.2 and 42.8 ± 11.8 mmol/L, respectively; P > .05). Water content measurements did not differ significantly before and after hemodialysis in muscle and skin ( P > .05). Na + contents in calf muscle and skin of patients before hemodialysis were significantly higher than in healthy subjects (16.6 ± 2.1 and 17.9 ± 3.2) and remained significantly elevated after hemodialysis.
Conclusions
Na + in muscle and skin accumulates in patients with AKI and, in contrast to patients receiving chronic hemodialysis and those with acute heart failure, is not mobilized with hemodialysis within 5–6 days.
Introduction
Sodium (Na + ) homeostasis in the body is important to blood pressure regulation, cardiovascular risk, and survival . However, measuring Na + in the body has not been possible until the development of clinical Na + magnetic resonance imaging (MRI) determinations. We observed earlier that Na + is stored without commensurate water retention in skin and muscle . The local hypertonicity resulting from Na + storage in skin leads to immune cell-driven induction of local tissue electrolyte clearance via modulation of cutaneous lymph capillary density . We found that disturbance of local tissue Na + clearance from these stores is associated with salt-sensitive increases in blood pressure. Recent findings support the theory that skin electrolyte control, by lymph capillaries, is relevant for blood pressure homeostasis . The findings suggest that in addition to renal compensatory mechanisms, local clearance mechanisms at the tissue level are important for tissue electrolyte homeostasis. We recently implemented a 23 Na-MRI modality for noninvasive detection and quantification of Na + reservoir metabolism in normal and hypertensive humans , in patients with hypernatremia , and in patients requiring chronic intermittent hemodialysis treatment . We used a specific coil for 23 Na-MRI using the upper calf as a target that allows skin and skeletal muscle to be investigated. During acute hemodialysis, the dialyzer assumes the fluid and salt-excretory function . We now investigated tissue Na + contents in patients with acute kidney injury (AKI) and tested the hypothesis that acute hemodialysis can mobilize Na + from tissue stores presumably accumulated within a few days.
AKI is typically associated with an accumulation of Na + (and Cl − ) in the extracellular space . We observed that Na + is deposited in skin and muscle physiologically; this occurrence is seen more often in patients with hypertension . The Na + is bound to negatively charged glycosaminoglycans. Furthermore, long-term balance studies have documented infradian rhythms in Na + balance and excretion that are highly consistent with an additional Na + storage compartment . We necessarily relied on animal studies involving carcass ashing and atomic absorption to delineate Na + stores . The idea of using 23 Na as a target for molecular (atomic) imaging to transfer such data to humans is not new . Recently, various applications for 23 Na-MRI have been reviewed . Zaaraoui et al. showed that the distribution of brain sodium accumulation is correlated with disability in multiple sclerosis . Ouwerkerk et al. found an increased Na + content in malignant breast tissue . Other studies concerned osteoarthritis and indicated that 23 Na-MRI has the potential to provide insight into muscle physiology . In our previous study in patients on maintenance hemodialysis, we showed that the time course of a 4-hour hemodialysis treatment was sufficient to lower the enhanced tissue sodium content rapidly to almost control level . Now, our aim was to determine whether the Na + stored in skin and muscle tissue of patients with AKI could be reduced after acute hemodialysis therapy within the first 5–6 days. We developed 23 Na-MRI for our clinical purposes to study Na + balance in disease states .
Materials and Methods
Patient Recruitment
Get Radiology Tree app to read full this article<
Acute Hemodialysis Treatment
Get Radiology Tree app to read full this article<
TABLE 1
Hemodialysis-related Parameters
Hemodialysis-related parameter 7 Patients with AKI Interval MRI examinations (d) 5.6 (range: 3–8) Number of HD treatments 4.4 (range: 3–6) Total HD time (h) 11.5 (range: 7–18.8) Total ultrafiltration volume (L) 8.36 (range: 2.8–17.4) Dialysate Na + concentration (mmol/L) 138.1 (range: 138–141)
AKI, acute kidney injury; HD, hemodialysis; MRI, magnetic resonance imaging; Na + , sodium.
Descriptive data of relevant hemodialysis-related parameters for the acute hemodialysis treatment of all seven patients (mean value and range).
Get Radiology Tree app to read full this article<
Imaging Technique
Get Radiology Tree app to read full this article<
Get Radiology Tree app to read full this article<
TABLE 2
Scanning Protocol and MR Parameters
Localizer T1-weighted Fast Low-angle Shot (FLASH) Sequence Fat-suppressed Inversion Recovery Sequence Gradient Echo 23 Na Sequence (Acquired Four Times Successively) Total acquisition time (TA; min) 0.15 2.08 6.22 3.25 Echo time (TE; ms) 4 2.46 12 2.07 Repetition time (TR; ms) 8.6 250 3000 100 Inversion time (TI; ms) – – 210 – Flip angle (FA; °) 20 60 90/180 90 Averages 2 2 1 32 Bandwidth (Hz/pixel) 320 310 130 430 Field of view (FoV; mm) 192 192 192 192 Matrix (pixel) 256 256 128 64 Resolution (mm) 0.75 × 0.75 × 10 0.75 × 0.75 × 5 1.5 × 1.5 × 5 3 × 3 × 30
Get Radiology Tree app to read full this article<
Image Analysis
Get Radiology Tree app to read full this article<
![Figure 1, The compartments of the lower leg were determined before ( left ) and after ( right ) acute hemodialysis treatment by a radiologist. The different anatomical regions of interest (ROIs) were drawn, guided by the anatomical image ( lower images : T1-weighted fast low-angle shot [FLASH] sequence). To measure the skin, one pixel was marked along the coil surface. Four tubes containing aqueous solutions with increasing Na + concentrations (10, 20, 30, and 40 mmol/L NaCl) were positioned in a custom-made device positioned inside the coil just below the patient's lower leg. Measurements of grayscale tube images served as calibration standards for Na + magnetic resonance imaging ( 23 Na-MRI) of the skeletal muscle and skin by relating intensity to a content in a linear trend analysis. For H 2 O quantification, the 10 mmol/L NaCl tube served as a calibration standard for tissue water in a linear trend analysis, defining a water content of approximately 1 L water per liter volume. ROIs: 1, skin; 2, triceps surae muscle (excluding areas containing vessels); 3, whole lower leg; 4–7, calibration solutions; 8, background noise.](https://storage.googleapis.com/dl.dentistrykey.com/clinical/3Tesla23NaMagneticResonanceImagingDuringAcuteKidneyInjury/0_1s20S1076633217301770.jpg)
Get Radiology Tree app to read full this article<
Get Radiology Tree app to read full this article<
Statistical Analysis
Get Radiology Tree app to read full this article<
Results
Study Population
Get Radiology Tree app to read full this article<
TABLE 3
Descriptive Data and Results
Patients Control Group_P_ Value (Confidence Interval) Gender 6 men/1 woman 12 men/2 women Age (y) 51.7 (range: 25–84) 51.6 (range: 26–89) .99 (−18.6 to 18.4)
Before Therapy After Therapy Muscle Na + (mmol/L) 32.7 ± 6.9 31.7 ± 10.2 16.6 ± 2.1 BD vs. AD: .68 (−4.8 to 7.0)
BD vs. C: .001 (−22.4 to −9.7)
AD vs. C: .008 (−24.4 to −5.6) Skin Na + (mmol/L) 44.2 ± 13.5 42.8 ± 11.8 17.9 ± 3.2 BD vs. AD: .77 (−10.5 to 13.4)
BD vs. C: .002 (−38.8 to −13.8)
AD vs. C: .001 (−35.8 to −14.0) Muscle H 2 O (AU) 0.57 ± 0.07 0.57 ± 0.08 0.50 ± 0.03 BD vs. AD: .80 (−0.05 to 0.04)
BD vs. C: .042 (−0.130 to −0.003)
AD vs. C: .005 (−0.119 to −0.024) Skin H 2 O (AU) 0.28 ± 0.10 0.28 ± 0.10 0.10 ± 0.03 BD vs. AD: .90 (−0.08 to 0.07)
BD vs. C: .003 (−0.26 to −0.08)
AD vs. C: .003 (−0.27 to −0.09) Blood Na + (mmol/L) 139.6 ± 5.7 137.4 ± 3.3 138.4 ± 2.6 BD vs. AD: .36 (−3.2 to 7.6)
BD vs. C: .49 (−5.0 to 2.5)
AD vs. C: .49 (−1.8 to 3.7) Blood creatinine (mg/dL) 6.86 ± 3.15 6.22 ± 2.35 0.91 ± 0.15 BD vs. AD: .41 (−1.1 to 2.4)
BD vs. C: .02 (−8.9 to −3.0)
AD vs. C: .01 (−7.5 to −3.1) Body weight (kg) 85.9 ± 14.8 80.5 ± 12.2 73.9 ± 6.8 BD vs. AD: .017 (1.4–9.2)
BD vs. C: .018 (−21.7 to −2.3)
AD vs. C: .123 (−15.2 to 2.0) Systolic blood pressure (mm Hg) 145.0 ± 26.1 122.4 ± 20.6 123.8 ± 18.5 BD vs. AD: .007 (8.8–36.4)
BD vs. C: .043 (−41.7 to −0.7)
AD vs. C: .88 (−17.2 to 19.9) Diastolic blood pressure (mm Hg) 81.0 ± 16.7 72.3 ± 16.0 76.1 ± 9.8 BD vs. AD: .024 (1.6–15.8)
BD vs. C: .41 (−16.9 to 7.1)
AD vs. C: .50 (−7.9 to 15.6)
AD, after acute hemodialysis; AU, arbitrary unit; BD, before acute hemodialysis; C, controls (healthy subjects).
Descriptive data, Na + and H 2 O content in muscle (triceps surae muscle) and skin, Na + /creatinine blood levels, body weights, and blood pressure values in patients with acute renal injury before and after acute hemodialysis therapy and of the control group are presented (mean ± standard deviation). P values (two-tailed Student t test) and confidence intervals (95% confidence level) are shown.
Get Radiology Tree app to read full this article<
23 Na/ 1 H-MRI and Plasma Na +
Get Radiology Tree app to read full this article<
Get Radiology Tree app to read full this article<
![Figure 3, ( Upper row ) 23 Na scans (gradient echo 23 Na sequence) of a 61-year-old patient before and after acute hemodialysis therapy. The amount of Na + in the skin, as well as in the skeletal muscle, did not significantly change. At the far right is a healthy person with little sodium in the skin and muscle. Four tubes containing aqueous solutions with increasing Na + concentrations (10, 20, 30, and 40 mmol/L NaCl) were positioned inside the coil just below the patient's lower leg. Grayscale measurements of the tubes served as calibration standards for Na + magnetic resonance imaging ( 23 Na-MRI) of the skeletal muscle and the skin by relating intensity to a content in a linear trend analysis. ( Lower row ) The same patient before and after acute hemodialysis and the control subject viewed with conventional ( 1 H) MRI (fat-suppressed inversion recovery [IR] sequence). The salt solutions appear white because of their water content.](https://storage.googleapis.com/dl.dentistrykey.com/clinical/3Tesla23NaMagneticResonanceImagingDuringAcuteKidneyInjury/2_1s20S1076633217301770.jpg)
Get Radiology Tree app to read full this article<
Discussion
Get Radiology Tree app to read full this article<
Get Radiology Tree app to read full this article<
Get Radiology Tree app to read full this article<
Get Radiology Tree app to read full this article<
Get Radiology Tree app to read full this article<
Conclusions
Get Radiology Tree app to read full this article<
Acknowledgments
Get Radiology Tree app to read full this article<
References
1. Kotchen T.A., Cowley A.W., Frohlich E.D.: Salt in health and disease—a delicate balance. N Engl J Med 2013; 368: pp. 2531-2532.
2. Titze J., Bauer K., Schafflhuber M., et. al.: Internal sodium balance in DOCA-salt rats: a body composition study. Am J Physiol Renal Physiol 2005; 289: pp. F793-F802.
3. Titze J., Lang R., Ilies C., et. al.: Osmotically inactive skin Na+ storage in rats. Am J Physiol Renal Physiol 2003; 285: pp. F1108-F1117.
4. Ziomber A., Machnik A., Dahlmann A., et. al.: Sodium-, potassium-, chloride-, and bicarbonate-related effects on blood pressure and electrolyte homeostasis in deoxycorticosterone acetate-treated rats. Am J Physiol Renal Physiol 2008; 295: pp. F1752-F1763.
5. Machnik A., Dahlmann A., Kopp C., et. al.: Mononuclear phagocyte system depletion blocks interstitial tonicity-responsive enhancer binding protein/vascular endothelial growth factor C expression and induces salt-sensitive hypertension in rats. Hypertension 2010; 55: pp. 755-761.
6. Machnik A., Neuhofer W., Jantsch J., et. al.: Macrophages regulate salt-dependent volume and blood pressure by a vascular endothelial growth factor-C-dependent buffering mechanism. Nat Med 2009; 15: pp. 545-552.
7. Wiig H., Schroder A., Neuhofer W., et. al.: Immune cells control skin lymphatic electrolyte homeostasis and blood pressure. J Clin Invest 2013; 123: pp. 2803-2815.
8. Kopp C., Linz P., Dahlmann A., et. al.: 23Na magnetic resonance imaging-determined tissue sodium in healthy subjects and hypertensive patients. Hypertension 2013; 61: pp. 635-640.
9. Kopp C., Linz P., Wachsmuth L., et. al.: (23)Na magnetic resonance imaging of tissue sodium. Hypertension 2012; 59: pp. 167-172.
10. Kopp C., Linz P., Hammon M., et. al.: Seeing the sodium in a patient with hypernatremia. Kidney Int 2012; 82: pp. 1343-1344.
11. Dahlmann A., Dorfelt K., Eicher F., et. al.: Magnetic resonance-determined sodium removal from tissue stores in hemodialysis patients. Kidney Int 2015; 87: pp. 434-441.
12. Levin N.W., Kotanko P., Eckardt K.U., et. al.: Blood pressure in chronic kidney disease stage 5D-report from a Kidney Disease: Improving Global Outcomes controversies conference. Kidney Int 2010; 77: pp. 273-284.
13. Agarwal R., Alborzi P., Satyan S., et. al.: Dry-weight reduction in hypertensive hemodialysis patients (DRIP): a randomized, controlled trial. Hypertension 2009; 53: pp. 500-507.
14. Al-Hilali N., Al-Humoud H., Ninan V.T., et. al.: Blood pressure control in haemodialysis patients: an audit. Nephrology (Carlton) 2006; 11: pp. 100-104.
15. Chazot C.: Can chronic volume overload be recognized and prevented in hemodialysis patients? Use of a restricted-salt diet. Semin Dial 2009; 22: pp. 482-486.
16. Davenport A.: Audit of the effect of dialysate sodium concentration on inter-dialytic weight gains and blood pressure control in chronic haemodialysis patients. Nephron Clin Pract 2006; 104: pp. c120-c125.
17. Hur E., Usta M., Toz H., et. al.: Effect of fluid management guided by bioimpedance spectroscopy on cardiovascular parameters in hemodialysis patients: a randomized controlled trial. Am J Kidney Dis 2013; 61: pp. 957-965.
18. Kayikcioglu M., Tumuklu M., Ozkahya M., et. al.: The benefit of salt restriction in the treatment of end-stage renal disease by haemodialysis. Nephrol Dial Transplant 2009; 24: pp. 956-962.
19. Krautzig S., Janssen U., Koch K.M., et. al.: Dietary salt restriction and reduction of dialysate sodium to control hypertension in maintenance haemodialysis patients. Nephrol Dial Transplant 1998; 13: pp. 552-553.
20. Frohlich E.D., Susic D.: Sodium and its multiorgan targets. Circulation 2011; 124: pp. 1882-1885.
21. Titze J., Shakibaei M., Schafflhuber M., et. al.: Glycosaminoglycan polymerization may enable osmotically inactive Na+ storage in the skin. Am J Physiol Heart Circ Physiol 2004; 287: pp. H203-H208.
22. Rakova N., Juttner K., Dahlmann A., et. al.: Long-term space flight simulation reveals infradian rhythmicity in human Na(+) balance. Cell Metab 2013; 17: pp. 125-131.
23. Bottomley P.A.: Sodium MRI in human heart: a review. NMR Biomed 2016; 29: pp. 187-196.
24. Madelin G., Lee J.S., Regatte R.R., et. al.: Sodium MRI: methods and applications. Prog Nucl Magn Reson Spectrosc 2014; 79: pp. 14-47.
25. Maudsley A.A., Hilal S.K.: Biological aspects of sodium-23 imaging. Br Med Bull 1984; 40: pp. 165-166.
26. Rochitte C.E., Kim R.J., Hillenbrand H.B., et. al.: Microvascular integrity and the time course of myocardial sodium accumulation after acute infarction. Circ Res 2000; 87: pp. 648-655.
27. Zaaraoui W., Konstandin S., Audoin B., et. al.: Distribution of brain sodium accumulation correlates with disability in multiple sclerosis: a cross-sectional 23Na MR imaging study. Radiology 2012; 264: pp. 859-867.
28. Ouwerkerk R., Jacobs M.A., Macura K.J., et. al.: Elevated tissue sodium concentration in malignant breast lesions detected with non-invasive 23Na MRI. Breast Cancer Res Treat 2007; 106: pp. 151-160.
29. Madelin G., Babb J., Xia D., et. al.: Articular cartilage: evaluation with fluid-suppressed 7.0-T sodium MR imaging in subjects with and subjects without osteoarthritis. Radiology 2013; 268: pp. 481-491.
30. Bansal N., Szczepaniak L., Ternullo D., et. al.: Effect of exercise on (23)Na MRI and relaxation characteristics of the human calf muscle. J Magn Reson Imaging 2000; 11: pp. 532-538.
31. Chang G., Wang L., Schweitzer M.E., et. al.: 3D 23Na MRI of human skeletal muscle at 7 Tesla: initial experience. Eur Radiol 2010; 20: pp. 2039-2046.
32. Constantinides C.D., Gillen J.S., Boada F.E., et. al.: Human skeletal muscle: sodium MR imaging and quantification-potential applications in exercise and disease. Radiology 2000; 216: pp. 559-568.
33. Nagel A.M., Amarteifio E., Lehmann-Horn F., et. al.: 3 Tesla sodium inversion recovery magnetic resonance imaging allows for improved visualization of intracellular sodium content changes in muscular channelopathies. Invest Radiol 2011; 46: pp. 759-766.
34. Weber M.A., Nielles-Vallespin S., Essig M., et. al.: Muscle Na+ channelopathies: MRI detects intracellular 23Na accumulation during episodic weakness. Neurology 2006; 67: pp. 1151-1158.
35. Weber M.A., Nielles-Vallespin S., Huttner H.B., et. al.: Evaluation of patients with paramyotonia at 23Na MR imaging during cold-induced weakness. Radiology 2006; 240: pp. 489-500.
36. Kopp C., Beyer C., Linz P., et. al.: Na+ deposition in the fibrotic skin of systemic sclerosis patients detected by 23Na-magnetic resonance imaging. Rheumatology (Oxford) 2016; kew371 [pii]
37. Helle F., Karlsen T.V., Tenstad O., et. al.: High-salt diet increases hormonal sensitivity in skin pre-capillary resistance vessels. Acta Physiol (Oxf) 2013; 207: pp. 577-581.
38. Kleinewietfeld M., Manzel A., Titze J., et. al.: Sodium chloride drives autoimmune disease by the induction of pathogenic TH17 cells. Nature 2013; 496: pp. 518-522.
39. Schafflhuber M., Volpi N., Dahlmann A., et. al.: Mobilization of osmotically inactive Na+ by growth and by dietary salt restriction in rats. Am J Physiol Renal Physiol 2007; 292: pp. F1490-F1500.
40. Bergstrom W.H.: The participation of bone in total body sodium metabolism in the rat. J Clin Invest 1955; 34: pp. 997-1004.
41. Edelman I.S., Leibman J.: Anatomy of body water and electrolytes. Am J Med 1959; 27: pp. 256-277.
42. Farber S.J.: Mucopolysaccharides and sodium metabolism. Circulation 1960; 21: pp. 941-947.
43. Farber S.J., Schubert M., Schuster N.: The binding of cations by chondroitin sulfate. J Clin Invest 1957; 36: pp. 1715-1722.
44. Edelman I.S., Leibman J., O’Meara M.P., et. al.: Interrelations between serum sodium concentration, serum osmolarity and total exchangeable sodium, total exchangeable potassium and total body water. J Clin Invest 1958; 37: pp. 1236-1256.
45. Hammon M., Grossmann S., Linz P., et. al.: 23 Na magnetic resonance imaging of the lower leg of acute heart failure patients during diuretic treatment. PLoS ONE 2015; 10: pp. e0141336.
46. Schneider M.P., Raff U., Kopp C., et. al.: Skin sodium concentration correlates with left ventricular hypertrophy in CKD. J Am Soc Nephrol 2017; ASN.2016060662 [pii]
47. Jantsch J., Schatz V., Friedrich D., et. al.: Cutaneous Na+ storage strengthens the antimicrobial barrier function of the skin and boosts macrophage-driven host defense. Cell Metab 2015; 21: pp. 493-501.
48. Nagel A.M., Laun F.B., Weber M.A., et. al.: Sodium MRI using a density-adapted 3D radial acquisition technique. Magn Reson Med 2009; 62: pp. 1565-1573.