
Rationale and Objectives
The aim of the work described here was to determine the feasibility of monitoring Na + concentration and distribution in muscle/skin during aerobic/anaerobic exercise with 23 Na magnetic resonance imaging (MRI).
Materials and Methods
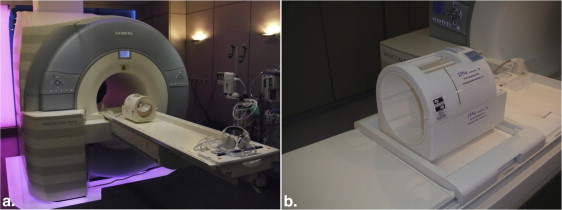
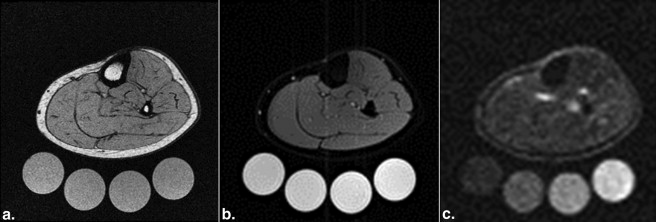
The Na + concentration and water content of muscle/skin of the left lower leg of six healthy subjects (mean age, 26 years; range, 22–30 years; three men and three women) were assessed before and after aerobic/anaerobic cycle ergometry and during recovery with 3-T 23 Na/ 1 H MRI. 23 Na MRI was performed with a custom-made knee coil. A gradient echo sequence with an acquisition time of 3.25 minutes, echo time of 2.07 ms, repetition time of 100 ms, and spatial resolution of 3 × 3 × 30 mm 3 was applied. Phantoms with increasing sodium concentration served for quantification via linear extrapolation. Blood values were determined by blood gas analysis.
Results
The concentration of Na + significantly increased during anaerobic exercise in all muscle compartments except the medial gastrocnemius muscle, whereas no significant change was observed in most muscle compartments during aerobic exercise (only the soleus muscle exhibited a significant increase in Na + concentration during aerobic exercise: 1.6 ± 1.5 mmol/kg, 4.5%, P = .046). During anaerobic exercise, the mean Na + concentration of the triceps surae and the whole leg increased by 9.0% (3.1 ± 2.1 mmol/kg, P = .016) and 6.5% (2.2 ± 1.3 mmol/kg, P < .01). MRI revealed a water-independent increase in Na + concentration in most muscle compartments during anaerobic exercise. Na + concentration significantly decreased during recovery after anaerobic and aerobic exercise in all muscle compartments except the soleus. The Na + concentration of the skin did not significantly change during anaerobic/aerobic exercise.
Conclusions
Sodium 23 MRI allows reliable and noninvasive visualization and quantification of Na + concentration and distribution in muscle and skin during exercise. 23 Na MRI can be used to gain new insights into Na + homeostasis, presumably leading to better comprehension of pathophysiology.
The physiology of skeletal muscles can be examined with magnetic resonance imaging (MRI). After exercise, the skeletal muscle T2 relaxation value increases, resulting in a gain in signal intensity on T2-weighted 1 H MRI . The predominant cause is the intracellular accumulation of metabolites (eg, lactate) and the resulting osmotic shift of water from the extracellular to the intracellular space . Recently published studies indicate that 23 Na MRI has the potential to provide insight into muscle physiology . We have described the relevance of this regulatory system to salt-sensitive hypertension . Furthermore, in long-term balance studies by our group, we documented infradian rhythms in Na + balance and excretion that are highly consistent with an additional Na + storage compartment . We used carcass ashing and atomic absorption spectrometry, methods that clearly that have no human application . To study patients and normal subjects, we developed 23 Na MRI. We constructed a coil for 23 Na MRI with the upper calf as a target that allows skin, skeletal muscle, and bone to be investigated. In earlier studies, we validated the utility of this method in experimental animals and human subjects, including patients on hemodialysis .
It is well known that there are large concentration differences in sodium (Na + ) and potassium (K + ) between the intracellular and extracellular spaces, resulting in potential differences over membranes. In skeletal muscle, a low concentration of Na + (10–30 mmol/L) and a high concentration of K + (140 mmol/L) predominate intracellularly. In contrast, the extracellular concentrations are 145 mmol/L for Na + and 4 mmol/L for K + . Responsible for this gradient over the membrane is Na + /K + -ATPase (adenosine triphosphatase), which pumps 3 Na + ions from the intracellular to the extracellular space and 2 K + ions in the reverse direction. Muscle contraction–initiating action potentials cause a sudden influx of Na + ions and efflux of K + ions. During exercise, these ion shifts degrade the transmembrane gradients, leading to increasing loss of membrane excitability and muscle contractility, which are believed to be the main causes of muscle fatigue .
Get Radiology Tree app to read full this article<
Get Radiology Tree app to read full this article<
Materials and methods
Participant Recruitment and Experimental Setup
Get Radiology Tree app to read full this article<
Get Radiology Tree app to read full this article<
Table 1
Characteristics of the Participants
Gender 3 Female, 3 male Age, y 25.8 ± 2.9 (range, 23–30) Anaerobic Exercise Aerobic Exercise Body mass index 23.3 ± 2.9 (range, 18.1–25.8) 23.4 ± 2.9 (range, 18.2–25.7) Heart rate before exercise, 1/min 90.8 ± 10.9 80.2 ± 15.4 Maximum heart rate during exercise, 1/min 191.3 ± 6.2 123.3 ± 13.1 Blood pressure before exercise, mm Hg 123/75 ± 9/3 111/70 ± 11/7 Maximum blood pressure during exercise, mm Hg 193/94 ± 30/35 133/64 ± 8/6 Maximum ergometer workload, W 200 ± 54 71 ± 29
Get Radiology Tree app to read full this article<
Get Radiology Tree app to read full this article<
Imaging Technique
Get Radiology Tree app to read full this article<
Get Radiology Tree app to read full this article<
Get Radiology Tree app to read full this article<
Table 2
Scanning Protocol
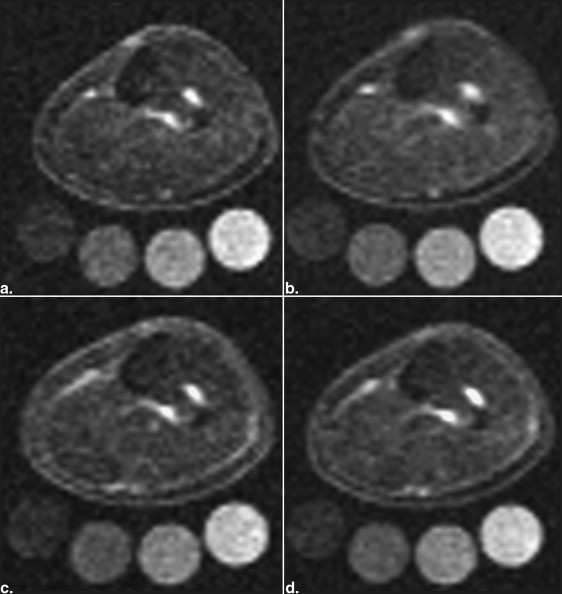
Parameter Localizer T1-Weighted Fast-Low-Angle-Shot Sequence Fat-Suppressed Inversion Recovery Sequence Gradient Echo 23 Na Sequence (Acquired 4 Times Successively) Total acquisition time (min) 0.15 2.08 6.22 3.25 Echo time (ms) 4 2.46 12 2.07 Repetition time (ms) 8.6 250 3000 100 Inversion time (ms) — — 210 — Flip angle (°) 20 60 90/180 90 Averages 2 2 1 32 Bandwidth (Hz/pixel) 320 310 130 430 Field of view (mm) 192 192 192 192 Matrix (pixel) 256 256 128 64 Resolution (mm) 0.75 × 0.75 × 10 0.75 × 0.75 × 5 1.5 × 1.5 × 5 3 × 3 × 30
Get Radiology Tree app to read full this article<
Get Radiology Tree app to read full this article<
Image Analysis
Get Radiology Tree app to read full this article<
Get Radiology Tree app to read full this article<
Get Radiology Tree app to read full this article<
Get Radiology Tree app to read full this article<
Statistical Analysis
Get Radiology Tree app to read full this article<
Results
Image Quality Evaluation
Get Radiology Tree app to read full this article<
Tissue Na + Concentration During Anaerobic and Aerobic Exercise
Get Radiology Tree app to read full this article<
Get Radiology Tree app to read full this article<
Get Radiology Tree app to read full this article<
Get Radiology Tree app to read full this article<
Table 3
Tissue Na + Concentration and Water Content (Determined by 23 Na/ 1 H MRI) and Clinical Data/Blood Levels Before Anaerobic (B) and Aerobic Exercise (B′) Exercise, Immediately After Anaerobic (A) and Aerobic (A′) Exercise, and After 50 Min of Recovery (R/R′)
Anaerobic Exercise Aerobic Exercise B A R B′ A′ R′ Na + (mmol/kg) Triceps surae muscle Mean ± SD 34.5 ± 3.7 37.6 ± 3.8 34.3 ± 1.8 34.4 ± 2.7 35.9 ± 2.0 34.0 ± 2.1 Δ (%) 9.0 −8.8 4.3 −5.4P value .016 .014 .117 .015 Peroneal and superficial extensor muscles Mean ± SD 31.9 ± 2.5 35.3 ± 3.7 31.4 ± 1.8 31.9 ± 1.6 33.6 ± 2.1 31.8 ± 1.7 Δ (%) 10.9 −11.3 5.6 −5.4P value .005 .015 .055 .007 Medial gastrocnemius muscle Mean ± SD 34.1 ± 6.4 36.8 ± 5.3 33.1 ± 2.4 33.5 ± 2.8 34.2 ± 2.2 31.9 ± 2.2 Δ (%) 7.8 −9.8 1.9 −6.8P value .085 .033 .483 .012 Lateral gastrocnemius muscle Mean ± SD 34.4 ± 4.9 38.9 ± 2.9 33.9 ± 2.3 34.9 ± 5.5 36.8 ± 2.9 33.8 ± 2.8 Δ (%) 13.2 −12.7 5.3 −8.1P value .032 .000143 .309 .006 Soleus muscle Mean ± SD 34.9 ± 1.9 37.9 ± 3.5 35.4 ± 1.6 35.3 ± 1.6 36.9 ± 1.8 35.5 ± 1.9 Δ (%) 8.6 −6.6 4.5 −3.9P value .013 .060 .046 .095 Skin Mean ± SD 49.7 ± 4.2 50.7 ± 4.2 49.1 ± 3.8 51.9 ± 6.0 50.3 ± 4.3 49.7 ± 4.9 Δ (%) 2.0 −3.1 −3.1 −1.3P value .215 .102 .104 .192 Bone marrow Mean ± SD 16.5 ± 4.4 18.2 ± 5.1 19.1 ± 5.4 19.6 ± 5.3 17.6 ± 5.3 18.1 ± 6.6 Δ (%) 10.5 4.9 −10.0 2.7P value .453 .735 .324 .833 Whole leg Mean ± SD 34.0 ± 2.2 36.2 ± 1.8 33.5 ± 1.6 34.5 ± 2.7 35.4 ± 1.7 33.9 ± 2.1 Δ (%) 6.5 −7.2 2.7 −4.1P value .008 .007 .155 .007 H 2 O (kg/L) Triceps surae muscle Mean ± SD 0.49 ± 0.03 0.50 ± 0.02 0.50 ± 0.02 0.49 ± 0.01 0.50 ± 0.02 0.49 ± 0.01 Δ (%) 1.6 −1.0 1.9 −1.0P value .212 .192 .034 .194 Peroneal and superficial extensor muscles Mean ± SD 0.50 ± 0.03 0.51 ± 0.03 0.50 ± 0.03 0.50 ± 0.02 0.51 ± 0.02 0.51 ± 0.02 Δ (%) 2.7 −2.5 3.5 −1.7P value .020 .102 .024 .107 Medial gastrocnemius muscle Mean ± SD 0.46 ± 0.03 0.46 ± 0.02 0.45 ± 0.02 0.45 ± 0.02 0.45 ± 0.01 0.44 ± 0.01 Δ (%) 0.3 −2.2 0.9 −2.1P value .851 .083 .217 .032 Lateral gastrocnemius muscle Mean ± SD 0.54 ± 0.04 0.56 ± 0.04 0.54 ± 0.03 0.54 ± 0.04 0.54 ± 0.04 0.53 ± 0.03 Δ (%) 2.4 −2.0 −0.3 −1.0P value .379 .132 .843 .438 Soleus muscle Mean ± SD 0.51 ± 0.02 0.52 ± 0.02 0.52 ± 0.02 0.51 ± 0.01 0.52 ± 0.04 0.52 ± 0.01 Δ (%) 1.6 0.3 3.0 −0.2P value .137 .635 .018 .787 Skin Mean ± SD 0.08 ± 0.03 0.07 ± 0.03 0.07 ± 0.04 0.09 ± 0.04 0.07 ± 0.03 0.08 ± 0.03 Δ (%) −6.5 3.8 −14.7 3.8P value .157 .388 .063 .132 Bone marrow Mean ± SD 0.05 ± 0.02 0.07 ± 0.02 0.06 ± 0.02 0.07 ± 0.01 0.06 ± 0.02 0.06 ± 0.02 Δ (%) 27.4 −14.7 −6.0 −13.4P value .041 .073 .625 .061 Whole leg Mean ± SD 0.34 ± 0.04 0.35 ± 0.04 0.34 ± 0.04 0.34 ± 0.04 0.35 ± 0.04 0.34 ± 0.04 Δ (%) 2.3 −1.7 2.1 −1.5P value .082 .073 .042 .125 Clinical Body weight (kg) Mean ± SD 70.8 ± 8.4 70.6 ± 8.3 70.4 ± 8.3 71.1 ± 8.3 71.0 ± 8.3 71.0 ± 8.3 Δ (%) −0.4 −0.2 −0.1 −0.1P value .004 .025 .041 .025 Blood Na + (mmol/L) Mean ± SD 139.8 ± 1.9 144.5 ± 4.0 140.0 ± 2.3 140.8 ± 1.3 141.8 ± 1.7 140.0 ± 1.9 Δ (%) 3.3 −3.1 0.7 −1.3P value .005 .003 .144 .020 Blood K + (mmol/L) Mean ± SD 3.7 ± 0.1 4.8 ± 0.5 4.2 ± 0.4 3.9 ± 0.6 4.0 ± 0.5 5.0 ± 1.6 Δ (%) 29.5 −13.8 3.9 24.6P value .004 .006 .560 .180 Blood lactate (mmol/L) Mean ± SD 1.2 ± 0.3 11.2 ± 2.8 1.8 ± 1.1 1.0 ± 0.2 1.1 ± 0.6 0.8 ± 0.2 Δ (%) 877.4 −83.7 7.1 −28.3P value .0002 .0001 .816 .276 Blood pH Mean ± SD 7.4 ± 0.03 7.2 ± 0.1 7.4 ± 0.02 7.4 ± 0.02 7.4 ± 0.03 7.4 ± 0.03 Δ (%) −2.0 2.1 0.4 −0.1P value .003 .002 .111 .295 Blood bicarbonate (mmol/L) Mean ± SD 25.7 ± 1.6 16.6 ± 1.1 24.7 ± 1.8 25.5 ± 2.2 24.6 ± 2.2 25.6 ± 2.2 Δ (%) −35.6 49.0 −3.6 4.2P value .00009 .0003 .332 .14 Blood anion gap (mmol/L) Mean ± SD 6.2 ± 2.9 16.6 ± 5.0 6.5 ± 2.1 5.7 ± 1.9 6.5 ± 1.9 4.1 ± 3.2 Δ (%) 169.0 −60.9 15.0 −37.8P value .00037 .001 .34 .042
SD, standard deviation.
![Figure 4, Mean Na + concentration (mean ± standard deviation; 23 Na magnetic resonance imaging [MRI; 2.07 ms, mmol/kg]) before (b)after (a ) anaerobic ( blue ) and aerobic ( gray ) cycle ergometry and after recovery (roughly 50 minutes, after recovery). The curves are plotted for five compartments of the calf: triceps surae, peroneal muscles/superficial extensor muscles, lateral gastrocnemius, skin, and whole leg. Na + concentrations before anaerobic and aerobic exercise were equal in most compartments except the skin (anaerobic measurement, 34.6 ± 4.8 mmol/kg; aerobic measurement, 37.1 ± 6.9 mmol/kg; P = .047). Na + concentration significantly increased during anaerobic exercise in all muscle compartments except the medial gastrocnemius, whereas no significant change was observed in most muscle compartments during aerobic exercise (only in the soleus muscle was there a significant increase in Na + concentration during aerobic exercise: 1.6 ± 1.5 mmol/kg, 4.5%, P = .046). Na + concentration significantly decreased during recovery after anaerobic and aerobic exercise in all muscle compartments except the soleus. The Na + concentration of the skin did not significantly change during anaerobic/aerobic exercise and during recovery.](https://storage.googleapis.com/dl.dentistrykey.com/clinical/3Tesla23NaMagneticResonanceImagingDuringAerobicandAnaerobicExercise/3_1s20S1076633215002524.jpg)
Get Radiology Tree app to read full this article<
Water Content in the Course of Anaerobic and Aerobic Exercise
Get Radiology Tree app to read full this article<
Clinical Data and Blood Levels
Get Radiology Tree app to read full this article<
Get Radiology Tree app to read full this article<
Discussion
Get Radiology Tree app to read full this article<
Get Radiology Tree app to read full this article<
Get Radiology Tree app to read full this article<
Get Radiology Tree app to read full this article<
Get Radiology Tree app to read full this article<
Get Radiology Tree app to read full this article<
Get Radiology Tree app to read full this article<
Get Radiology Tree app to read full this article<
Get Radiology Tree app to read full this article<
Get Radiology Tree app to read full this article<
Conclusions and perspectives
Get Radiology Tree app to read full this article<
Acknowledgments
Get Radiology Tree app to read full this article<
Get Radiology Tree app to read full this article<
Get Radiology Tree app to read full this article<
References
1. Fleckenstein J.L., Canby R.C., Parkey R.W., et. al.: Acute effects of exercise on MR imaging of skeletal muscle in normal volunteers. AJR Am J Roentgenol 1988; 151: pp. 231-237.
2. Fleckenstein J.L., Bertocci L.A., Nunnally R.L., et. al.: Exercise-enhanced MR imaging of variation in forearm muscle anatomy and use: importance in MR spectroscopy. Am J Roentgenol 1989; 153: pp. 693-698.
3. Patten C., Meyer R.A., Fleckenstein J.L.: T2 mapping of muscle. Semin Musculoskelet Radiol 2003; 7: pp. 297-305.
4. Meyer R.A., Prior B.M.: Functional magnetic resonance imaging of muscle. Exerc Sport Sci Rev 2000; 28: pp. 89-92.
5. Damon B.M., Gregory C.D., Hall K.L., et. al.: Intracellular acidification and volume increases explain R2 decreases in exercising muscle. Magn Reson Med 2002; 47: pp. 14-23.
6. Saab G., Thompson R.T., Marsh G.D.: Effects of exercise on muscle transverse relaxation determined by MR imaging and in vivo relaxometry. J Appl Physiol 2000; 88: pp. 226-233.
7. Ploutz-Snyder L.L., Nyren S., Cooper T.G., et. al.: Different effects of exercise and edema on T2 relaxation in skeletal muscle. Magn Reson Med 1997; 37: pp. 676-682.
8. Chang G., Wang L., Schweitzer M.E., et. al.: 3D 23Na MRI of human skeletal muscle at 7 Tesla: initial experience. Eur Radiol 2010; 20: pp. 2039-2046.
9. Weber M.A., Nielles-Vallespin S., Huttner H.B., et. al.: Evaluation of patients with paramyotonia at 23Na MR imaging during cold-induced weakness. Radiology 2006; 240: pp. 489-500.
10. Weber M.A., Nielles-Vallespin S., Essig M., et. al.: Muscle Na+ channelopathies: MRI detects intracellular 23Na accumulation during episodic weakness. Neurology 2006; 67: pp. 1151-1158.
11. Nagel A.M., Amarteifio E., Lehmann-Horn F., et. al.: 3 Tesla sodium inversion recovery magnetic resonance imaging allows for improved visualization of intracellular sodium content changes in muscular channelopathies. Invest Radiol 2011; 46: pp. 759-766.
12. Constantinides C.D., Gillen J.S., Boada F.E., et. al.: Human skeletal muscle: sodium MR imaging and quantification—potential applications in disease and exercise. Radiology 2000; 216: pp. 559-568.
13. Bansal N., Szczepaniak L., Ternullo D., et. al.: Effect of exercise on 23Na MRI and relaxation characteristics of human calf muscle. J Magn Reson Imaging 2000; 11: pp. 532-538.
14. Nielles-Vallespin S., Weber M.A., Bock M., et. al.: 3D radial projection technique with ultrashort echo times for sodium MRI: clinical applications in human brain and skeletal muscle. Magn Reson Med 2007; 57: pp. 74-81.
15. Machnik A., Neuhofer W., Jantsch J., et. al.: Macrophages regulate salt-dependent volume and blood pressure by a vascular endothelial growth factor-c-dependent buffering mechanism. Nat Med 2009; 15: pp. 545-552.
16. Wiig H., Schröder A., Neuhofer W., et. al.: Immune cells control skin lymphatic electrolyte homeostasis and blood pressure. J Clin Invest 2013; 123: pp. 2803-2815.
17. Machnik A., Dahlmann A., Kopp C., et. al.: Mononuclear phagocyte system depletion blocks interstitial tonicity-responsive enhancer binding protein/vascular endothelial growth factor C expression and induces salt-sensitive hypertension in rats. Hypertension 2010; 55: pp. 755-761.
18. Rakova N., Jüttner K., Dahlmann A., et. al.: Long-term space flight simulation reveals infradian rhythmicity in human Na(+) balance. Cell Metlab 2013; 17: pp. 125-131.
19. Titze J., Shakibaei M., Schafflhuber M., et. al.: Glycosaminoglycan polymerization may enable osmotically inactive Na+ storage in the skin. Am J Physiol Heart Circ Physiol 2004; 287: pp. 203-208.
20. Titze J., Bauer K., Schafflhuber M., et. al.: Internal sodium balance in doca-salt rats: a body composition study. Am J Physiol Renal Physiol 2005; 289: pp. 793-802.
21. Ziomber A., Machnik A., Dahlmann A., et. al.: Sodium-, potassium-, chloride-, and bicarbonate-related effects on blood pressure and electrolyte homeostasis in deoxycorticosterone acetate-treated rats. Am J Physiol Renal Physiol 2008; 295: pp. 1752-1763.
22. Kopp C., Linz P., Wachsmuth L., et. al.: (23)Na magnetic resonance imaging of tissue sodium. Hypertension 2012; 59: pp. 167-172.
23. Dahlmann A., Dörfelt K., Eicher F., et. al.: Magnetic resonance-determined sodium removal from tissue stores in hemodialysis patients. Kidney Int 2015; 87: pp. 434-441.
24. Clausen T.: Na+-K+ pump regulation and skeletal muscle contractility. Physiol Rev 2003; 83: pp. 1269-1324.
25. Clausen T.: Na+-K+ pump stimulation improves contractility in damaged muscle fibers. Ann NY Acad Sci 2005; 1066: pp. 286-294.
26. Zaaraoui W., Konstandin S., Audoin B., et. al.: Distribution of brain sodium accumulation correlates with disability in multiple sclerosis: a cross-sectional 23Na MR imaging study. Radiology 2012; 264: pp. 859-867.
27. Ouwerkerk R., Jacobs M.A., Macura K.J., et. al.: Elevated tissue sodium concentration in malignant breast lesions detected with non-invasive 23Na MRI. Breast Cancer Res Treat 2007; 106: pp. 151-160.
28. Rochitte C.E., Kim R.J., Hillenbrand H.B., et. al.: Microvascular integrity and the time course of myocardial sodium accumulation after acute infarction. Circ Res 2000; 87: pp. 648-655.
29. Madelin G., Babb J., Xia D., et. al.: Articular cartilage: evaluation with fluid-suppressed 7.0-T sodium MR imaging in subjects with and subjects without osteoarthritis. Radiology 2013; 268: pp. 481-491.
30. Kopp C., Linz P., Dahlmann A., et. al.: 23Na magnetic resonance imaging-determined tissue sodium in healthy subjects and hypertensive patients. Hypertension 2013; 61: pp. 635-640.
31. Nagel A.M., Laun F.B., Weber M.A., et. al.: Sodium MRI using a density-adapted 3D radial acquisition technique. Magn Reson Med 2009; 62: pp. 1565-1573.
32. Barroso F.O., Torricelli D., Moreno J.C., et. al.: Shared muscle synergies in human walking and cycling. J Neurophysiol 2014; 112: pp. 1984-1998.