
Rationale and Objectives
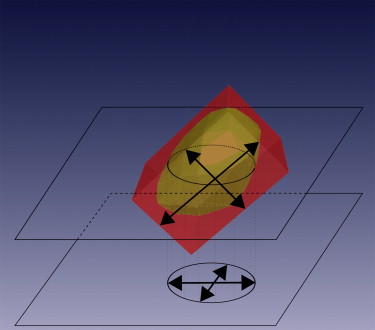
In today’s clinical practice, the size of lymph nodes is assessed by measuring the long and the short axis in the axial plane. This study compares this approach with three-dimensional (3D) assessment.
Materials and Methods
For a representative set of 49 lymph nodes, the axes in the axial plane have been measured and a 3D model has been created manually. Based on the 3D model, the real axial long and short axis as well as the three 3D axes and the volume have been computed and compared to the measured axial axes.
Results
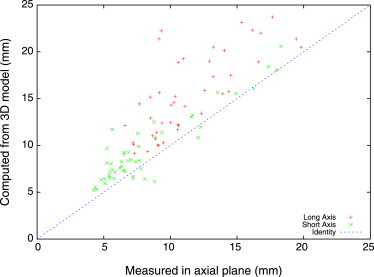
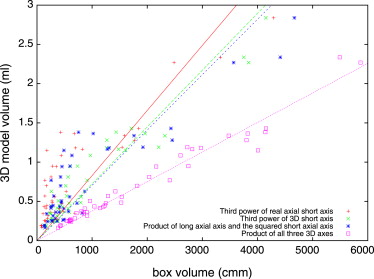
The inter-observer variability is around 10% for all measured lengths and almost 16% for the computed volume. The average relative error of the measured long (short) axial axis is 9.73% (24.57%) to the computed axial axis and 25.05% (19.97%) to the computed 3D axis, respectively. The product of the axial long axis and the square of the axial short axis provides best correlation to the volume.
Conclusion
This study confirms Response Evaluation Criteria In Solid Tumours 1.1 that measuring the short axis is more robust than measuring the long axis because of less impact of the node’s spatial orientation. Nonetheless it is shown that considering both axes is a better prognostic factor for the volume than measuring the short axis only.
The presence and location of lymph node metastases (N descriptor) is an important component of radiologic staging in patients with cancer of different types. Malignant lymph nodes are common target and nontarget lesions, whose sizes have to be assessed for staging and disease progression monitoring.
For example in oral cancer, accurate staging is the most important factor that guides therapeutic decision making. Staging methods include radiological assessment that usually entails imaging of the neck with computed tomography (CT) or magnetic resonance imaging, or both. Lymphatic metastases will develop in 20%–30% of patients with early oral cancers and imply decreased survival .
Get Radiology Tree app to read full this article<
Get Radiology Tree app to read full this article<
Get Radiology Tree app to read full this article<
Materials and methods
Get Radiology Tree app to read full this article<
Get Radiology Tree app to read full this article<
Get Radiology Tree app to read full this article<
Get Radiology Tree app to read full this article<
Get Radiology Tree app to read full this article<
Get Radiology Tree app to read full this article<
Get Radiology Tree app to read full this article<
Get Radiology Tree app to read full this article<
Results
Get Radiology Tree app to read full this article<
Table 1
Inter-observer Variability
Absolute Relative Standard Deviation Standard Deviation (%) Measured long axial axis 1.03 mm 9.01 Measured short axial axis 1.02 mm 11.45 Computed long axial axis 1.07 mm 8.00 Computed short axial axis 0.89 mm 8.37 Computed long three-dimensional axis 1.74 mm 9.80 Computed short three-dimensional axis 0.81 mm 8.83 Computed volume 0.17 mL 15.94
Get Radiology Tree app to read full this article<
Get Radiology Tree app to read full this article<
Get Radiology Tree app to read full this article<
Get Radiology Tree app to read full this article<
Get Radiology Tree app to read full this article<
Get Radiology Tree app to read full this article<
Get Radiology Tree app to read full this article<
Get Radiology Tree app to read full this article<
Get Radiology Tree app to read full this article<
Get Radiology Tree app to read full this article<
Discussion
Get Radiology Tree app to read full this article<
Get Radiology Tree app to read full this article<
Future work
Get Radiology Tree app to read full this article<
Acknowledgments
Get Radiology Tree app to read full this article<
Get Radiology Tree app to read full this article<
References
1. Civantos F.J., Zitsch R.P., Schuller D.E., et. al.: Sentinel lymph node biopsy accurately stages the regional lymph nodes for t1-t2 oral squamous cell carcinomas: results of a prospective multi-institutional trial. J Clin Oncol 2010; 28: pp. 1395-1400.
2. Prasad S.R., Jhaveri K.S., Saini S., et. al.: CT tumor measurement for therapeutic response assessment: comparison of unidimensional, bidimensional, and volumetric techniques initial observations. Radiology 2002; 225: pp. 416-419.
3. Heussel C.P., Meier S., Wittelsberger S., et. al.: Follow-up CT measurement of liver malignoma according to RECIST and WHO vs. volumetry. Rofo 2007; 179: pp. 958-964.
4. Therasse P., Arbuck S.G., Eisenhauer E.A., et. al.: New guidelines to evaluate the response to treatment in solid tumors. European Organization for Research and Treatment of Cancer, National Cancer Institute of the United States, National Cancer Institute of Canada. J Natl Cancer Inst 2000; 92: pp. 205-216.
5. Eisenhauer E.A., Therasse P., Bogaerts J., et. al.: New Response Evaluation Criteria In Solid Tumours: revised RECIST guideline (version 1.1). Eur J Cancer 2009; 45: pp. 228-247.
6. Schwartz L.H., Bogaerts J., Ford R., et. al.: Evaluation of lymph nodes with RECIST 1.1. Eur J Cancer 2009; 45: pp. 261-267.
7. Toussaint G.: Solving geometric problems with the rotating calipers.Protonotarios E.N.MELECON 1983.1983.IEEENY: A10.02/1-4
8. Dornheim L., Dornheim J., Rossling I., et. al.: Model-based segmentation of pathological lymph nodes in CT data. SPIE 2010; 7623: 76234V