
Rationale and Objectives
Breast cancer occurs more frequently in the upper outer (UO) quadrant, but whether this higher cancer incidence is related to the greater amount of dense tissue is not known. Magnetic resonance imaging acquires three-dimensional volumetric images and is the most suitable among all breast imaging modalities for regional quantification of density. This study applied a magnetic resonance imaging-based method to measure quadrant percent density (QPD), and evaluated its association with the quadrant location of the developed breast cancer.
Materials and Methods
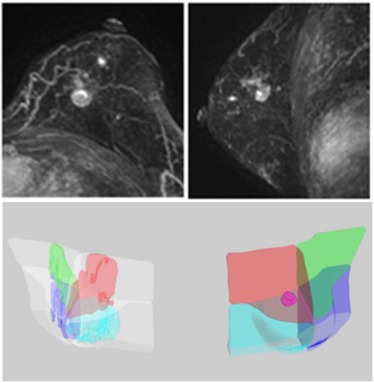
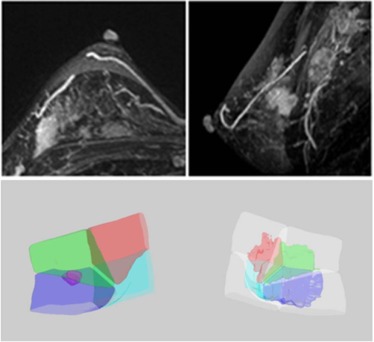
A total of 126 cases with pathologically confirmed breast cancer were reviewed. Only women who had unilateral breast cancer located in a clear quadrant were selected for analysis. A total of 84 women, including 47 Asian women and 37 western women, were included. An established computer-aided method was used to segment the diseased breast and the contralateral normal breast, and to separate the dense and fatty tissues. Then, a breast was further separated into four quadrants using the nipple and the centroid as anatomic landmarks. The tumor was segmented using a computer-aided method to determine its quadrant location. The distribution of cancer quadrant location, the quadrant with the highest QPD, and the proportion of cancers occurring in the highest QPD were analyzed.
Results
The highest incidence of cancer occurred in the UO quadrant (36 out of 84, 42.9%). The highest QPD was also noted most frequently in the UO quadrant (31 out of 84, 36.9%). When correlating the highest QPD with the quadrant location of breast cancer, only 17 women out of 84 (20.2%) had breast cancer occurring in the quadrant with the highest QPD.
Conclusions
The results showed that the development of breast cancer in a specific quadrant could not be explained by the density in that quadrant, and further studies are needed to find the biological reasons accounting for the higher breast cancer incidence in the UO quadrant.
Introduction
Mammographic density (MD) is an independent risk factor for development of breast cancer . The biological basis for the association between increased breast cancer risk and higher MD is not fully understood. Studies of mammographically dense tissues suggest that density may represent increased epithelial cellular concentration, stromal fibrosis, and epithelial hyperplasia . A fundamental question that has yet to be answered is whether cancers tend to arise in mammographically dense tissue. Among several studies exploring the question, two studies showed that tumors occur overwhelmingly in the mammographically dense areas, suggesting that some aspects of glandular or stromal tissue comprising the dense tissue directly influence the carcinogenic process . Another study, however, found that after accounting for overall density, the regional density was not a significant risk factor for subsequently developed cancer .
Many studies have shown the quadrant disparity of cancer risk and noted that the upper outer (UO) quadrant was the most frequent site of carcinoma . A study consisting of 746 consecutive breast core biopsies found that 217 of 349 (62%) malignant lesions (95% confidence interval: 57%–67%) occurred in the UO quadrant . An adequate explanation for this asymmetric occurrence of breast cancer has never been established. Is the disparity of breast cancer in different quadrants related to the amount of breast density? As the first step to answer this question, it is necessary to develop a reliable quantification method to measure quadrant breast density. Most published studies analyzed the cancer risk related to the whole breast density, which did not consider the spatial variation of the dense tissue in the breast.
Get Radiology Tree app to read full this article<
Get Radiology Tree app to read full this article<
Materials and Methods
Subjects
Get Radiology Tree app to read full this article<
MR Imaging Acquisition
Get Radiology Tree app to read full this article<
Get Radiology Tree app to read full this article<
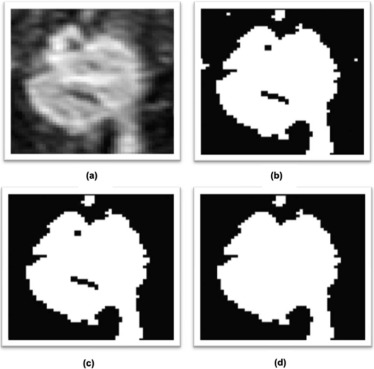
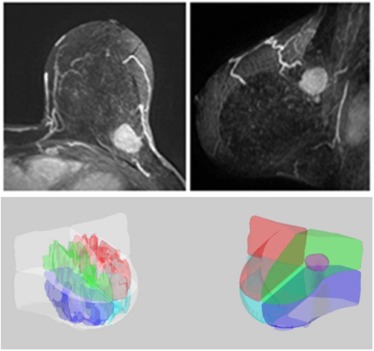
Breast and Fibroglandular Tissue Segmentation
Get Radiology Tree app to read full this article<
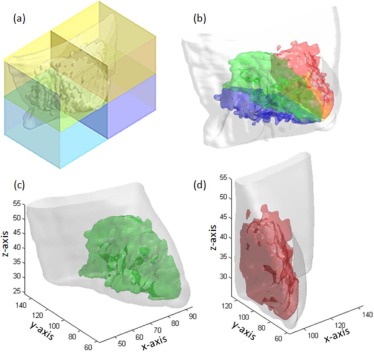
Quadrant Breast Density Assessment
Get Radiology Tree app to read full this article<
Get Radiology Tree app to read full this article<
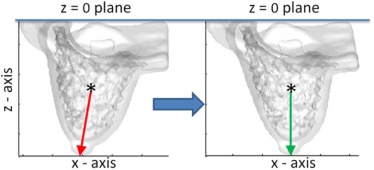
Determination of Tumor Quadrant Location
Get Radiology Tree app to read full this article<
Get Radiology Tree app to read full this article<
Statistics
Get Radiology Tree app to read full this article<
Results
Quadrant BV, FV, and PD
Get Radiology Tree app to read full this article<
Table 1
Breast Volume, Fibroglandular Tissue Volume, and Percent Density in the Four Quadrants in Asian and Western Women
Upper Outer Upper Inner Lower Outer Lower Inner Breast volume (cm 3 ) Asian women ( n = 47) Mean201.8 120.9 199.1 119.2 STD 119.4 66.4 121.1 68.0 Median 170.9 108.7 171.9 109.3 Western women ( n = 37) Mean308.8 269.4 287.5 279.4 STD 135.6 119.0 123.2 123.3 Median 287.1 256.9 281.3 260.5 Fibroglandular tissue volume (cm 3 ) Asian women ( n = 47) Mean 29.5 17.033.1 16.3 STD 19.1 13.3 22.3 14.9 Median 27.2 12.0 28.8 11.2 Western women ( n = 37) Mean44.2 31.4 34.2 27.9 STD 29.6 22.8 20.8 19.4 Median 33.2 26.2 38.8 24.0 Percent density (%) Asian women ( n = 47) Mean 17.5 15.919.6 14.5 STD 12.5 11.5 13.8 11.8 Median 15.3 13.0 15.8 10.0 Western women ( n = 37) Mean14.4 12.2 11.4 10.2 STD 9.3 8.9 6.8 7.7 Median 12.0 9.5 9.6 8.3
STD, standard deviation. The bold value in each row of the Mean indicates the highest measured value among the four quadrants.
Get Radiology Tree app to read full this article<
Quadrant Location of Tumor and Highest QPD
Get Radiology Tree app to read full this article<
Table 2
Distribution of Breast Cancer in the Different Quadrants of the Breast
Upper Outer Upper Inner Lower Outer Lower Inner All subjects ( N = 84) 36(42.9%) 20(23.8%) 17(20.2%) 11(13.1%) Asian women( n = 47) 21(44.7%) 9(19.1%) 7(14.9%) 10(21.3%) Western women( n = 37) 15(40.6%) 11(29.7%) 10(27.0%) 1(2.7%)
Table 3
Distribution of Highest QPD and the Lesions Occurring in the Highest QPD Quadrant
Upper Outer Upper Inner Lower Outer Lower Inner Asian women ( n = 47) Highest QPD 11(23.4%) 8(17.0%) 19(40.4%) 9(19.2%) Lesions in highest QPD 5(45.5%) 0(0%) 2(10.5%) 1(11.1%) Western women( n = 37) Highest QPD 20(54.1%) 7(18.9%) 8(21.6%) 2(5.4%) Lesions in highest QPD 6(30.0%) 2(28.6%) 1(12.5%) 0(0%)
QPD, quadrant percent density.
Get Radiology Tree app to read full this article<
Discussion
Get Radiology Tree app to read full this article<
Get Radiology Tree app to read full this article<
Get Radiology Tree app to read full this article<
Get Radiology Tree app to read full this article<
Get Radiology Tree app to read full this article<
Get Radiology Tree app to read full this article<
Get Radiology Tree app to read full this article<
Acknowledgments
Get Radiology Tree app to read full this article<
References
1. Boyd N.F., Guo H., Martin L.J., et. al.: Mammographic density and the risk and detection of breast cancer. N Engl J Med 2007; 356: pp. 227-236.
2. Vachon C.M., Brandt K.R., Ghosh K., et. al.: Mammographic breast density as a general marker of breast cancer risk. Cancer Epidemiol Biomarkers Prev 2007; 16: pp. 43-49.
3. Britt K., Ingman W., Huo C., et. al.: The pathobiology of mammographic density. J Cancer Biol Res 2014; 2: pp. 1021.
4. Ursin G., Hovanessian-Larsen L., Parisky Y.R., et. al.: Greatly increased occurrence of breast cancers in areas of mammographically dense tissue. Breast Cancer Res 2005; 7: pp. R605-R608.
5. Pinto Pereira S.M., McCormack V.A., Hipwell J.H., et. al.: Localized fibroglandular tissue as a predictor of future tumor location within the breast. Cancer Epidemiol Biomarkers Prev 2011; 20: pp. 1718-1725.
6. Blumgart E.I., Uren R.F., Nielsen P.M., et. al.: Lymphatic drainage and tumour prevalence in the breast: a statistical analysis of symmetry, gender and node field independence. J Anat 2011; 218: pp. 652-659.
7. Lee A.H.: Why is carcinoma of the breast more frequent in the upper outer quadrant? A case series based on needle core biopsy diagnoses. Breast 2005; 14: pp. 151-152.
8. Darbre P.D.: Recorded quadrant incidence of female breast cancer in Great Britain suggests a disproportionate increase in the upper outer quadrant of the breast. Anticancer Res 2005; 25: pp. 2543-2550.
9. Nie K., Chen J.H., Chan S., et. al.: Development of a quantitative method for analysis of breast density based on 3-dimensional breast MRI. Med Phys 2008; 35: pp. 5253-5262.
10. Lin M., Chen J.H., Wang X., et. al.: Template-based automatic breast segmentation on MRI by excluding the chest region. Med Phys 2013; 40: pp. 122301.
11. Chen J.H., Li Y., Su M.Y.: 3D MRI for quantitative analysis of quadrant percent breast density (QPD): correlation with quadrant location of breast cancer. Ann Oncol 2015; 26: pp. 27-28.
12. Pinto Pereira S.M., McCormack V.A., Moss S.M., et. al.: The spatial distribution of radiodense breast tissue: a longitudinal study. Breast Cancer Res 2009; 11: pp. R33.
13. Alterson R., Plewes D.B.: Bilateral symmetry analysis of breast MRI. Phys Med Biol 2003; 48: pp. 3431-3443.
14. Stines J., Tristant H.: The normal breast and its variations in mammography. Eur J Radiol 2005; 54: pp. 26-36.
15. Lin M., Chan S., Chen J.H., et. al.: A new bias field correction method combining N3 and FCM for improved segmentation of breast density on MRI. Med Phys 2011; 38: pp. 5-14.
16. Fwu P.T., Chen J.H., Li Y., et. al.: Quantification of regional breast density in four quadrants using 3D MRI-A pilot study. Transl Oncol 2015; 8: pp. 250-257.
17. Newell D., Nie K., Chen J.H., et. al.: Selection of diagnostic features on breast MRI to differentiate between malignant and benign lesions using computer-aided diagnosis: differences in lesions presenting as mass and non-mass-like enhancement. Eur Radiol 2010; 20: pp. 771-781.
18. Hennessey S., Huszti E., Gunasekura A., et. al.: Bilateral symmetry of breast tissue composition by magnetic resonance in young women and adults. Cancer Causes Control 2014; 25: pp. 491-497.
19. Hussain M.A., Sawkat A., Tyagi S.P., et. al.: Incidence of cancer breast at Aligarh. J Indian Med Assoc 1994; 92: pp. 296-297.
20. Cheung T.T., Suen D.T., Kwong A.: Is sentinel lymph node biopsy after neoadjuvant chemotherapy feasible in Chinese patients with invasive breast cancers?. ANZ J Surg 2009; 79: pp. 719-723.
21. Chen Y.W., Lai Y.C., Hsu C.C., et. al.: Value of nodal drainage patterns and tumor location from lymphoscintigraphic mapping in detecting axillary sentinel lymph node status in breast cancer: experience at Kaohsiung Medical University Hospital. Kaohsiung J Med Sci 2005; 21: pp. 251-257.
22. Rimsten A.: Symptoms and signs in benign and malignant tumours of the breast. Ups J Med Sci 1976; 81: pp. 54-60.
23. Alam I., Awad Z.T., Given H.F.: Cystosarcoma phyllodes of the breast: a clinicopathological study of 11 cases. Ir Med J 2003; 96: pp. 179-180.
24. Harvey P.W., Darbre P.: Endocrine disrupters and human health: could oestrogenic chemicals in body care cosmetics adversely affect breast cancer incidence in women? A review of evidence and call for further research. J Appl Toxicol 2004; 24: pp. 167-176.
25. McGrath K.G.: An earlier age of breast cancer diagnosis related to more frequent use of antiperspirants/deodorants and underarm shaving. Eur J Cancer Prev 2003; 12: pp. 479-485.
26. Ellsworth D.L., Ellsworth R.E., Love B., et. al.: Outer breast quadrants demonstrate increased levels of genomic instability. Ann Surg Oncol 2004; 11: pp. 861-868.