
Rationale and Objectives
A 3-T magnetic resonance imaging system provides a better signal-to-noise ratio and inflow effect than 1.5 T in three-dimensional time-of-flight (3D TOF) magnetic resonance angiography (MRA). The purpose of this study is to analyze the influence of matrix, parallel imaging, and acquisition time on image quality of 3D TOF MRA at 1.5 and 3 T, and to illustrate whether the combination of larger matrixes with parallel imaging technique is feasible, by evaluating the visualization of simulated intracranial aneurysms and aneurysmal blebs using a vascular phantom with pulsatile flow.
Materials and Methods
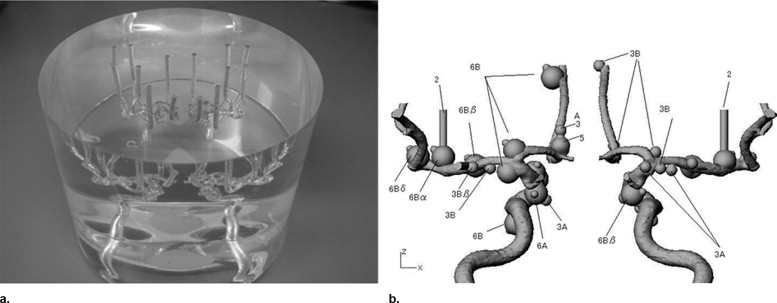
An anthropomorphic vascular phantom was designed to simulate the various intracranial aneurysms with aneurysmal bleb. The vascular phantom was connected to an electromagnetic flow pump with pulsatile flow, and we obtained 1.5- and 3-T MRAs altering the parameters of 3D TOF sequences, including acquisition time. Two radiologists evaluated the depiction of simulated aneurysms and aneurysmal blebs.
Results
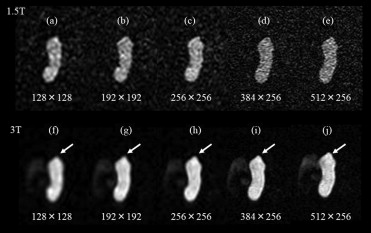
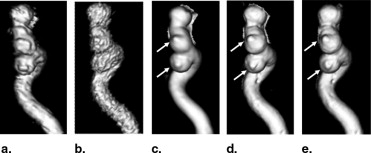
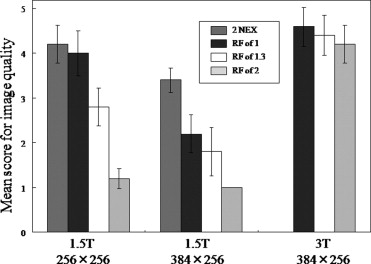
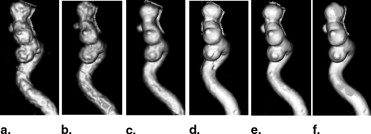
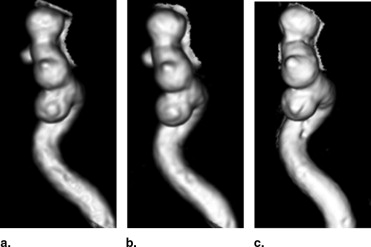
The aneurysmal blebs were not sufficiently visualized on the high-spatial resolution 1.5-T MRA (matrix size of 384 × 256 or 512 × 256), even with longer acquisition time (9 or 18 min). At 3 T with acquisition time of 4.5 min using parallel imaging technique, however, the depiction of aneurysmal blebs was significantly better for the high-spatial resolution sequence than for the standard resolution sequence. For the high-spatial resolution sequence, the longer acquisition times did not improve the depiction of aneurysmal blebs in comparison with 4.5 min at 3 T.
Conclusions
For 3D TOF MRA, the combination of the large matrix with parallel imaging technique is feasible at 3 T, but not at 1.5 T.
Three-dimensional time-of-flight (3D TOF) magnetic resonance angiography (MRA) is a noninvasive imaging modality now readily accepted as a first-line diagnostic tool in magnetic resonance examination of several cerebrovascular diseases ( ). Concerning TOF MRA, the 3-T system offers some potential advantages compared to the 1.5-T system. The approximate doubling of signal-to-noise ratio from 1.5 to 3 T can provide the higher spatial resolution ( ) and the increased T1 relaxation time at higher magnetic field strength yields improvement of vessel–tissue contrast at 3-T imaging ( ). Several previous studies have reported that the high-spatial resolution 3-T MRA allows better visualization of small vessel segments and vascular disease, including intracranial aneurysms and intracranial stenoses and obstructions ( ). The various parameters of the 3D TOF MR angiograms, such as the matrix size, reduction factor in parallel imaging, and acquisition time, however, have not been compared between 1.5 and 3 T.
The purpose of this study is to analyze the influence of matrix, parallel imaging, and acquisition time on image quality of 3D TOF MRA at 1.5 and 3 T, and to illustrate whether the combination of larger matrixes with the parallel imaging technique is feasible, by evaluating the visualization of simulated intracranial aneurysms and aneurysmal blebs using a vascular phantom with pulsatile flow.
Materials and methods
Phantom Design
Get Radiology Tree app to read full this article<
Get Radiology Tree app to read full this article<
Image Acquisition
Get Radiology Tree app to read full this article<
Get Radiology Tree app to read full this article<
Table 1
Scanning Parameters for the 3D Time-of-Flight MRA and Results in Evaluation for the Depiction of Simulated Lesions
Sequence No. TR TE FA BW FOV F-E mtx ST RF NEX AT Mean Score for Image Quality (mean ± standard error) Aneurysm Bleb 1.5T 1 30 6.3 20 31.25 180 mm 128 × 128 1.0 mm 2 1 time 2 min, 18 sec 3.10 ± 0.515 2.20 ± 1.095 2 30 6.3 20 31.25 180 mm 192 × 192 1.0 mm 2 1 time 3 min, 25 sec 3.00 ± 0.426 2.00 ± 1.000 3 30 6.3 20 31.25 180 mm 256 × 256 1.0 mm 2 1 time 4 min, 32 sec 2.58 ± 0.515 1.20 ± 0.447 4 30 6.3 20 31.25 180 mm 256 × 256 1.0 mm 1.3 1 time 6 min, 47 sec 3.30 ± 0.778 2.80 ± 0.837 5 30 6.3 20 31.25 180 mm 256 × 256 1.0 mm NA 1 time 9 min, 1 sec 3.89 ± 0.798 4.00 ± 1.000 6 30 6.3 20 31.25 180 mm 256 × 256 1.0 mm NA 2 times 17 min, 59 sec 4.08 ± 0.669 4.20 ± 0.837 7 30 6.3 20 31.25 180 mm 384 × 256 1.0 mm 2 1 time 4 min, 32 sec 2.25 ± 0.754 1.00 ± 0.000 8 30 6.3 20 31.25 180 mm 384 × 256 1.0 mm 1.3 1 time 6 min, 47 sec 3.20 ± 0.718 1.80 ± 1.095 9 30 6.3 20 31.25 180 mm 384 × 256 1.0 mm NA 1 time 9 min, 1 sec 3.17 ± 0.492 2.20 ± 0.837 10 30 6.3 20 31.25 180 mm 384 × 256 1.0 mm NA 2 times 17 min, 59 sec 3.70 ± 0.492 3.40 ± 0.548 11 30 6.3 20 31.25 180 mm 512 × 256 1.0 mm 2 1 time 4 min, 32 sec 2.08 ± 0.669 1.00 ± 0.000 12 30 6.3 20 31.25 180 mm 512 × 256 1.0 mm NA 2 times 17 min, 59 sec 3.80 ± 0.389 2.80 ± 0.447 3T 1 30 6.3 20 31.25 180 mm 128 × 128 1.0 mm 2 1 time 2 min, 18 sec 3.60 ± 0.515 3.25 ± 0.837 2 30 6.3 20 31.25 180 mm 192 × 192 1.0 mm 2 1 time 3 min, 25 sec 3.70 ± 0.452 3.40 ± 0.548 3 30 6.3 20 31.25 180 mm 256 × 256 1.0 mm 2 1 time 4 min, 32 sec 4.00 ± 0.739 4.20 ± 0.837 4 30 6.3 20 31.25 180 mm 384 × 256 1.0 mm 2 1 time 4 min, 32 sec 4.40 ± 0.515 4.20 ± 0.837 5 30 6.3 20 31.25 180 mm 384 × 256 1.0 mm 1.25 1 time 7 min, 16 sec 4.80 ± 0.389 4.40 ± 0.894 6 30 6.3 20 31.25 180 mm 384 × 256 1.0 mm NA 1 time 9 min, 1 sec 4.80 ± 0.389 4.60 ± 0.894 7 30 6.3 20 31.25 180 mm 512 × 256 1.0 mm 2 1 time 4 min, 32 sec 4.80 ± 0.389 4.40 ± 0.548
TR: repetition time; TE: echo time; FA: flip angle; BW: bandwidth; FOV: field of view; F-E mtx: frequency-encoded matrix; ST: section thickness; RF: reduction factor; NEX: number of excitation; AT: acquisition time; NA: not applicable.
Get Radiology Tree app to read full this article<
Image Analysis of MRA
Get Radiology Tree app to read full this article<
Get Radiology Tree app to read full this article<
Statistical Analysis
Get Radiology Tree app to read full this article<
Results
Get Radiology Tree app to read full this article<
Relationship Between Matrix Size and Image Quality of MRAs with Use of Parallel Imaging (Reduction Factor = 2)
Get Radiology Tree app to read full this article<
Get Radiology Tree app to read full this article<
Relationship Between Acquisition Time (Reduction Factor) and Image Quality of MRAs
Get Radiology Tree app to read full this article<
Get Radiology Tree app to read full this article<
Get Radiology Tree app to read full this article<
Get Radiology Tree app to read full this article<
Interobserver Agreement
Get Radiology Tree app to read full this article<
Discussion
Get Radiology Tree app to read full this article<
Get Radiology Tree app to read full this article<
Get Radiology Tree app to read full this article<
Get Radiology Tree app to read full this article<
References
1. Korogi Y., Takahashi M., Mabuchi N., et. al.: Intracranial aneurysms: diagnostic accuracy of three-dimensional, Fourier transform, time-of-flight MR angiography. Radiology 1994; 193: pp. 187-193.
2. White P.M., Teasdale E.M., Wardlaw J.M., et. al.: Intracranial aneurysms: CT angiography and MR angiography for detection prospective blinded comparison in a large patient cohort. Radiology 2001; 219: pp. 739-749.
3. Huston J., Nichols D.A., Luetmer P.H., et. al.: Blinded prospective evaluation of sensitivity of MR angiography to known intracranial aneurysms: importance of aneurysm size. AJNR Am J Neuroradiol 1994; 15: pp. 1607-1614.
4. Fujita N., Hirabuki N., Fujii K., et. al.: MR imaging of middle cerebral artery stenosis and occlusion: value of MR angiography. AJNR Am J Neuroradiol 1994; 15: pp. 335-341. Erratum: AJNR Am J Neuroradiol 1994; 15:A9–A10
5. Willinek W.A., Born M., Simon B., et. al.: Time-of-flight MR angiography: comparison of 3.0-T imaging and 1.5-T imaging—initial experience. Radiology 2003; 229: pp. 913-920.
6. Gibbs G.F., Huston J., Bernstein M.A., et. al.: Improved image quality of intracranial aneurysms: 3T versus 1.5-T time-of-flight MR angiography. AJNR Am J Neuroradiol 2004; 25: pp. 84-87.
7. Al-Kwifi O., Emery D.J., Wilman A.H.: Vessel contrast at three Tesla in time-of-flight magnetic resonance angiography of the intracranial and carotid arteries. Magn Reson Imaging 2002; 20: pp. 181-187.
8. Fushimi Y., Miki Y., Kikuta K., et. al.: Comparison of 3.0- and 1.5-T three-dimensional time-of-flight MR angiography in moyamoya disease: preliminary experience. Radiology 2006; 239: pp. 232-237.
9. Gaa J., Weidauer S., Requardt M., et. al.: Comparison of intracranial 3D-ToF-MRA with and without parallel acquisition techniques at 1.5T and 3.0T: preliminary results. Acta Radiol 2004; 45: pp. 327-332.
10. Wolf R.L., Richardson D.B., LaPlante C.C., et. al.: Blood flow imaging through detection of temporal variations in magnetization. Radiology 1992; 185: pp. 559-567.
11. Sodickson D.K., Manning W.J.: Simultaneous acquisition of spatial harmonics (SMASH): fast imaging with radiofrequency coil arrays. Magn Reson Med 1997; 38: pp. 591-603.
12. Pruessmann K.P., Weiger M., Scheidegger M.B., et. al.: SENSE: sensitivity encoding for fast MRI. Magn Reson Med 1999; 42: pp. 952-962.
13. Griswold M.A., Jakob P.M., Nittka M., et. al.: Partially parallel imaging with localized sensitivities (PILS). Magn Reson Med 2000; 44: pp. 602-609.
14. Weiger M., Pruessmann K.P., Leussler C., et. al.: Specific coil design for SENSE: a six-element cardiac array. Magn Reson Med 2001; 45: pp. 495-504.
15. Weiger M., Pruessmann K.P., Kassner A., et. al.: Contrast-enhanced 3D MRA using SENSE. J Magn Reson Imaging 2000; 12: pp. 671-677.