
Rationales and Objectives
Conventional mammography is largely limited by superimposed anatomy. Digital breast tomosynthesis (DBT) and computed tomography (CT) alleviate this limitation but with added out-of-plane artifacts or limited chest wall coverage. This article presents a wide-angle breast tomosynthesis (WBT), aimed to provide a practical solution to these limitations, and offers an initial study of its utility in comparison with DBT and CT using a singular evaluation platform.
Materials and Methods
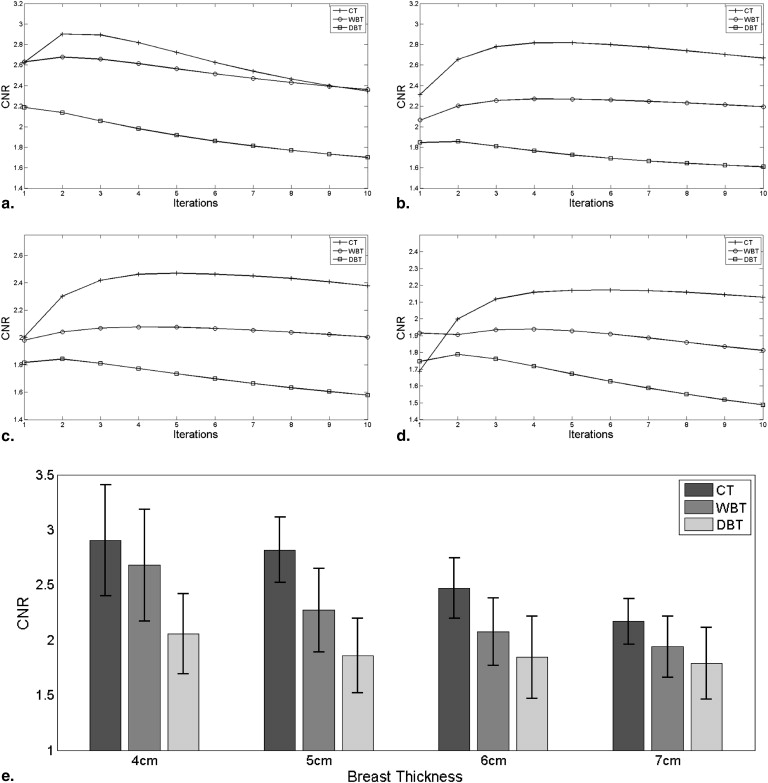
Using an anthropomorphic virtual breast phantom, a Monte Carlo code modeled a breast imaging system for three modalities of DBT, WBT, and breast CT (44°, 99°, and 198° total angle range, respectively) at four breast compression levels, all at a constant mean glandular dose level of 1.5 mGy. Reconstructed volumes were generated using iterative reconstruction methods. Lesion detectability was estimated using contrast-to-noise ratio and a channelized Hotelling observer model in terms of the area under the receiver operating characteristic (AUC).
Results
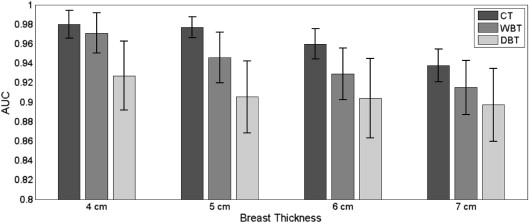
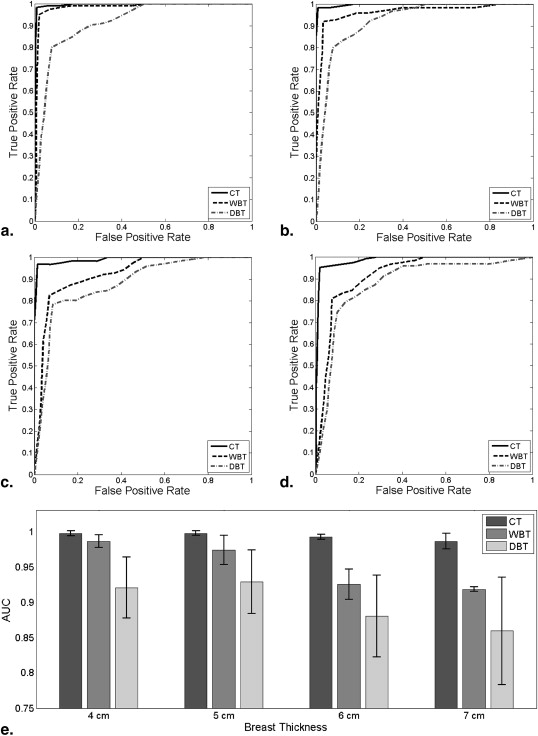
Results showed improved detection with increased angular span and compression. The estimated AUCs for WBT were similar to that of CT. Comparative performance averaged over all thicknesses between CT and WBT was 4.3 ± 3.0%, whereas that between WBT and DBT was 5.6 ± 1.0%. At compression levels reflective of the modality (7-, 5-, and 4-cm thickness for CT, WBT, and DBT, respectively), WBT yielded an AUC comparable to CT (performance difference of 1.2%) but superior to DBT (performance difference of 5.5%).
Conclusions
The proposed imaging modality showed significant advantages over conventional DBT. WBT exhibited superior imaging performance over DBT at lower compression levels, highlighting further potential for reduced breast compression.
Breast cancer is the leading cause of cancer death in women. It is a global problem and affects countries of all economic levels . Earlier detection and treatment could decrease mortality rate by as much as one-third. At present, the main screening program used to identify early breast cancer is mammography . Standard two-dimensional mammograms have been effective in reducing breast cancer mortality , but drawbacks of overlapping structure and limited three-dimensional (3D) information from only cranio-caudal and mediolateral oblique views cause a number of malignant cases to be missed. Clinical studies have shown digital breast tomosynthesis (DBT) to provide significant advantages over mammography by offering better visual information and increased depth perception . However, the limited acquisition angle range (∼50°) makes the 3D data subject to out-of-plane artifacts . Breast computed tomography (CT) can provide better depth discrimination, leading to improved tumor detection while eliminating the need for breast compression . However, in its current implementation, because of patient positioning in the prone position and geometrical clearance needed for 360° image acquisition, breast CT may suffer from reduced chest wall coverage, especially when imaging women with smaller breasts .
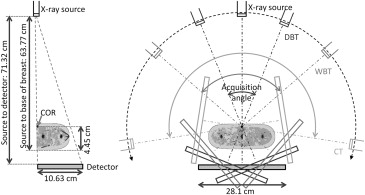
In this article, we propose a wide-angle breast tomosynthesis (WBT) technique: the technique can alliteratively be recognized as limited angle CT. Compared to conventional breast tomosynthesis systems, WBT increases the acquisition angle range from typical 10°–50° to approximately 100° or more, aiming to reduce out-of-plane artifacts compared to DBT. The projection images are acquired within the maximum angular range possible without obstruction by the patient head and the contralateral breast, anatomic limitations that would reduce the chest wall coverage if the x-ray tube and the detector were to be rotating all around the breast. Figure 1 a provides a schematic concept depiction of the hardware. Figure 1 b illustrates a superoinferior–oblique geometrical orientation. The acquisition may also be done in the mediolateral–oblique orientation. The exact geometrical set up of the acquisition and the angular range depend on the specific orientation of the breast, the head, the contralateral breast, and how the patient can be positioned by the technologist considering the enhanced angular range. These issues, although important in the final design of the method, are not the primary objective of this study. Rather, this study aims to investigate the quantitative impact of enhanced angular range on image quality using a consistent simulation platform.
 Open full size image
Figure 1
Schematic, illustrating front and side view of the prototype wide-angle breast tomosynthesis (a) and one implementation rendition (b) . The breast is modestly compressed. The x-ray source rotates along an arc of ∼100° angular range consecutively with the detector in either superoinferior–oblique or mediolateral–oblique orientation. This proposed geometry should obtain coverage of the breast and the muscle along the chest wall with minimal discomfort to the patient.
Get Radiology Tree app to read full this article<
Get Radiology Tree app to read full this article<
Methods
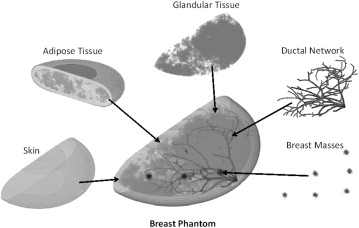
Breast Phantom
Get Radiology Tree app to read full this article<
Get Radiology Tree app to read full this article<
Get Radiology Tree app to read full this article<
Get Radiology Tree app to read full this article<
Get Radiology Tree app to read full this article<
MC Simulation
Get Radiology Tree app to read full this article<
Get Radiology Tree app to read full this article<
Get Radiology Tree app to read full this article<
Get Radiology Tree app to read full this article<
Get Radiology Tree app to read full this article<
Absorbed dose=deposited energydensity×volume Absorbed dose
=
deposited energy
density
×
volume
Get Radiology Tree app to read full this article<
Get Radiology Tree app to read full this article<
Reconstruction and Processing
Iterative Reconstruction
Get Radiology Tree app to read full this article<
Get Radiology Tree app to read full this article<
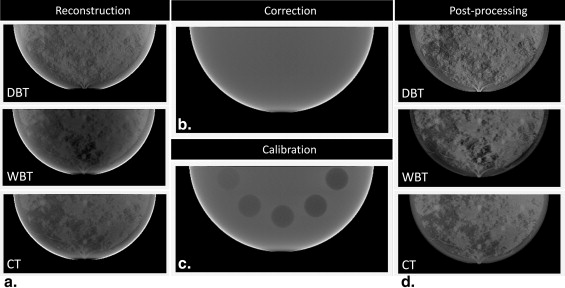
Nonuniformity Correction
Get Radiology Tree app to read full this article<
O(x,y,z)=I(x,y,z)×⟨U(x,y,z)⟩U(x,y,z), O
(
x
,
y
,
z
)
=
I
(
x
,
y
,
z
)
×
〈
U
(
x
,
y
,
z
)
〉
U
(
x
,
y
,
z
)
,
where, I ( x , y , z ) is the uncorrected breast volume, O ( x , y , z ) is the nonuniformity corrected breast volume, U ( x , y , z ) is the correction volume, and ⟨.⟩ 〈
.
〉 denotes the mean operator. U ( x , y , z ) was generated from a uniform phantom, of the same size as the breast phantom and material density of 60% glandular–40% adipose tissues resulting in a reconstructed volume with a scatter profile very similar to the original volume. The original volume was further multiplied by the mean of the correction volume to maintain the average pixel value in the corrected volume.
Get Radiology Tree app to read full this article<
Calibration
Get Radiology Tree app to read full this article<
Q(x,y,z)=Y2−Y1Og(x,y,z,)−Oa(x,y,z,)×[O(x,y,z)−Oa(x,y,z,)]+Y1, Q
(
x
,
y
,
z
)
=
Y
2
−
Y
1
O
g
(
x
,
y
,
z
,
)
−
O
a
(
x
,
y
,
z
,
)
×
[
O
(
x
,
y
,
z
)
−
O
a
(
x
,
y
,
z
,
)
]
+
Y
1
,
where O__g ( x , y , z ) and O__a ( x , y , z ) denote the mean glandular and adipose values from the calibration phantom, Y__1 and Y__2 denote the adipose and glandular percentage, and O ( x , y , z ) and Q ( x , y , z ) denote the uncalibrated and calibrated breast volumes, respectively.
Get Radiology Tree app to read full this article<
Performance Evaluation
Get Radiology Tree app to read full this article<
Contrast-to-Noise Ratio
Get Radiology Tree app to read full this article<
CNR=(⟨Qlesion⟩−⟨Qbackground⟩)σbackground, C
N
R
=
(
〈
Q
lesion
〉
−
〈
Q
background
〉
)
σ
background
,
where μ Lesion and μ Background denote the mean values of the lesion and the background, respectively, and σ Background denotes the standard deviation of the region surrounding the lesion. The mean lesion value was calculated from the average pixel value of a circular region of diameter 3 mm lying within the lesion (∼5 mm in diameter). The background was defined as the region lying between two concentric circles: the inner circle had an 8-mm diameter, which excluded any part of the lesion, and the outer circle with a 17-mm diameter, ensured that the mean background value would average any large anatomic variations surrounding the lesion.
Get Radiology Tree app to read full this article<
Hotelling Observer Model
Get Radiology Tree app to read full this article<
Get Radiology Tree app to read full this article<
Get Radiology Tree app to read full this article<
w(r,θ)=∑n∑mαnmexp(−πr2/a2)Ln(2πr2/a2)eimθ, w
(
r
,
θ
)
=
∑
n
∑
m
α
n
m
exp
(
−
π
r
2
/
a
2
)
L
n
(
2
π
r
2
/
a
2
)
e
i
m
θ
,
where the Laguerre polynomial is given as
Ln(x)=∑nm=0(−1)m(nm)xmm! L
n
(
x
)
=
∑
m
=
0
n
(
−
1
)
m
(
n
m
)
x
m
m
!
Get Radiology Tree app to read full this article<
Get Radiology Tree app to read full this article<
L0(x)=1,L1(x)=−x+1,L2(x)=12!(x2−4x+2). L
0
(
x
)
=
1
,
L
1
(
x
)
=
−
x
+
1
,
L
2
(
x
)
=
1
2
!
(
x
2
−
4
x
+
2
)
.
Get Radiology Tree app to read full this article<
Get Radiology Tree app to read full this article<
Get Radiology Tree app to read full this article<
K=⟨[g−⟨g⟩]T[g−⟨g⟩]⟩, K
=
〈
[
g
−
〈
g
〉
]
T
[
g
−
〈
g
〉
]
〉
,
where ⟨g⟩ 〈
g
〉 is the expectation value of the image matrix g and T denotes the transpose operator. The template derived from the channelized Hotelling observer models can be written as
w=K−1v[⟨gv/s⟩−⟨gv/n⟩], w
=
K
v
−
1
[
〈
g
v
/
s
〉
−
〈
g
v
/
n
〉
]
,
Get Radiology Tree app to read full this article<
Get Radiology Tree app to read full this article<
Get Radiology Tree app to read full this article<
Detectability Index
Get Radiology Tree app to read full this article<
λi=wtgi, λ
i
=
w
t
g
i
,
where g__i denotes the signal or signal absent at the i th location and w is the template at the corresponding lesion location. Signal-present and signal-absent responses were computed for the six lesions for each patient (3), modality (3), and breast thickness (4).
Get Radiology Tree app to read full this article<
Get Radiology Tree app to read full this article<
d′=2×(erf−1(2×AUC−1)), d
’
=
2
×
(
erf
−
1
(
2
×
AUC
−
1
)
)
,
where erf denotes the error function. AUC can be estimated from the reverse of this equation .
Get Radiology Tree app to read full this article<
Results
Projections and Reconstruction
Get Radiology Tree app to read full this article<
Get Radiology Tree app to read full this article<
Get Radiology Tree app to read full this article<
Get Radiology Tree app to read full this article<
Get Radiology Tree app to read full this article<
Get Radiology Tree app to read full this article<
Get Radiology Tree app to read full this article<
Get Radiology Tree app to read full this article<
Performance Evaluation
Get Radiology Tree app to read full this article<
Get Radiology Tree app to read full this article<
Get Radiology Tree app to read full this article<
Get Radiology Tree app to read full this article<
Get Radiology Tree app to read full this article<
Get Radiology Tree app to read full this article<
Get Radiology Tree app to read full this article<
Get Radiology Tree app to read full this article<
Discussion
Get Radiology Tree app to read full this article<
Get Radiology Tree app to read full this article<
Get Radiology Tree app to read full this article<
Get Radiology Tree app to read full this article<
Get Radiology Tree app to read full this article<
Get Radiology Tree app to read full this article<
Conclusions
Get Radiology Tree app to read full this article<
References
1. Boyle PLevin BWorld Caner Report 2008.2008.World Health Organization PressLyon, France:
2. Elmore J.G., Armstrong K., Lehman C.D., et. al.: Screening for breast cancer. JAMA 2005; 293: pp. 1245-1256.
3. Niklason L.T., Christian B.T., Niklason L.E., et. al.: Digital tomosynthesis in breast imaging. Radiology 1997; 205: pp. 399-406.
4. Suryanarayanan S., Karellas A., Vedantham S., et. al.: Comparison of tomosynthesis methods used with digital mammography. Academic Radiology 2000; 7: pp. 1085-1097.
5. Dobbins J.T., Godfrey D.J.: Digital x-ray tomosynthesis: current state of the art and clinical potential. Physics in Medicine and Biology 2003; 48: pp. R65-R106.
6. Hu Y.H., Zhao W., Mertelmeier T., et. al.: “Image artifact in digital breast tomosynthesis and its dependence of system and reconstruction parameters”, IWDM 2008. LNCS 2008; 5116: pp. 628-634.
7. Lindfors K.K., Boone J.M., Nelson T.R., et. al.: Dedicated breast CT: initial clinical experience. Radiology 2008; 246: pp. 725-733.
8. Chen B., Shorey J., Nolte L., et. al.: An anthropomorphic breast model for breast imaging simulation and optimization. Academic Radiology 2011; 18: pp. 536-546.
9. Saunders R.S., Samei E., Lo J.Y., et. al.: Can compression be reduced for breast tomosynthesis? Monte Carlo study on mass and micro-calcification conspicuity in tomosynthesis. Radiology 2009; 251: pp. 673-682.
10. Chawla A.S., Lo J.Y., Baker J.A., et. al.: Optimized image acquisition for breast tomosynthesis in projection and reconstruction space. Med. Phys 2009; 36: pp. 4859-4869.
11. Zbijewski W., Beekman F.J.: Comparison of methods for suppressing edge and aliasing artifacts in iterative x-ray CT reconstruction. Phys. Med. Biol 2006; 51: pp. 1877-1889.
12. Lasio G.M., Whiting B.R., Williamson J.F.: Statistical reconstruction for x-ray computed tomography using energy-integrating detectors. Phys. Med. Biol 2007; 52: pp. 2247-2266.
13. Lange K., Fessler J.A.: Globally convergent algorithms for maximum a posteriori transmission tomography. IEEE Trans. Image Processing 1995; 4: pp. 1430-1438.
14. Erdogan H., Fessler J.A.: Ordered subsets algorithms for transmission tomography. Phys. Med. Biol 1999; 44: pp. 2835-2851.
15. Burgess A.E., Jacobson F.L., Judy P.F.: Human observer detection experiments with mammograms and power-law noise. Med. Phys 2001; 28: pp. 419-437.
16. Eckstein M.P., Abbey C.K., Whiting J.S.: Human vs. model observers in anatomic backgrounds. Proc. SPIE 1998; 3340: pp. 16-26.
17. Barrett H.H., Abbey C.K., Gallas B., et. al.: Stabilized estimates of Hotelling-observer detections performance in patient-structured noise. Proc. SPIE 1998; 3340: pp. 27-43.
18. Eckstein M., Abbey C.K., Bochud F.O.: A practical guide to model observers for visual detection in synthetic and natural noisy images SPIE.Handbook of Medical Imaging.2010.Cambridge University PressCambridge, UK:pp. 593-628.
19. Chawla A.S., Samei E., Saunders R., et. al.: Effect of dose reduction on the detection of mammographic lesions: a mathematical observer model analysis. Med. Phys 2007; 34: pp. 3385-3398.
20. ICRU Report 54: Medical imaging—the assessment of image quality.1996.International Commission on Radiation Units and MeasurementsBethesda, MD
21. Barrett H.H., Myers K.J.: Foundations of image science.Saleh B.E.2004.Wiley Interscience
22. Chawla A.S., Samei E., Lo J.Y., et. al.: A mathematical model platform for optimizing a multi-projection breast imaging system. Med. Phys 2008; 35: pp. 1337-1345.
23. Samei E., Saunders R.S., Baker J.A., et. al.: Digital mammography: impact of reduced dose on diagnostic performance. Radiology 2007; 243: pp. 396-404.