
Rationale and Objectives
In recent years, micro-computed tomography (micro-CT) has emerged as a high-resolution modality for vascular exploration in vivo . Several x-ray contrast agents for in vivo imaging are on the market and are based on different formulations. The objective of this study was to compare contrast-related and pharmacokinetic properties of a water-soluble compound containing iomeprol (Iomeron 400) and blood-pool agents (eXIA160XL, AuroVist 15 nm, and ExiTron nano 12000) for the identification of suitable in vivo vascular imaging applications.
Materials and Methods
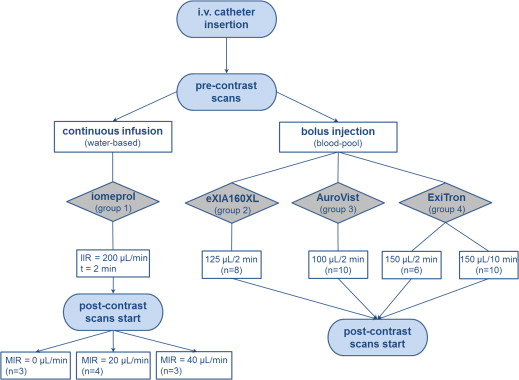
Forty-four healthy C57BL/6J mice were used in this study. Iomeprol was administered with a continuous infusion protocol; the other agents as a bolus. Anatomical micro-CT was applied at the head, neck, and lower hind limb before (baseline) and immediately after contrast injection, and used to quantify contrast-related properties of the agents. Dynamic micro-CT was applied at the same regions to characterize the agents pharmacokinetics.
Results
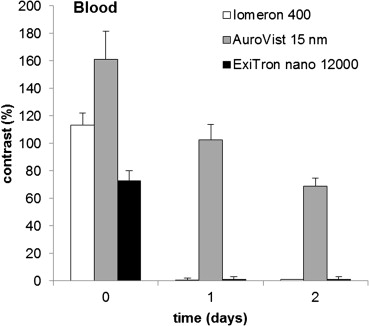
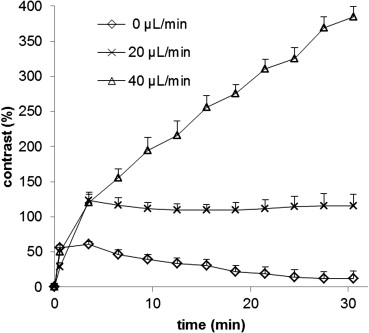
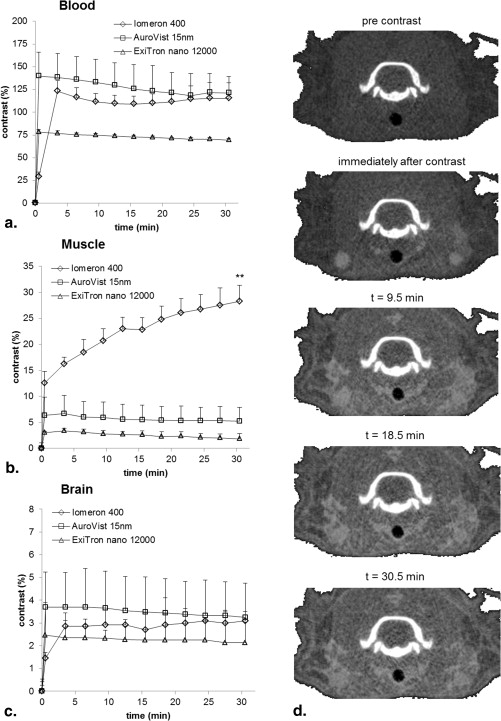
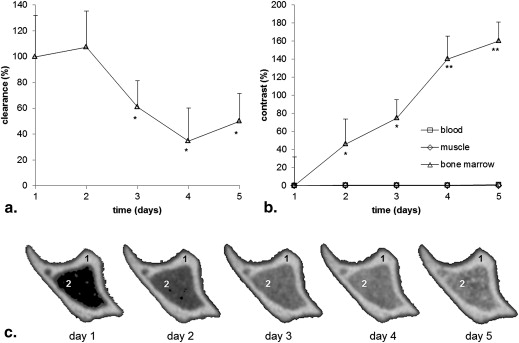
All contrast media revealed safe, except for eXIA160XL, which caused death in four of eight tested animals and was therefore excluded early from the study. AuroVist 15 nm provided the highest attenuation (2.33/mm) as compared to iomeprol (1.97/mm) and ExiTron nano 12000 (1.58/mm) and a maximum temporal variation of contrast of 20% after 30 minutes, but the appearance of a dark skin staining did not allow multiple injections of the agent. Iomeprol passively diffused across capillary membranes, and after 30 minutes doubled the tissue contrast with respect to its initial levels. ExiTron nano 12000 revealed temporal variations of contrast below 10% and significantly reduced clearance rates after the third consecutive injection.
Conclusion
AuroVist 15 nm is best suited for anatomical investigation of the vascular network, while the high extravasation levels of iomeprol can be exploited for perfusion analysis. ExiTron nano 12000 is indicated for use in longitudinal monitoring with repeated injections.
In vivo micro-computed tomography (micro-CT) is a unique imaging modality that demonstrates great abilities for noninvasive time-lapsed imaging of small animals, which allows monitoring of biological processes over time. In recent years, the use of micro-CT for in vivo imaging has experienced a substantial growth, thanks to its abilities to provide anatomical information in great detail . The high x-ray attenuation properties of hard tissues make micro-CT an accurate imaging technique to visualize bone and its microstructure , whereas blood vessels cannot be distinguished from surrounding soft tissues because of their similar densities. To overcome this limitation, contrast agents of radiopaque materials have been developed to image the vascular network. In vivo micro-CT, with the use of vascular contrast agents, is commonly employed as an anatomical imaging modality. In anatomical imaging, vessels are segmented from the surrounding tissues through threshold-based image processing procedures. To provide a high level of anatomical detail, high resolutions (currently around 10–20 μm) are typically used for vessel visualization and morphometric evaluation . The recent shortening of scan times has enabled micro-CT use not only for anatomical investigation, but also for dynamic imaging modality. Dynamic imaging consists of time-lapsed monitoring of a region of interest through consecutive short micro-CT scans. In this case, low resolutions (around 60–70 μm) are used to allow short imaging times. The evaluation of dynamic images often relies on the analysis of density, rather than on vessel segmentation. In density analysis, masks of areas of interest are defined and changes in the average x-ray attenuation of these regions are quantified in a time-lapsed fashion. Taking advantage of density analysis, dynamic imaging has been used to monitor time-dependent processes—for instance, to track the pharmacokinetics of vascular tracers and for perfusion analysis . Therefore, micro-CT shows great potential in assessing both anatomical and kinetic properties of contrast agents in high resolution.
Several contrast media for vascular imaging are currently available on the market. Depending on their formulation, they can be distinguished between water-soluble agents, typically used in the clinics, and blood-pool agents for preclinical imaging. Water-soluble agents are based on organically bound iodine. Iodine provides the highest x-ray attenuation among nonmetal elements and has been used in clinical radiology for decades because of its low toxicity. These agents are based on the tri-iodinated benzene ring, either in an ionic or nonionic form. An ionic form called diatrizoate was introduced in 1954 and is known under the commercial name of Hypaque (GE Healthcare, Princeton, NJ). However, the high extracellular distribution volumes of this ionic compound were later found to be responsible for adverse reactions and chemotoxicity .
Get Radiology Tree app to read full this article<
Get Radiology Tree app to read full this article<
Materials and methods
Animal Preparation
Get Radiology Tree app to read full this article<
Get Radiology Tree app to read full this article<
Get Radiology Tree app to read full this article<
Get Radiology Tree app to read full this article<
Get Radiology Tree app to read full this article<
Contrast-Related Properties
Get Radiology Tree app to read full this article<
contrast=100∗(μTISSUE-μREF)/μREF contrast
=
100
∗
(
μ
TISSUE
-
μ
REF
)
/
μ
REF
where μ TISSUE is the average linear attenuation coefficient in the tissue (μ BLOOD ) and μ REF is the average linear attenuation coefficient in the background (μ BCK ); signal-to-noise ratio is calculated as 20*log(μ BLOOD /σ BCK ); CNR (contrast-to-noise ratio) is calculated as 20*log(contrast/σ BCK ); contrast resolution refers to the diameter of the smallest detectable vessel.
Get Radiology Tree app to read full this article<
Pharmacokinetic Properties
Get Radiology Tree app to read full this article<
Results
Safety
Get Radiology Tree app to read full this article<
Contrast-Related Properties
Get Radiology Tree app to read full this article<
Table 1
Contrast-Related Parameters for Iomeprol, AuroVist 15 nm, and ExiTron Nano 12000
Contrast Agent μ BLOOD (1/mm) μ BCK (1/mm) σ BCK (1/mm) Contrast (1/mm) SNR Ratio (dB) CNR (dB) Contrast Resolution (μm) Water-based Iomeprol 1.97 1.53 0.24 0.44 18.22 5.27 ∼500 Blood-pool AuroVist 15 nm 2.34 0.97 0.20 1.36 21.28 16.59 ∼60 ExiTron nano 12000 1.58 0.96 0.22 0.61 17.17 8.97 ∼100
μ BCK , average linear attenuation coefficient in the background; μ BLOOD , average linear attenuation coefficient in blood; CNR, contrast-to-noise ratio; SNR, signal-to-noise ratio.
Get Radiology Tree app to read full this article<
Get Radiology Tree app to read full this article<
Get Radiology Tree app to read full this article<
Get Radiology Tree app to read full this article<
Get Radiology Tree app to read full this article<
Pharmacokinetic Properties
Get Radiology Tree app to read full this article<
Get Radiology Tree app to read full this article<
Get Radiology Tree app to read full this article<
Get Radiology Tree app to read full this article<
Get Radiology Tree app to read full this article<
Get Radiology Tree app to read full this article<
Discussion
Get Radiology Tree app to read full this article<
Get Radiology Tree app to read full this article<
Get Radiology Tree app to read full this article<
Get Radiology Tree app to read full this article<
Get Radiology Tree app to read full this article<
Acknowledgments
Get Radiology Tree app to read full this article<
Get Radiology Tree app to read full this article<
References
1. Ritman E.L.: Current status of developments and applications of micro-CT. Annu Rev Biomed Eng 2011; 13: pp. 531-552.
2. Müller R.: Hierarchical microimaging of bone structure and function. Nat Rev Rheumatol 2009; 5: pp. 373-381.
3. Ulrich D., Hildebrand T., Van Rietbergen B., et. al.: The quality of trabecular bone evaluated with micro-computed tomography, FEA and mechanical testing. Stud Health Technol Inform 1997; 40: pp. 97-112.
4. Schambach S.J., Bag S., Schilling L., et. al.: Application of micro-CT in small animal imaging. Methods 2010; 50: pp. 2-13.
5. Lee T.Y.: Functional CT: physiological models. Trends Biotechnol 2002; 20: pp. S3-S10.
6. Ford N.L., Graham K.C., Groom A.C., et. al.: Time-course characterization of the computed tomography contrast enhancement of an iodinated blood-pool contrast agent in mice using a volumetric flat-panel equipped computed tomography scanner. Invest Radiol 2006; 41: pp. 384-390.
7. Bisdas S., Konstantinou G.N., Lee P.S., et. al.: Dynamic contrast-enhanced CT of head and neck tumors: perfusion measurements using a distributed-parameter tracer kinetic model. Initial results and comparison with deconvolution-based analysis. Phys Med Biol 2007; 52: pp. 6181-6196.
8. Gabra P., Shen G., Xuan J., et. al.: Arterio-venous anastomoses in mice affect perfusion measurements with dynamic contrast enhanced CT. Physiol Meas 2010; 31: pp. 249-260.
9. Dawson P.: Chemotoxicity of contrast-media and clinical adverse-effects - a review. Invest Radiol 1985; 20: pp. S84-S91.
10. Bourin M., Jolliet P., Ballereau F.: An overview of the clinical pharmacokinetics of x-ray contrast media. Clin Pharmacokinet 1997; 32: pp. 180-193.
11. Henwood S.M.: Clinical CT - techniques and practice.1999.Oxford University PressOxford
12. Fischer H.W., Plewes D., Violante M.: Contrast media, the blood-brain barrier, and cerebral blood flow. Adv Neurol 1981; 30: pp. 141-148.
13. Badea C.T., Fubara B., Hedlund L.W., et. al.: 4-D micro-CT of the mouse heart. Mol Imaging 2005; 4: pp. 110-116.
14. Hallouard F., Anton N., Choquet P., et. al.: Iodinated blood pool contrast media for preclinical X-ray imaging applications–a review. Biomaterials 2010; 31: pp. 6249-6268.
15. Weichert J.P., Lee F.T., Longino M.A., et. al.: Lipid-based blood-pool CT imaging of the liver. Acad Radiol 1998; 5: pp. S16-S19. discussion S28–S30
16. Vera D.R., Mattrey R.F.: A molecular CT blood pool contrast agent. Acad Radiol 2002; 9: pp. 784-792.
17. Willekens I., Lahoutte T., Buls N., et. al.: Time-course of contrast enhancement in spleen and liver with Exia 160, Fenestra LC, and VC. Mol Imaging Biol 2009; 11: pp. 128-135.
18. Liu Y., Ai K., Lu L.: Nanoparticulate x-ray computed tomography contrast agents: from design validation to in vivo applications. Acc Chem Res 2012; 45: pp. 1817-1827.
19. Yu S.B., Watson A.D.: Metal-based x-ray contrast media. Chem Rev 1999; 99: pp. 2353-2378.
20. Hainfeld J.F., Slatkin D.N., Focella T.M., et. al.: Gold nanoparticles: a new X-ray contrast agent. Br J Radiol 2006; 79: pp. 248-253.
21. Boll H., Bag S., Schambach S.J., et. al.: High-speed single-breath-hold micro-computed tomography of thoracic and abdominal structures in mice using a simplified method for intubation. J Comput Assist Tomogr 2010; 34: pp. 783-790.
22. Thevenaz P., Ruttimann U.E., Unser M.: A pyramid approach to subpixel registration based on intensity. IEEE T Image Process 1998; 7: pp. 27-41.
23. R Development Core Team : R: A Language and Environment for Statistical Computing.2010.R Foundation for Statistical ComputingVienna, Austria
24. Figueiredo G., Brockmann C., Boll H., et. al.: Comparison of digital subtraction angiography, micro-computed tomography angiography and magnetic resonance angiography in the assessment of the cerebrovascular system in live mice. Clin Neuroradiol 2012; 22: pp. 21-28.
25. Badea C.T., Drangova M., Holdsworth D.W., et. al.: In vivo small-animal imaging using micro-CT and digital subtraction angiography. Phys Med Biol 2008; 53: pp. R319-R350.
26. Zagorchev L., Oses P., Zhuang Z.W., et. al.: Micro computed tomography for vascular exploration. J Angiogen Res 2010; 2: pp. 7.
27. Detombe S.A., Dunmore-Buyze J., Drangova M.: Time-course characterization of an aqueous colloidal polydisperse contrast agent in mice using micro-computed tomography. Proc SPIE 2011; pp. 7965.
28. Bisdas S., Hartel M., Cheong L.H., et. al.: Detection of early vessel leakiness in acute ischemic stroke using computed tomography perfusion may indicate hemorrhagic transformation. Acta Radiol 2007; 48: pp. 341-344.
29. Bisdas S., Baghi M., Wagenblast J., et. al.: Differentiation of benign and malignant parotid tumors using deconvolution-based perfusion CT imaging: feasibility of the method and initial results. Eur J Radiol 2007; 64: pp. 258-265.
30. Nett B.E., Brauweiler R., Kalender W., et. al.: Perfusion measurements by micro-CT using prior image constrained compressed sensing (PICCS): initial phantom results. Phys Med Biol 2010; 55: pp. 2333-2350.
31. Ladurner G., Zilkha E., Iliff D., et. al.: Measurement of regional cerebral blood volume by computerized axial tomography. J Neurol Neurosurg Psychiatry 1976; 39: pp. 152-155.
32. Johnson J.A., Wilson T.A.: A model for capillary exchange. Am J Physiol 1966; 210: pp. 1299-1303.