
Rationale and Objectives
Q-space analysis using high b-value diffusion-weighted magnetic resonance (MR) data provides information on tissue microstructure in contrast to conventional MR imaging (MRI) based on low b-value diffusion-weighted imaging (DWI). The purpose of this study was to evaluate the use of mean displacement (MDP) map in stroke patients using q-space diffusion-weighted MRI (QSI).
Materials and Methods
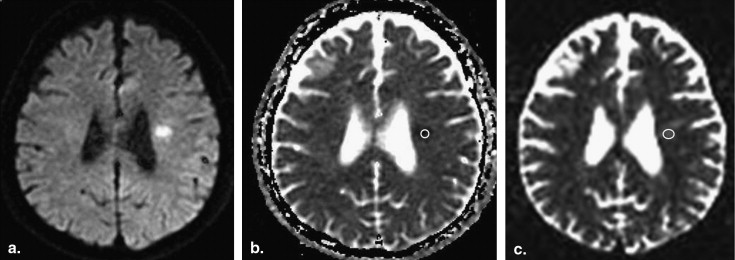
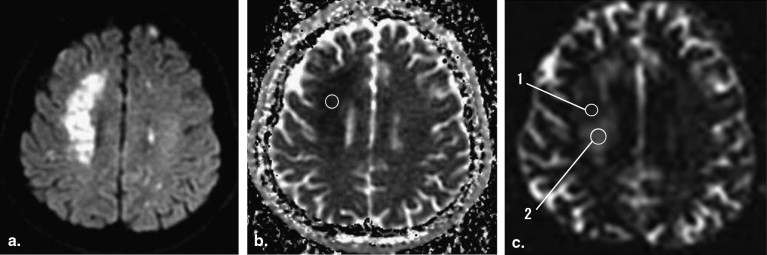
Twenty-one patients presenting with a total of 22 acute or subacute cerebral infarctions were included. MR protocol consisted of conventional MR sequences, DWI (b-value; 1000 s/mm 2 ) and QSI (b-value; maximum 12,000 s/mm 2 ). Apparent diffusion coefficient (ADC) maps of conventional DWI and MDP maps of QSI data were obtained and compared in the ischemic lesions and corresponding normal tissues.
Results
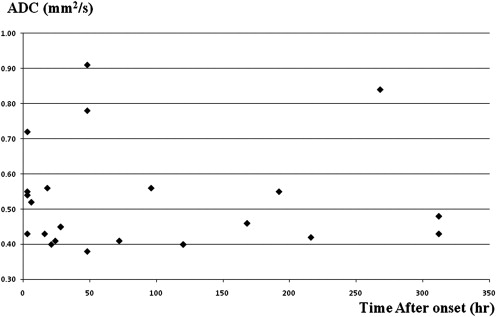
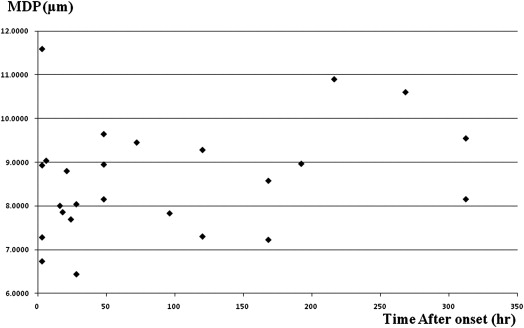
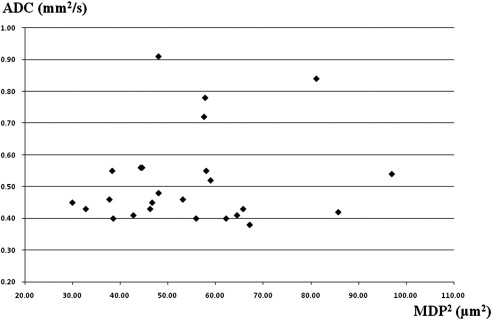
Decreased ADC values were present in all lesions. There was no correlation between ADC and MDP values in the lesions ( r = 0.21). MDP values of the lesions were 8.60 ± 1.26 μm (mean ± SD). Most of the lesions (16/22) had higher MDP values than normal brain tissue. Three lesions showed lower MDP values and three showed mixed MDP values.
Conclusions
The MDP maps using QSI data provides additional information for stroke patients compared to conventional DWI.
Diffusion-weighted imaging (DWI) is widely applied as a noninvasive magnetic resonance (MR) technique for assessing brain development and pathological conditions. Clinically, single-shot echo-planar imaging (EPI) with low b-values (800–1000 s/mm 2 ) is the most common technique because of its short acquisition time (<1 minute) to complete whole brain imaging, relatively high signal-to-noise ratio (SNR), and high sensitivity and specificity for detecting acute stroke lesions . Apparent diffusion coefficient (ADC) is a DWI-derived parameter used to estimate stroke lesions.
However, ADC is not a reliable predictor of brain tissue damage because even severely decreased ADC values may normalize in human stroke . Moreover, brain tissue with initially decreased ADC values may include “tissue at risk” for stroke . For the reasons ADC values derived from conventional DWI of limited use in the evaluation of brain tissue damage in stroke patients.
Get Radiology Tree app to read full this article<
Get Radiology Tree app to read full this article<
Get Radiology Tree app to read full this article<
Materials and methods
Get Radiology Tree app to read full this article<
Table 1
Summary of Stroke Patients Clinical Information
Patient Age (y) Time After Stroke Onset Previous History of Cerebral Infarction Leukoaraiosis 1 61 120 + − 2 63 72 + + 3 80 3 + + 4 64 3 + + 5 57 21 + + 6 48 28 − − 7 76 6 − + 8 80 268 + − 9 58 24 + − 10 57 312 − − 11 53 48 − + 12 93 192 + + 13 52 16 − + 14 72 3 + + 15 67 168 + + 16 37 18 − − 17 78 312 + + 18 63 48 + + 19 63 216 + + 20 69 96 + + 21 74 48 + +
Get Radiology Tree app to read full this article<
Get Radiology Tree app to read full this article<
Get Radiology Tree app to read full this article<
Get Radiology Tree app to read full this article<
Ps(R,tdif)=FT{Etdif(q)} P
s
(
R
,
t
dif
)
=
FT
{
E
tdif
(
q
)
}
Where t dif = Δ –δ/3, the effective diffusion time.
Get Radiology Tree app to read full this article<
Get Radiology Tree app to read full this article<
MDPvalue=0.425×FWHM MDP
value
=
0.425
×
FWHM
Get Radiology Tree app to read full this article<
Get Radiology Tree app to read full this article<
Results
Get Radiology Tree app to read full this article<
Get Radiology Tree app to read full this article<
Get Radiology Tree app to read full this article<
Get Radiology Tree app to read full this article<
Get Radiology Tree app to read full this article<
Get Radiology Tree app to read full this article<
Get Radiology Tree app to read full this article<
Table 2
Mean Values for ADCs and MDP
Ischemic Lesion Contralateral Region ADC, 10 −3 mm 2 /s 0.53 ± 0.15 0.84 ± 0.14 MDP, μm 7.31 ± 1.07 5.15 ± 2.78
ADC, apparent diffusion coefficient; MDP, mean displacement.
Get Radiology Tree app to read full this article<
Discussion
Get Radiology Tree app to read full this article<
Get Radiology Tree app to read full this article<
Get Radiology Tree app to read full this article<
Get Radiology Tree app to read full this article<
Get Radiology Tree app to read full this article<
Get Radiology Tree app to read full this article<
Conclusion
Get Radiology Tree app to read full this article<
References
1. Warach S., Gaa J., Siewert B., et. al.: Acute human stroke studied by whole brain echo planar diffusion-weighted magnetic resonance imaging. Ann Neurol 1995; 37: pp. 231-241.
2. Fiehler J., Foth M., Kucinski T., et. al.: Severe ADC decreases do not predict irreversible tissue damage in humans. Stroke 2002; 33: pp. 79-86.
3. Fiehler J., Knudsen K., Kucinski T., et. al.: Predictors of apparent diffusion coefficient normalization in stroke patients. Stroke 2004; 35: pp. 514-519.
4. Assaf Y., Cohen Y.: Structural information in neuronal tissue as revealed by q-space diffusion NMR spectroscopy of metabolites in bovine optic nerve. NMR Biomed 1999; 12: pp. 335-344.
5. Assaf Y., Mayk A., Cohen Y.: Displacement imaging of spinal cord using q-space diffusion-weighted MRI. Magn Reson Med 2000; 44: pp. 713-722.
6. Assaf Y., Ben-Bashat D., Chapman J., et. al.: High b-value q-space analyzed diffusion-weighted MRI: application to multiple sclerosis. Magn Reson Med 2002; 47: pp. 115-126.
7. Assaf Y., Mayzel-Oreg O., Gigi A., et. al.: High b value q-space-analyzed diffusion MRI in vascular dementia: a preliminary study. J Neurol Sci 2002; 15: pp. 235-239.
8. Cohen Y., Assaf Y.: High b-value q-space analyzed diffusion-weighted MRS and MRI in neuronal tissues—a technical review. NMR Biomed 2002; 15: pp. 516-542.
9. Assaf Y., Mayk A., Eliash S., et. al.: Hypertension and neuronal degeneration in excised rat spinal cord studied by high-b value q-space diffusion magnetic resonance imaging. Exp Neurol 2003; 184: pp. 726-736.
10. Ben Bashat D., Ben Sira L., Graif M., et. al.: Normal white matter development from infancy to adulthood: comparing diffusion tensor and high b value diffusion weighted MR images. J Magn Reson Imaging 2005; 21: pp. 503-511.
11. Biton I.E., Mayk A., Kidron D., et. al.: Improved detectability of experimental allergic encephalomyelitis in excised swine spinal cords by high b-value q-space DWI. Exp Neurol 2005; 195: pp. 437-446.
12. Assaf Y., Chapman J., Ben-Bashat D., et. al.: White matter changes in multiple sclerosis: correlation of q-space diffusion MRI and 1H MRS. Magn Reson Imaging 2005; 23: pp. 703-710.
13. Mayzel-Oreg O., Assaf Y., Gigi A., et. al.: High b-value diffusion imaging of dementia: application to vascular dementia and Alzheimer disease. J Neurol Sci 2007; 15: pp. 105-113.
14. Farrell J.A., Smith S.A., Gordon-Lipkin E.M., et. al.: High b-value q-space diffusion-weighted MRI of the human cervical spinal cord in vivo: feasibility and application to multiple sclerosis. Magn Reson Med 2008; 59: pp. 1079-1089.
15. Fatima Z., Motosugi U., Hori M., et. al.: q-space imaging (QSI) of the brain: comparison of displacement parameters by QSI and DWI. Magn Reson Med Sci 2010; 9: pp. 109-110.
16. Hikishima K., Yagi K., Numano T., et. al.: Volumetric q-space imaging by 3D diffusion-weighted MRI. Magn Reson Imaging 2008; 26: pp. 437-445.
17. Lätt J., Nilsson M., van Westen D., et. al.: Diffusion-weighted MRI measurements on stroke patients reveal water-exchange mechanisms in sub-acute ischaemic lesions. NMR Biomed 2009; 22: pp. 619-628.
18. Sakai K., Yamada K., Oouchi H., et. al.: Numerical simulation model of hyperacute/acute stage white matter infarction. Magn Reson Med Sci 2008; 7: pp. 187-194.