
Rationale and Objectives
This study aimed to evaluate the diagnostic accuracy of magnetic resonance imaging (MRI) and computed tomography (CT) in assessing small bowel (SB) Crohn disease (CD).
Materials and Methods
We systematically searched PubMed, Elsevier, ScienceDirect, Karger, Web of Science, Wiley Online Library, and Springer for studies in which CT or MRI were evaluated to assess SB CD. Bivariate random effect meta-analytic methods were used to estimate pooled sensitivity, specificity, and receiver operating characteristic curves. Diagnostic odds ratios (DORs) in a per-patient–based analysis were estimated. The area under the receiver operating characteristic curve was also calculated to measure the diagnostic accuracy.
Results
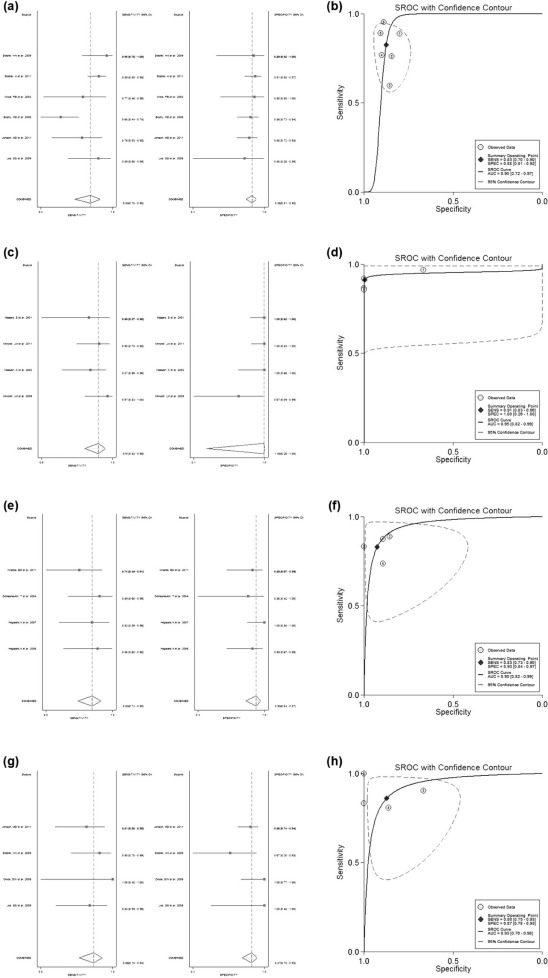
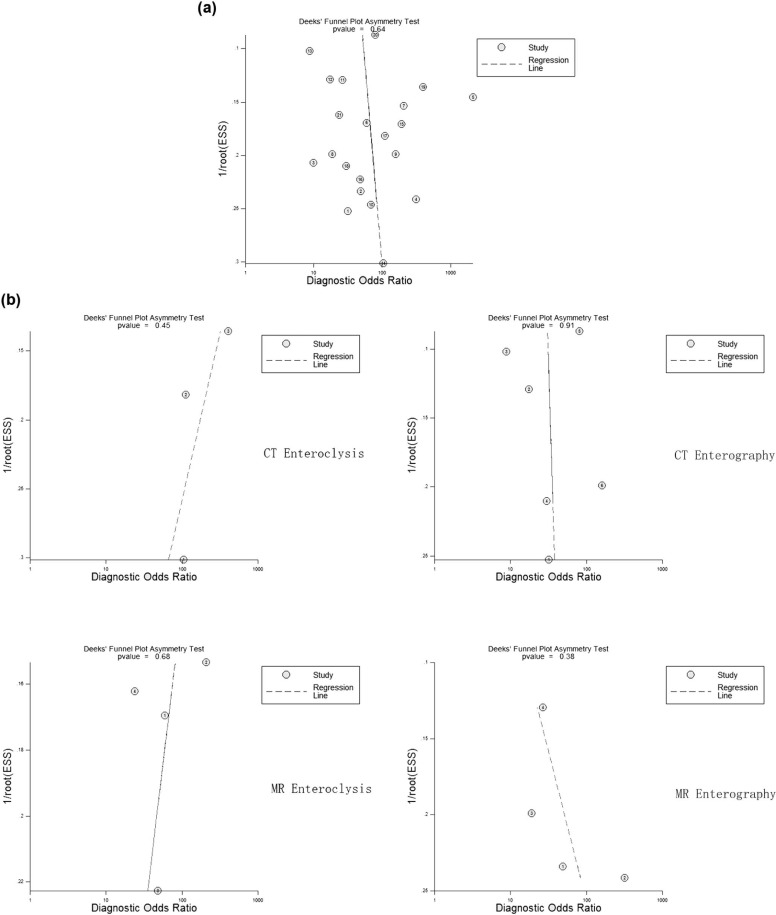
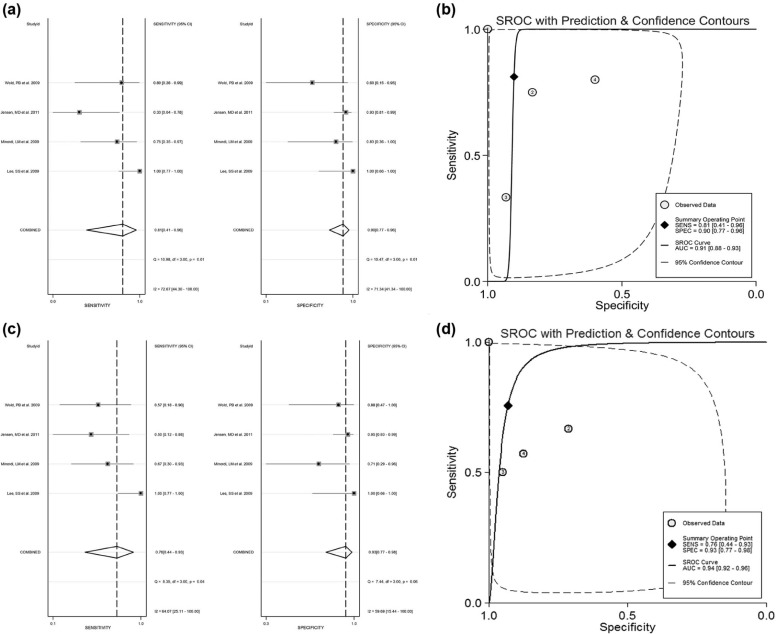
Twenty-one studies involving 913 patients were included in this meta-analysis. There was no significant difference observed between modalities. The diagnostic performances (lnDOR) for CT and MRI also showed no significant difference. Subgroup analysis was performed for MR imaging (MR enteroclysis, MR enterography, and CT enterography). The diagnostic performances (lnDOR) for MR enteroclysis, MR enterography, and CT enterography did not show a significant difference among them. No significant difference was found between these techniques. Deeks funnel plot asymmetry test for publication bias showed that no significant publication bias was observed in this analysis.
Conclusions
This meta-analysis suggests that both MRI and CT have high diagnostic accuracy in detecting SB CD. MRI has the potential to be the first-line radiation-free modality for SB CD imaging.
Introduction
Crohn disease (CD) is a chronic inflammatory bowel disease of great diagnostic challenges, with an incidence of approximately 100–200 per 100,000 in North America and Europe, and a total of 400,000–600,000 patients in North America . The small bowel (SB) is the most commonly affected site, and it is the only affected site in around 30% of cases . Many new imaging tools are available in clinical practices for the evaluation of SB disorders. Among those, magnetic resonance imaging (MRI) and computed tomographic (CT) techniques are playing an important role for SB imaging. The previously established SB barium enteroclysis and barium follow-through are gradually being shifted toward MR enteroclysis and enterography, and CT enteroclysis and enterography.
One of the major differences between MRI and CT is in radiation dose for detection. MR enterography and MR enteroclysis require no or only a trivial dose, whereas CT enteroclysis and CT enterography require a large radiation dose around 10–15 mSv , although studies showed a lower dose (under 9 mSv) used in patients with CD . Some research estimated that the lifetime risk for an adult patient to acquire a fatal cancer from radiation is 1 in 20,000 per mSv , whereas a study showed that in 15% of patients with CD, the cumulative effective radiation dose was more than 75 mSv, which could increase the cancer mortality by as much as 7.3% . Some studies have compared CT and MRI in patients with CD, but the results were variable and controversial. This meta-analysis from published data aims to provide an up-to-date overview of the diagnostic accuracy of these imaging modalities for SB CD.
Materials and Methods
Search Strategy
Get Radiology Tree app to read full this article<
Get Radiology Tree app to read full this article<
Data Extraction and Methodological Assessment
Get Radiology Tree app to read full this article<
Get Radiology Tree app to read full this article<
Get Radiology Tree app to read full this article<
Statistical Methods
Get Radiology Tree app to read full this article<
Get Radiology Tree app to read full this article<
Publication Bias
Get Radiology Tree app to read full this article<
Results
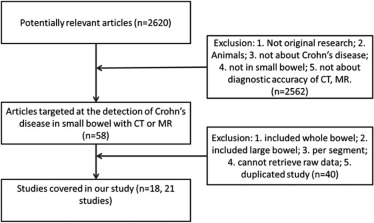
Literature Search
Get Radiology Tree app to read full this article<
TABLE 1
Patient and Design Characteristics of the 21 Studies Included
Study Technique Design Age (y) (Average) No. of Patients Gender (Female Proportion) Patient Spectrum ( n ) Time Interval Between Reference Test and Index Test Lee et al. 2009 CT enterography Prospective 8–44 (29) 23 43% Endoscopic grade of CD was grade 0 in 5 patients, grade 1 in 2 patients, grade 3 in 4 patients, grade 4 in 9 patients, and grade 5 in 3 patients NA Lee et al. 2009 MR Enterography Prospective 8–44 (29) 23 43% Endoscopic grade of CD was grade 0 in 5 patients, grade 1 in 2 patients, grade 3 in 4 patients, grade 4 in 9 patients, and grade 5 in 3 patients NA Albert et al. 2005 MRI Prospective 18–72 (36.6) 24 75% 14 CD, 1 irritable bowel syndrome, 2 infectious colitis, 2 normal, 1 indeterminate colitis, 1 ulcerative colitis, 1 intolerance to lactulose, 1 symptoms due to adhesions NA Crook et al. 2009 MR Enterography Prospective 25–83 (56) 19 58% 5 CD, 4 non-Hodgkin lymphoma, 1 jejunal adenocarcinoma, 6 postradiotherapy enteritis, 1 jejunal lymphangioma, jejunal angiodysplasia, 1 NSAID-induced enteropathy, 1 small bowel obstruction due to adhesions NA Laghi et al. 2003 MRI Prospective 8–17 (13.6) 46 NA 18 active ulcerative colitis, 11 spondyloarthropathy and indeterminate ileocolitis 0 d Negaard et al. 2006 MR Enteroclysis Prospective 18–73 (39) 35 88% Suspected CD ≤3 mo Negaard et al. 2007 MR Enteroclysis Prospective 16–65 (33) 41 45% 40 suspected CD ≤3 mo Siddiki et al. 2009 MR Enterography Prospective 20–60 (40) 30 45% 22 active disease, 2 inactive disease NA Siddiki et al. 2009 CT Enterography Prospective 20–60 (40) 30 45% 22 active disease, 2 inactive disease NA Pilleul et al. 2005 MRI Prospective 8–18 (12.6) 15 88% Suspected CD 24.9 d Jensen et al. 2011 MR Enterography Prospective 15–74 (30) 72 70% Clinically suspected CD median 13 d Jensen et al. 2011 CT Enterography Prospective 15–74 (30) 73 70% Clinically suspected CD median 13 d Bodily et al. 2006 CT Enterography Retrospective male 24–72 (46), female 17–72 (43) 96 68% 16 bowel wall thickness ≤30 d Minordi et al. 2009 CT Prospective 25–75 (43) 34 41% 7 mucosal hyperdensity without wall thickening, 3 mucosal hyperdensity with wall thickening NA Mazzeo et al. 2001 Spiral CT Prospective 18–71 33 55% Certain or suspected CD of the small bowel NA Ochsenkuhn et al. 2004 MR Enteroclysis Prospective 19–57 (34) 25 48% CD known SBE on same day, 10 wk (range, 3–13 wk) for CS and HA Hassan et al. 2003 CT Enteroclysis Prospective 21–73 (44) 39 50% CD known or suspected NA Wold et al. 2003 CT Enterography Prospective 22–55 23 52% CD known or suspected Mean, 5.3 d (range, 0–34 d) Minordi et al. 2011 CT Enteroclysis Prospective 18–85 (48) 57 55% Small bowel, bleeding pertinent to small bowel, or suspected or positive CD Mean, 25 d Siddiki et al. 2011 CT Enterography Prospective NA 137 NA Known or suspected CD ≤30 d Wiarda et al. 2012 MR Enteroclysis Prospective 20–74 (36) 38 62% Known or suspected CD Median, 22 d (range, 4–112 d)
CD, Crohn disease; CS, colonoscopy; CT, computed tomography; HA, histopathologic analysis; MR, magnetic resonance; MRI, magnetic resonance imaging; NA, not available; NSAID, non-steroidal anti-inflammatory drug; SBE, small bowel barium enteroclysis; SBFT, small bowel follow-through.
Get Radiology Tree app to read full this article<
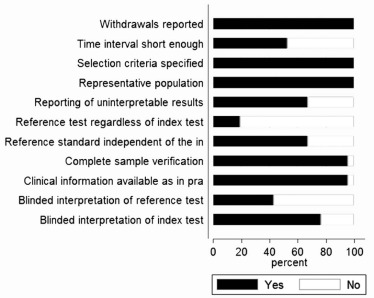
Study Quality Assessment
Get Radiology Tree app to read full this article<
Meta-analysis
Get Radiology Tree app to read full this article<
TABLE 2
Summary of Per-patient Sensitivity and Specificity
Study TP FP FN TN Sensitivity Specificity Lee et al. 2009 16 1 2 4 0.89 (0.65, 0.99) 0.8 (0.28, 0.99) Lee et al. 2009 15 0 3 5 0.83 (0.59, 0.96) 1 (0.48, 1) Albert et al. 2005 10 2 4 8 0.71 (0.42, 0.92) 0.8 (0.44, 0.97) Crook et al. 2009 5 0 0 14 1 (0.48, 1) 1 (0.77, 1) Laghi et al. 2003 26 0 0 20 1 (0.87, 1) 1 (0.83, 1) Negaard et al. 2006 14 2 2 17 0.88 (0.62, 0.98) 0.89 (0.67, 0.99) Negaard et al. 2007 15 0 3 23 0.83 (0.59, 0.96) 1 (0.85, 1) Siddiki et al. 2009 19 3 2 6 0.9 (0.7, 0.99) 0.67 (0.3, 0.93) Siddiki et al. 2009 20 1 1 8 0.95 (0.76, 1) 0.89 (0.52, 1) Pilleul et al. 2005 5 0 1 9 0.83 (0.36, 1) 1 (0.66, 1) Jensen et al. 2011 17 7 4 44 0.81 (0.58, 0.95) 0.86 (0.74, 0.94) Jensen et al. 2011 16 8 5 44 0.76 (0.53, 0.92) 0.85 (0.72, 0.93) Bodily et al. 2006 28 7 19 42 0.6 (0.44, 0.74) 0.86 (0.73, 0.94) Minordi et al. 2009 31 0 1 2 0.97 (0.84, 1) 1 (0.16, 1) Mazzeo et al. 2001 12 0 2 19 0.86 (0.57, 0.98) 1 (0.82, 1) Ochsenkuhn et al. 2004 16 1 2 6 0.89 (0.65, 0.99) 0.86 (0.42, 1) Hassan et al. 2003 26 0 4 9 0.87 (0.69, 0.96) 1 (0.66, 1) Wold et al. 2003 10 1 3 9 0.77 (0.46, 0.95) 0.9 (0.55, 1) Minordi et al. 2011 34 0 3 20 0.92 (0.78, 0.98) 1 (0.83, 1) Siddiki et al. 2011 74 5 9 49 0.89 (0.8, 0.95) 0.91 (0.8, 0.97) Wiarda et al. 2012 14 2 5 17 0.74 (0.49, 0.91) 0.89 (0.67, 0.99)
CI, confidence interval; FN, false negative; FP, false positive; TN, true negative; TP, true positive.
Note: Numbers in parentheses are 95% CIs.
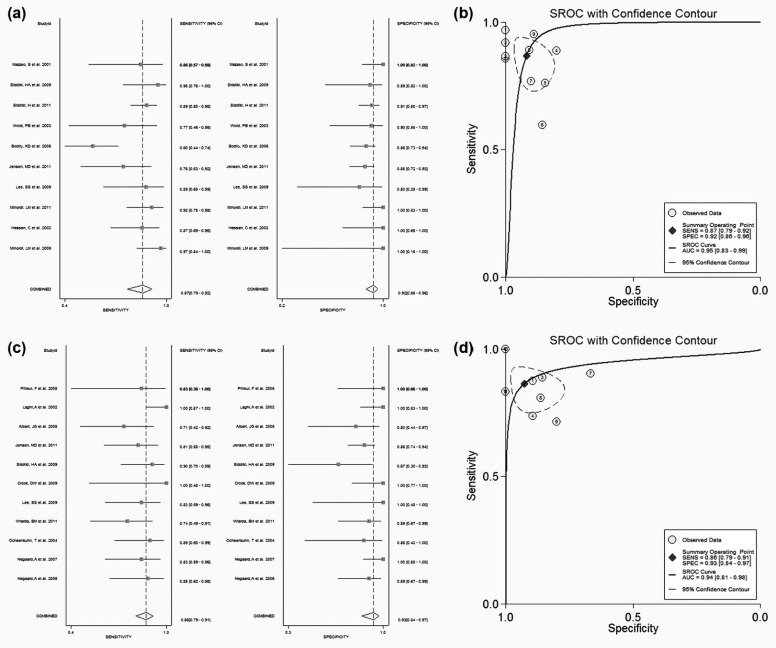
TABLE 3
Summary of Sensitivity and Specificity Comparison
Z (Sensitivity)P Value Z (Specificity)P Value CT vs MRI −0.7718 .4402 0 1 1 vs 2 1.4418 .1493 −6.3906 <.0001 2 vs 3 −1.2305 .2185 2.9998 .0027 3 vs 4 −0.6973 .4856 1.6945 .0902 1 vs 4 −0.8641 .3876 0.3069 .7589 2 vs 4 8.00E+03 <.0001 4.4289 <.0001 1 vs 3 0 1 −1.8321 .0669
1, CT enterography; 2, CT enteroclysis; 3, MR enteroclysis; 4, MR enterography; CT, computed tomography; MR, magnetic resonance; MRI, magnetic resonance imaging.
TABLE 4
Summary of Diagnostic Performances
Z (lnDOR)P Value 1 vs 2 2.281 .0566 2 vs 3 −0.865 .4122 3 vs 4 0.1886 .8566 1 vs 4 1.3904 .2231 2 vs 4 −0.5597 .591 1 vs 3 1.5541 .1809 CT vs MRI 0.0744 .9417
1, CT enterography; 2, CT enteroclysis; 3, MR enteroclysis; 4, MR enterography; CT, computed tomography; MR, magnetic resonance; MRI, magnetic resonance imaging.
Get Radiology Tree app to read full this article<
Get Radiology Tree app to read full this article<
Get Radiology Tree app to read full this article<
Publication Bias
Get Radiology Tree app to read full this article<
Get Radiology Tree app to read full this article<
Discussion
Get Radiology Tree app to read full this article<
Get Radiology Tree app to read full this article<
Get Radiology Tree app to read full this article<
Get Radiology Tree app to read full this article<
Get Radiology Tree app to read full this article<
Get Radiology Tree app to read full this article<
References
1. Loftus E.V., Schoenfeld P., Sandborn W.J.: The epidemiology and natural history of Crohn’s disease in population-based patient cohorts from North America: a systematic review. Aliment Pharmacol Ther 2002; 16: pp. 51-60.
2. Martin D.R., Lauenstein T., Sitaraman S.V.: Utility of magnetic resonance imaging in small bowel Crohn’s disease. Gastroenterology 2007; 133: pp. 385-390.
3. Jaffe T.A., Gaca A.M., Delaney S., et. al.: Radiation doses from small-bowel follow-through and abdominopelvic MDCT in Crohn’s disease. AJR Am J Roentgenol 2007; 189: pp. 1015-1022.
4. Craig O., O’Neill S., O’Neill F., et. al.: Diagnostic accuracy of computed tomography using lower doses of radiation for patients with Crohn’s disease. Clin Gastroenterol Hepatol 2012; 10: pp. 886-892.
5. The 2007 Recommendations of the International Commission on Radiological Protection : ICRP publication 103. Ann ICRP 2007; 37: pp. 1-332.
6. Desmond A.N., O’Regan K., Curran C., et. al.: Crohn’s disease: factors associated with exposure to high levels of diagnostic radiation. Gut 2008; 57: pp. 1524-1529.
7. Glas A.S., Lijmer J.G., Prins M.H., et. al.: The diagnostic odds ratio: a single indicator of test performance. J Clin Epidemiol 2003; 56: pp. 1129-1135.
8. Lee S.S., Kim A.Y., Yang S.K., et. al.: Crohn disease of the small bowel: comparison of CT enterography, MR enterography, and small-bowel follow-through as diagnostic techniques. Radiology 2009; 251: pp. 751-761.
9. Siddiki H.A., Fidler J.L., Fletcher J.G., et. al.: Prospective comparison of state-of-the-art MR enterography and CT enterography in small-bowel Crohn’s disease. AJR Am J Roentgenol 2009; 193: pp. 113-121.
10. Jensen M.D., Nathan T., Rafaelsen S.R., et. al.: Diagnostic accuracy of capsule endoscopy for small bowel Crohn’s disease is superior to that of MR enterography or CT enterography. Clin Gastroenterol Hepatol 2011; 9: pp. 124-129.
11. Bodily K.D., Fletcher J.G., Solem C.A., et. al.: Crohn disease: mural attenuation and thickness at contrast-enhanced CT enterography—correlation with endoscopic and histologic findings of inflammation. Radiology 2006; 238: pp. 505-516.
12. Minordi L.M., Vecchioli A., Poloni G., et. al.: Enteroclysis CT and PEG-CT in patients with previous small-bowel surgical resection for Crohn’s disease: CT findings and correlation with endoscopy. Eur Radiol 2009; 19: pp. 2432-2440.
13. Mazzeo S., Caramella D., Battolla L., et. al.: Crohn disease of the small bowel: spiral CT evaluation after oral hyperhydration with isotonic solution. J Comput Assist Tomogr 2001; 25: pp. 612-616.
14. Hassan C., Cerro P., Zullo A., et. al.: Computed tomography enteroclysis in comparison with ileoscopy in patients with Crohn’s disease. Int J Colorectal Dis 2003; 18: pp. 121-125.
15. Wold P.B., Fletcher J.G., Johnson C.D., et. al.: Assessment of small bowel Crohn disease: noninvasive peroral CT enterography compared with other imaging methods and endoscopy—feasibility study. Radiology 2003; 229: pp. 275-281.
16. Minordi L.M., Vecchioli A., Mirk P., et. al.: CT enterography with polyethylene glycol solution vs CT enteroclysis in small bowel disease. Br J Radiol 2011; 84: pp. 112-119.
17. Siddiki H., Fletcher J.G., Hara A.K., et. al.: Validation of a lower radiation computed tomography enterography imaging protocol to detect Crohn’s disease in the small bowel. Inflamm Bowel Dis 2011; 17: pp. 778-786.
18. Albert J.G., Martiny F., Krummenerl A., et. al.: Diagnosis of small bowel Crohn’s disease: a prospective comparison of capsule endoscopy with magnetic resonance imaging and fluoroscopic enteroclysis. Gut 2005; 54: pp. 1721-1727.
19. Crook D.W., Knuesel P.R., Froehlich J.M., et. al.: Comparison of magnetic resonance enterography and video capsule endoscopy in evaluating small bowel disease. Eur J Gastroenterol Hepatol 2009; 21: pp. 54-65.
20. Laghi A., Borrelli O., Paolantonio P., et. al.: Contrast enhanced magnetic resonance imaging of the terminal ileum in children with Crohn’s disease. Gut 2003; 52: pp. 393-397.
21. Negaard A., Paulsen V., Sandvik L., et. al.: A prospective randomized comparison between two MRI studies of the small bowel in Crohn’s disease, the oral contrast method and MR enteroclysis. Eur Radiol 2007; 17: pp. 2294-2301.
22. Negaard A., Sandvik L., Mulahasanovic A., et. al.: Magnetic resonance enteroclysis in the diagnosis of small-intestinal Crohn’s disease: diagnostic accuracy and inter- and intra-observer agreement. Acta Radiol 2006; 47: pp. 1008-1016.
23. Ochsenkuhn T., Herrmann K., Schoenberg S.O., et. al.: Crohn disease of the small bowel proximal to the terminal ileum: detection by MR-enteroclysis. Scand J Gastroenterol 2004; 39: pp. 953-960.
24. Pilleul F., Godefroy C., Yzebe-Beziat D., et. al.: Magnetic resonance imaging in Crohn’s disease. Gastroenterol Clin Biol 2005; 29: pp. 803-808.
25. Wiarda B.M., Mensink P.B., Heine D.G., et. al.: Small bowel Crohn’s disease: MR enteroclysis and capsule endoscopy compared to balloon-assisted enteroscopy. Abdom Imaging 2012; 37: pp. 397-403.
26. Kielar A.Z., Tao H., Thipphavong S.: Modified small bowel CT (MBCT) for evaluating sub-acute and chronic conditions affecting the small bowel: a low radiation-dose, unenhanced CT protocol. Insights Imaging 2011; 2: pp. 539-542.
27. Qiu Y., Mao R., Chen B.L., et. al.: Systematic review with meta-analysis: magnetic resonance enterography vs. computed tomography enterography for evaluating disease activity in small bowel Crohn’s disease. Aliment Pharmacol Ther 2014; 40: pp. 134-146.
28. Schmidt S., Lepori D., Meuwly J.Y., et. al.: Prospective comparison of MR enteroclysis with multidetector spiral-CT enteroclysis: interobserver agreement and sensitivity by means of “sign-by-sign” correlation. Eur Radiol 2003; 13: pp. 1303-1311.
29. Horsthuis K., Bipat S., Bennink R.J., et. al.: Inflammatory bowel disease diagnosed with US, MR, scintigraphy, and CT: meta-analysis of prospective studies. Radiology 2008; 247: pp. 64-79.
30. Albert J.G.: Small bowel imaging in managing Crohn’s disease patients. Gastroenterol Res Pract 2012; 2012: pp. 502198.