
Rationale and Objectives
A feasibility study on measuring kidney perfusion by a contrast-free magnetic resonance (MR) imaging technique is presented.
Materials and methods
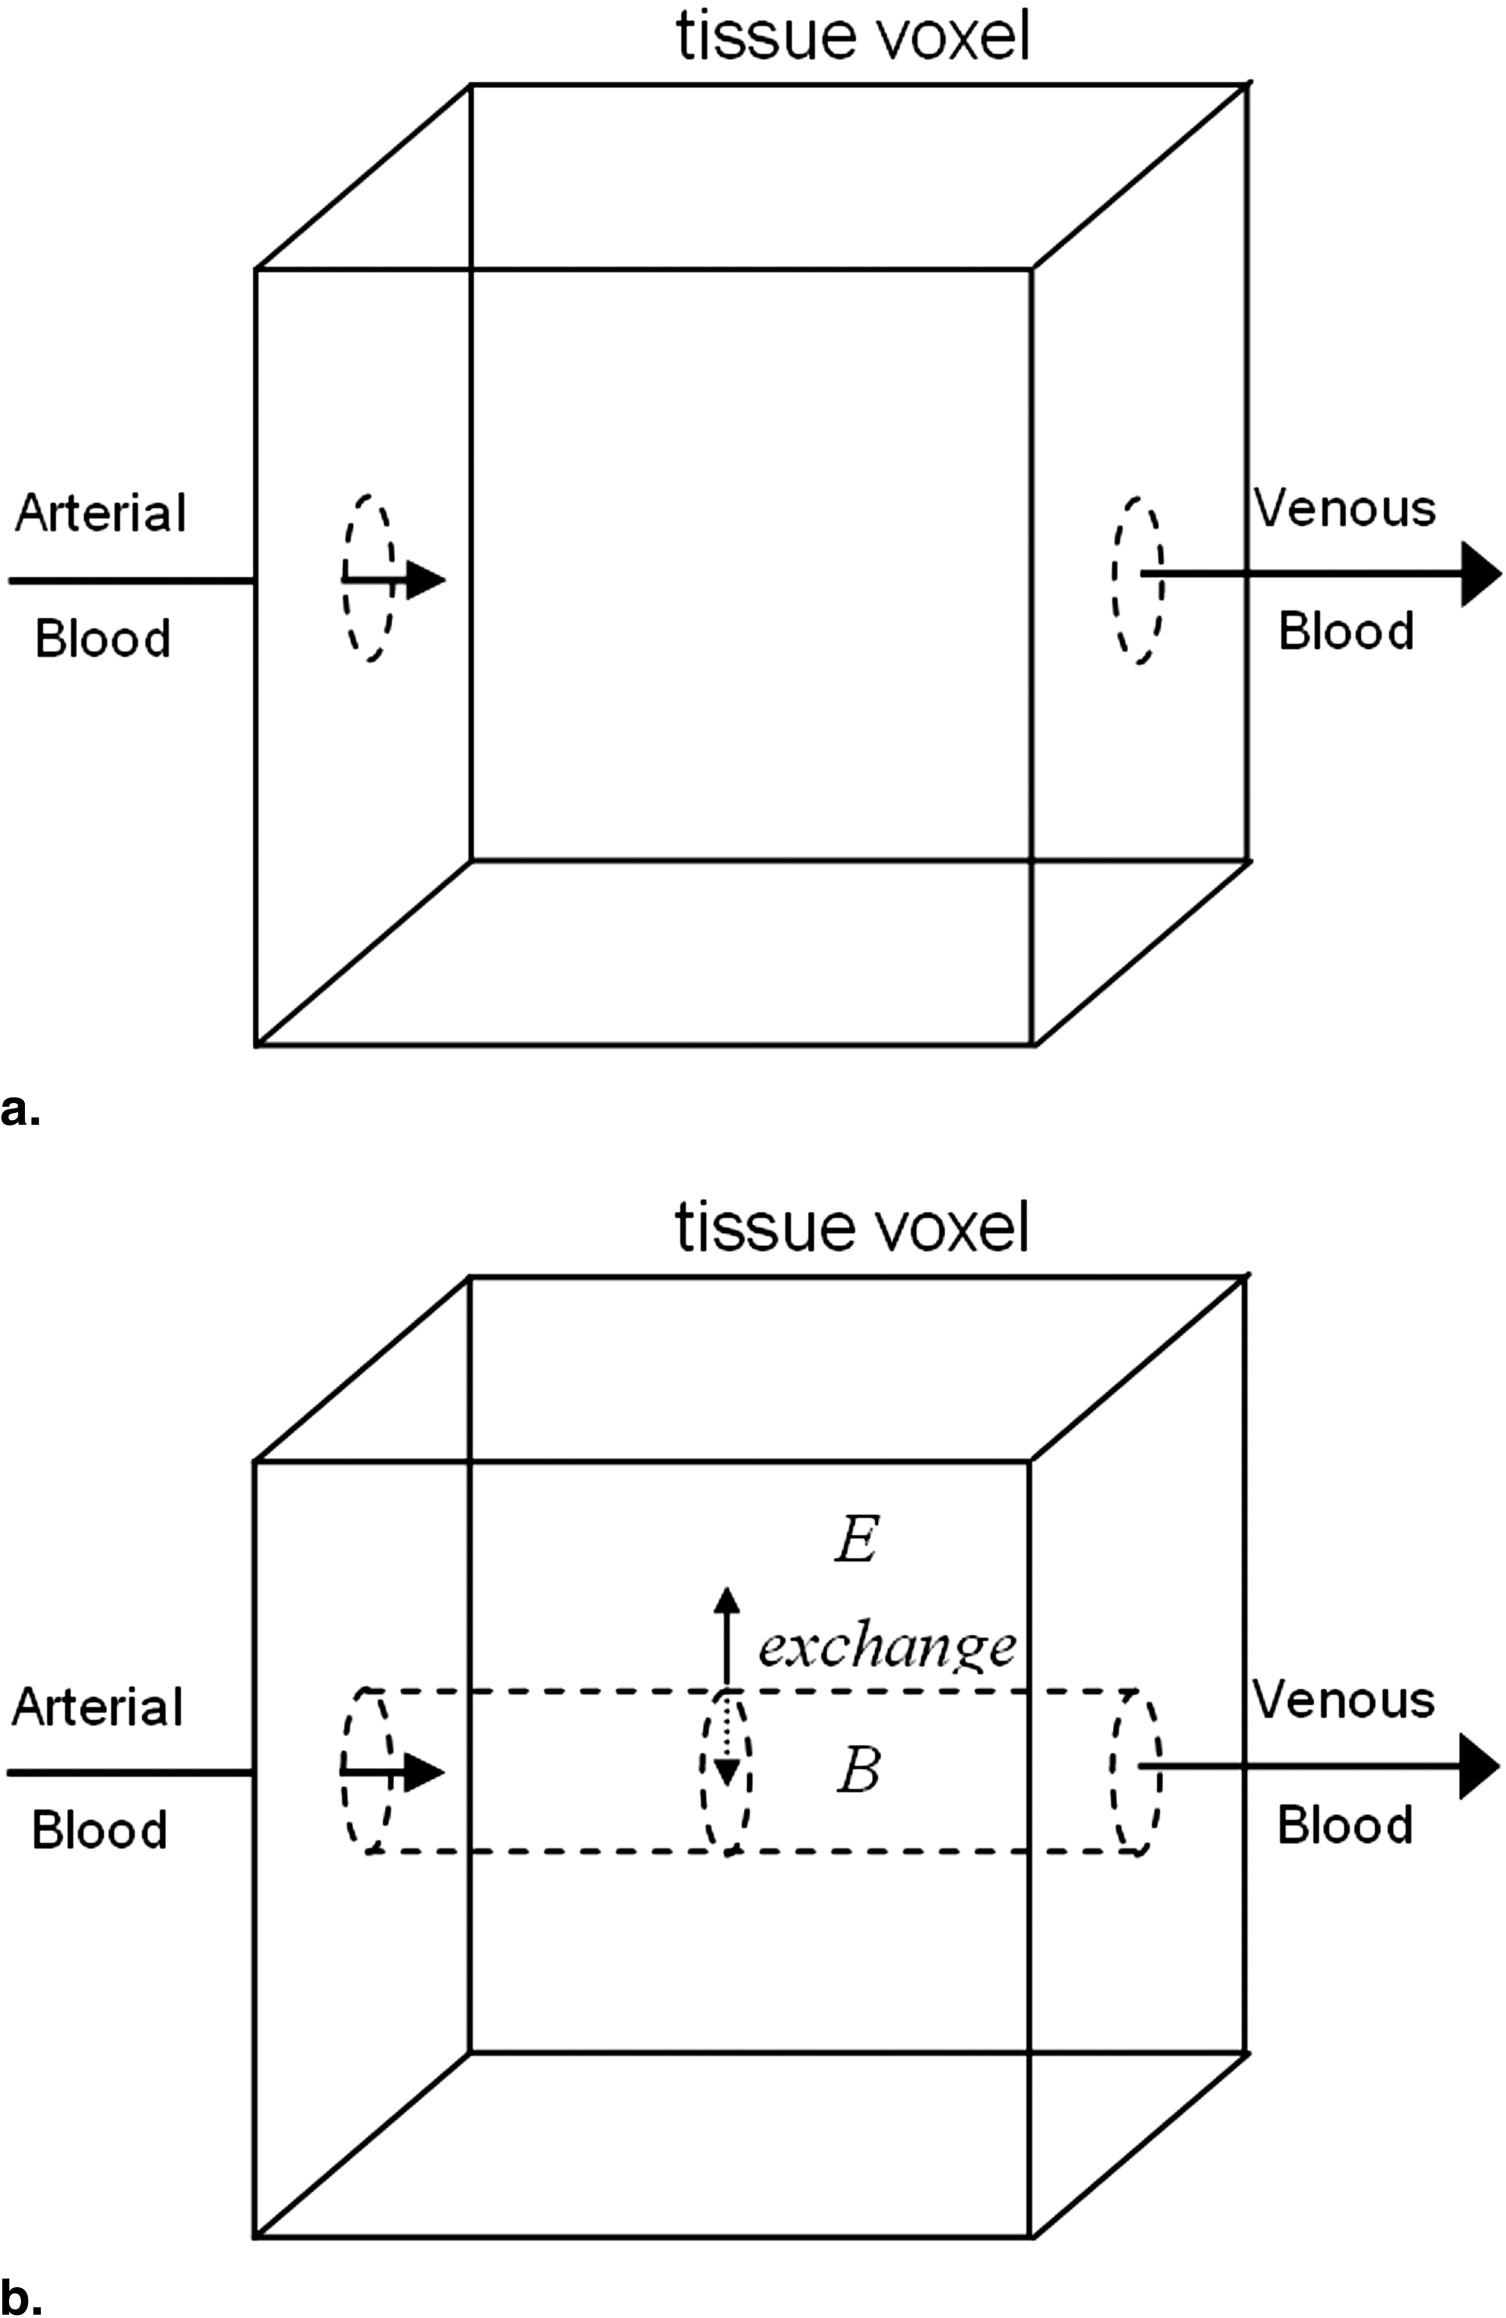
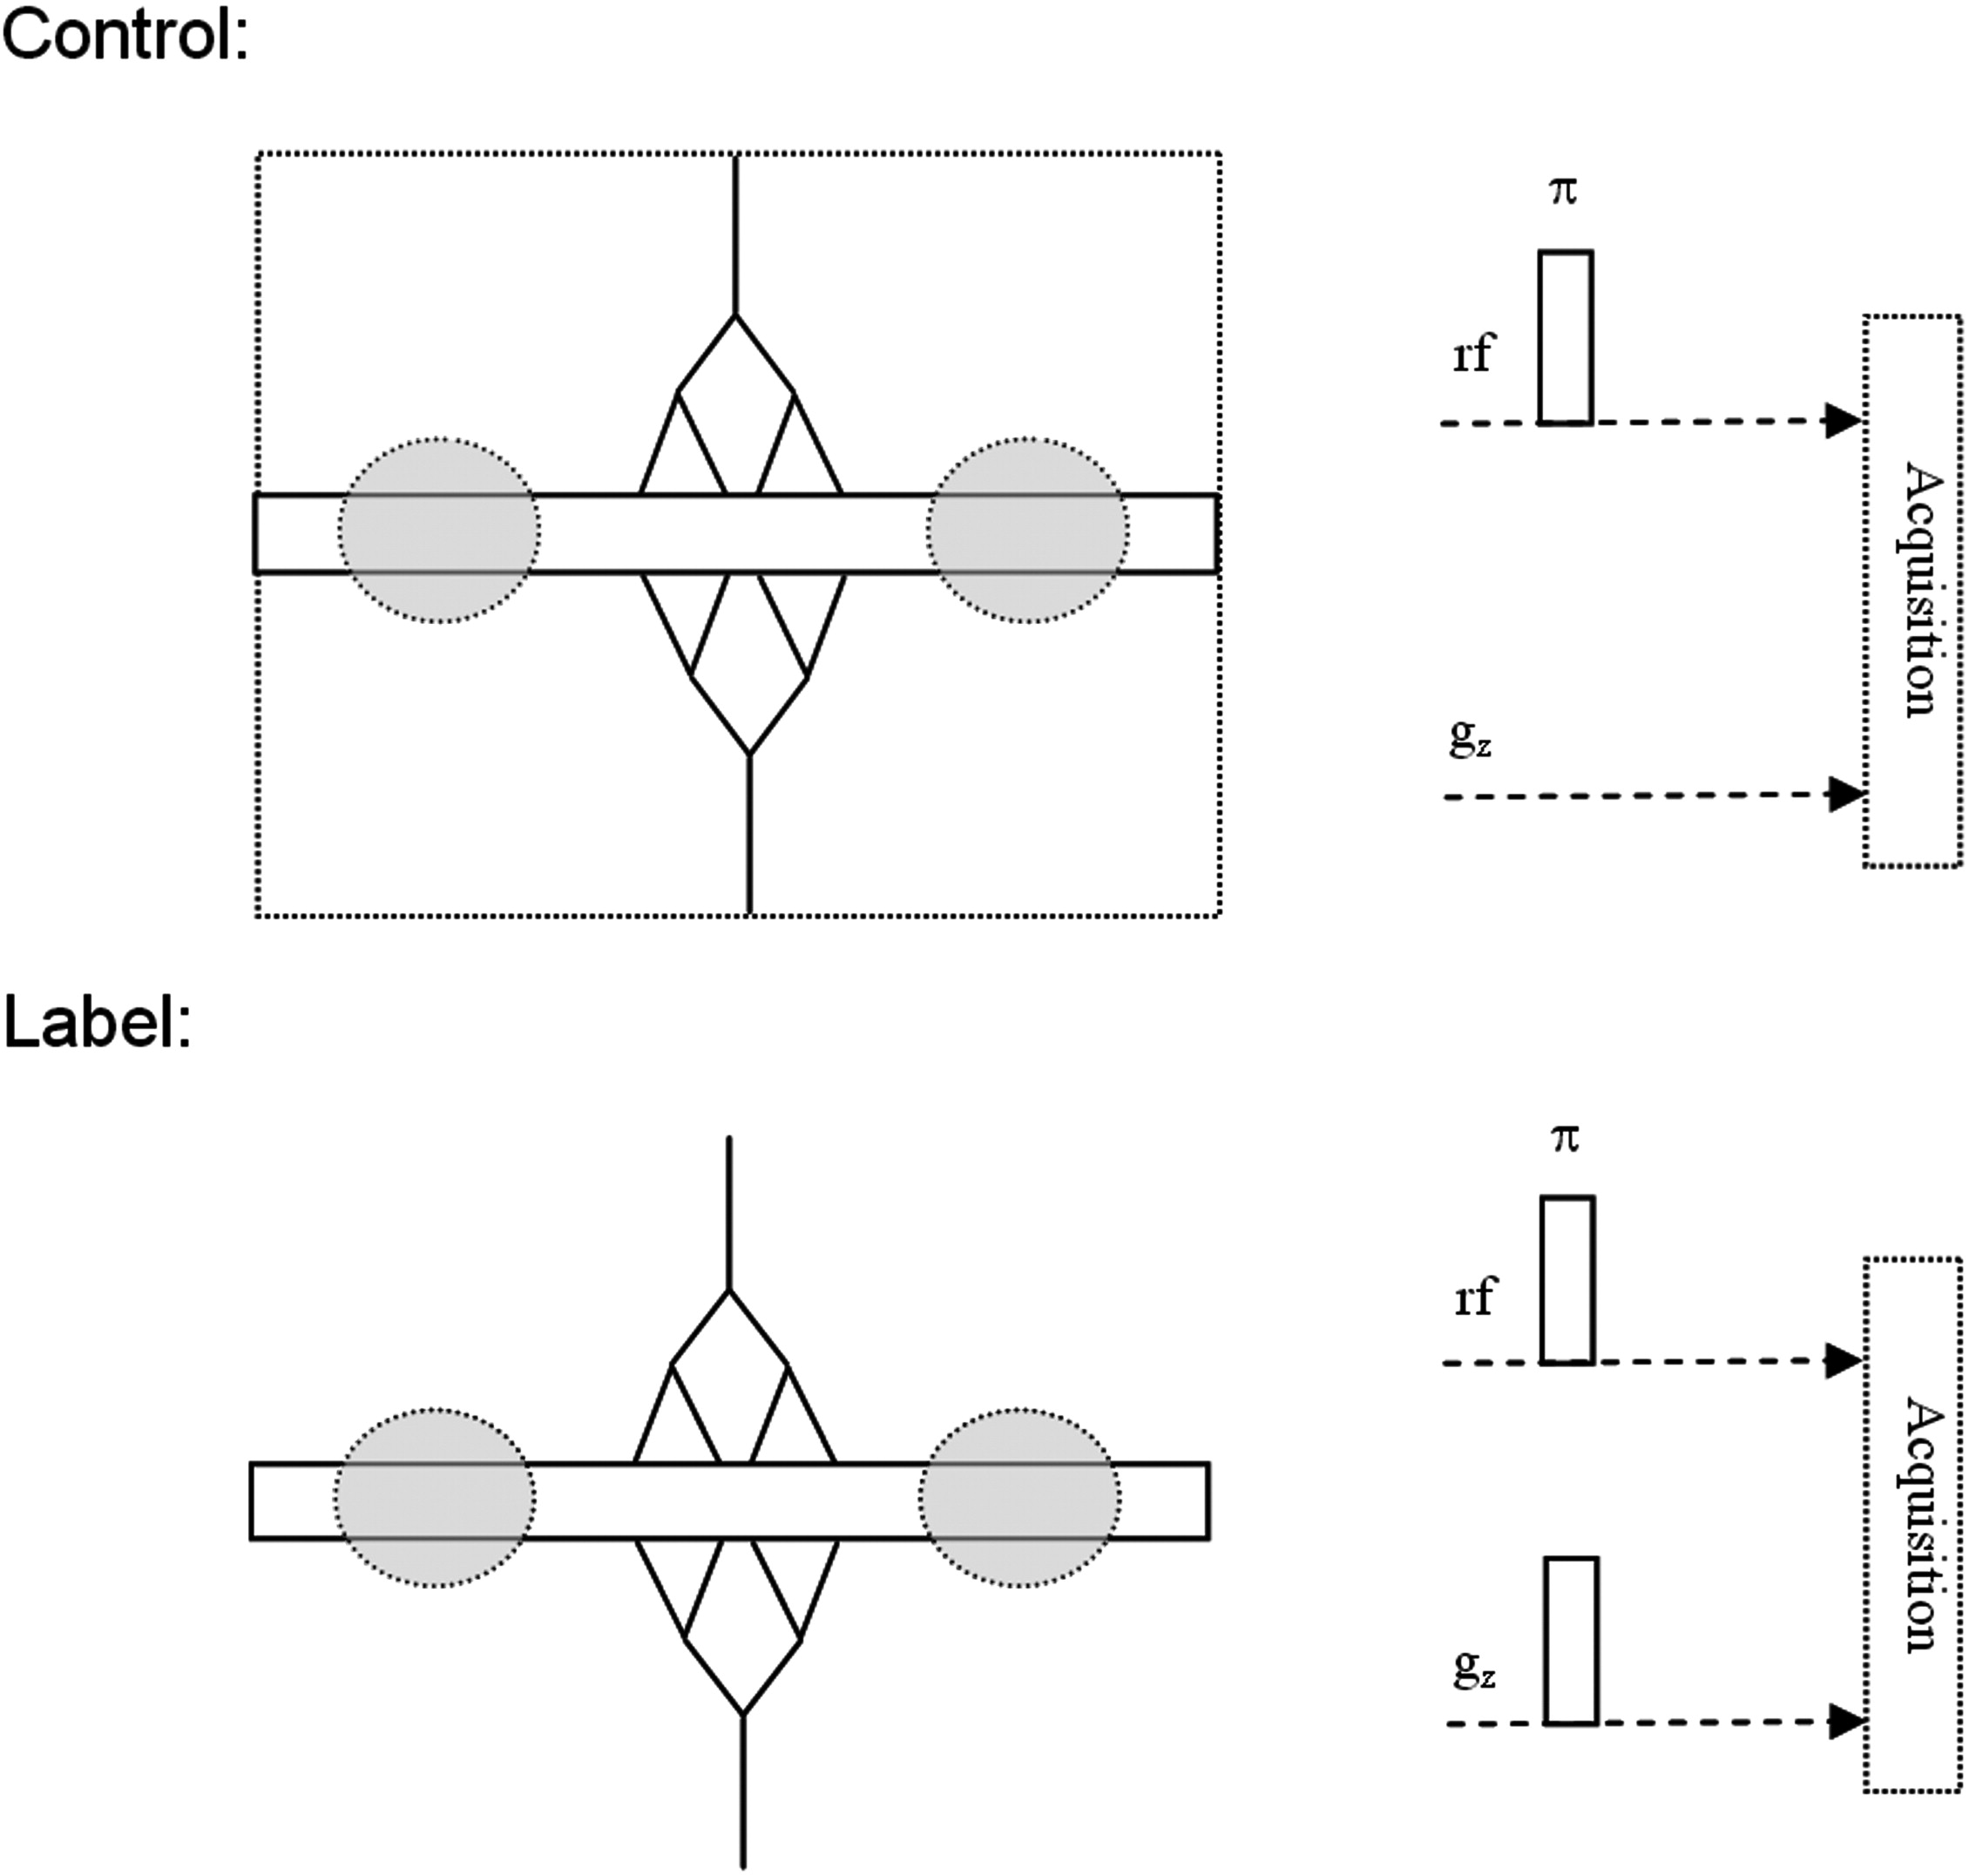
A flow-sensitive alternating inversion recovery (FAIR) prepared true fast imaging with steady-state precession (TrueFISP) arterial spin labeling sequence was used on a 3.0-T MR-scanner. The basis for quantification is a two-compartment exchange model proposed by Parkes that corrects for diverse assumptions in single-compartment standard models.
Results
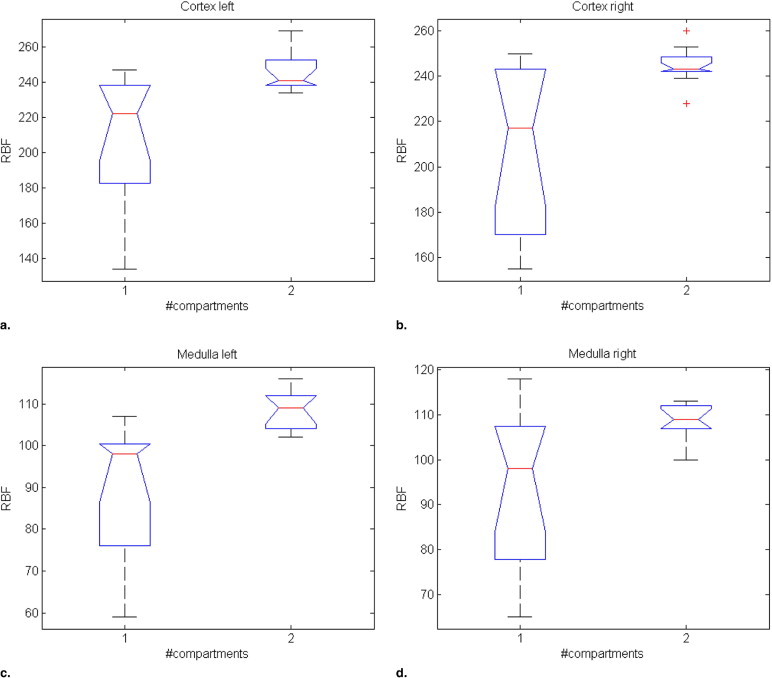
Eleven healthy volunteers (mean age, 42.3 years; range 24–55) were examined. The calculated mean renal blood flow values for the exchange model (109 ± 5 [medulla] and 245 ± 11 [cortex] ml/min − 100 g) are in good agreement with the literature. Most important, the two-compartment exchange model exhibits a stabilizing effect on the evaluation of perfusion values if the finite permeability of the vessel wall and the venous outflow (fast solution) are considered: the values for the one-compartment standard model were 93 ± 18 (medulla) and 208 ± 37 (cortex) ml/min − 100 g.
Conclusion
This improvement will increase the accuracy of contrast-free imaging of kidney perfusion in treatment renovascular disease.
Kidney perfusion represents a complex systemic and autoregulative circulation system. Systemic and local vasoregulation counteract the pressure gradient to maintain renal cortical perfusion within an optimal range for glomerular filtration ( ). The blood vessels of the glomeruli in the renal cortex have an autoregulative function to maintain the filtration pressure in case of high or low systemic blood pressure. Additionally, the renin-anigotensin-aldosterone system is triggered when the pressure in the macula densa falls ( Fig 1 ). Diagnosis is usually based on clinical problems in combination with sonographic imaging, computed tomography, magnetic resonance imaging, or even more invasively with angiography ( ). These methods are limited to reveal morphologic, hemodynamic, or pressure gradient details of the renal artery, or are invasive or require radiation and potentially nephrotoxic contrast media exposure ( ). Therefore, noninvasive, contrast-free functional imaging is required to study the therapeutic effects on renal tissue perfusion.
 Open full size image
Figure 1
Effect of renal artery stenosis on systemic blood pressure and renal autoregulation. A decrease in renal arterial pressure results in a dilation of the afferent arteriol of the glomeruli, whereas the efferent arteriol exerts a constriction. Subsequently, inflow increases and outflow decreases, resulting in an augmented filtration pressure and ultrafiltraion rate is equalized. Furthermore, low inflow pressure triggers the renin-angiotensin-aldosterone system. Systemic effects are vasoconstriction and volume extension through salt and water retention in order to elevate systemic blood pressure.
Get Radiology Tree app to read full this article<
Get Radiology Tree app to read full this article<
Get Radiology Tree app to read full this article<
Materials And Methods
Get Radiology Tree app to read full this article<
Get Radiology Tree app to read full this article<
Get Radiology Tree app to read full this article<
Get Radiology Tree app to read full this article<
Get Radiology Tree app to read full this article<
Get Radiology Tree app to read full this article<
Get Radiology Tree app to read full this article<
Get Radiology Tree app to read full this article<
Get Radiology Tree app to read full this article<
Results
Get Radiology Tree app to read full this article<
Table 1
Renal Blood Flow (RBF) and Proton Density-weighted (M0) Parameter Values (related to regions of interest around the kidney) and the Procentual Number of Evaluable Measurements ( n )
One-compartment Model % M0 (le,ri) RBF (C I) le,ri RBF (M I) le,ri 100 605, 477 236, 247 98, 108 90 629, 570 239, 238 102, 106 95 705, 728 238, 217 101, 98 100 777, 664 222, 250 99, 118 97 192, 235 201, 171 93, 80 89 125, 144 182, 166 76, 71 94 242, 221 238, 232 99, 98 86 200, 200 247, 245 107, 111 89 237, 253 184, 170 76, 77 67 180, 183 171, 195 71, 91 78 155, 167 134, 155 59, 65 208 (37), 208 (37) 89 (16), 93 (18)
Two-compartment Model % M0 (le,ri) RBF (C II) le,ri RBF (M II) le,ri 100 605, 477 245, 247 112, 113 90 629, 570 241, 239 111, 107 95 705, 728 239, 243 109, 112 100 777, 664 239, 243 104, 109 97 192, 235 255, 249 112, 111 89 125, 144 269, 228 116, 100 94 242, 221 234, 243 104, 104 86 200, 200 238, 253 104, 112 89 237, 253 258, 245 114, 107 67 180, 183 244, 260 108, 113 78 155, 167 234, 242 102, 108 245 (11), 245 (8) 109 (5), 109 (4)
C, cortex; le, left; M, medulla; ri, right.
Get Radiology Tree app to read full this article<
Get Radiology Tree app to read full this article<
Get Radiology Tree app to read full this article<
Discussion
Get Radiology Tree app to read full this article<
Get Radiology Tree app to read full this article<
Get Radiology Tree app to read full this article<
Conclusions
Get Radiology Tree app to read full this article<
Acknowledgements
Get Radiology Tree app to read full this article<
Get Radiology Tree app to read full this article<
References
1. Nabel E.G., Gibbons G.H., Dzau V.J.: Pathophysiology of experimental renovascular hypertension. Am J Kidney Dis 1985; 5: pp. A111-A119.
2. Textor S.C.: Renovascular hypertension update. Curr Hypertens Rep 2006; 8: pp. 521-527.
3. Schoenberg S.O., Rieger J.R., Michaely H.J., Rupprecht H., Samtleben W., Reiser M.F.: Functional magnetic resonance imaging in renal artery stenosis. Abdom Imaging 2006; 31: pp. 200-212.
4. Cheung C.M., Shurrab A.E., Buckley D.L., Hegarty J., Middleton R.J., Mamtora H., Kalra P.A.: MR-derived renal morphology and renal function in patients with atherosclerotic renovascular disease. Kidney Int 2006; 69: pp. 715-722.
5. Romero J.C., Lerman L.O.: Novel noninvasive techniques for studying renal function in man. Semin Nephrol 2000; 20: pp. 456-462.
6. Schoenberg S.O., Aumann S., Just A., Bock M., Knopp M.V., Johansson L.O., Ahlstrom H.: Quantification of renal perfusion abnormalities using an intravascular contrast agent (part 2): Results in animals and humans with renal artery stenosis. Magn Reson Med 2003; 49: pp. 288-298.
7. Jiang Q., Zhang Z.G., Chopp M., et. al.: Temporal evolution and spatial distribution of the diffusion constant of water in rat brain after transient middle cerebral artery occlusion. J Neurol Sci 1993; 120: pp. 123-130.
8. Jiang Q., Chopp M., Zhang Z.G., et. al.: The effect of hypothermia on transient focal ischemia in rat brain evaluated by diffusion- and perfusion-weighted NMR imaging. J Cereb Blood Flow Metab 1994; 14: pp. 732-741.
9. Busch E., Kruger K., Allegrini P.R., et. al.: Reperfusion after thrombolytic therapy of embolic stroke in the rat: magnetic resonance and biochemical imaging. J Cereb Blood Flow Metab 1998; 18: pp. 407-418.
10. Jiang Q., Zhang Z.G., Zhang R.L., et. al.: Diffusion, perfusion, and T2 magnetic resonance imaging of anti-intercellular adhesion molecule 1 antibody treatment of transient middle cerebral artery occlusion in rat. Brain Res 1998; 788: pp. 191-201.
11. Calamante F., Lythgoe M.F., Pell G.S., et. al.: Early changes in water diffusion, perfusion, T1, and T2 during focal cerebral ischemia in the rat studied at 8.5 T. Magn Reson Med 1999; 41: pp. 479-485.
12. Siewert B., Schlaug G., Edelman R.R., Warach S.: Comparison of EPISTAR and T2*-weighted gadolinium-enhanced perfusion imaging in patients with acute cerebral ischemia. Neurology 1997; 48: pp. 673-679.
13. Detre J.A., Samuels O.B., Alsop D.C., Gonzalez-At J.B., Kasner S.E., Raps E.C.: Noninvasive magnetic resonance imaging evaluation of cerebral blood flow with acetazolamide challenge in patients with cerebrovascular stenosis. J Magn Reson Imaging 1999; 10: pp. 870-875.
14. Chalela J.A., Alsop D.C., Gonzalez-Atavales J.B., Maldjian J.A., Kasner S.E., Detre J.A.: Magnetic resonance perfusion imaging in acute ischemic stroke using continuous arterial spin labeling. Stroke 2000; 31: pp. 680-687.
15. Ogawa S., Lee T.M., Kay A.R., Tank D.W.: Brain magnetic resonance imaging with contrast dependent on blood oxygenation. Proc Natl Acad Sci USA 1990; 87: pp. 9868-9872.
16. Forbes M.L., Hendrich K.S., Kochanek P.M., et. al.: Assessment of cerebral blood flow and CO2 reactivity after controlled cortical impact by perfusion magnetic resonance imaging using arterial spin-labeling in rats. J Cereb Blood Flow Metab 1997; 17: pp. 865-874.
17. Alsop D.C., Detre J.A., Grossman M.: Assessment of cerebral blood flow in Alzheimer’s disease by spin-labeled magnetic resonance imaging. Ann Neurol 2000; 47: pp. 93-100.
18. Gaa J., Warach S., Wen P., Thangaraj V., Wielopolski E.R.R.: Noninvasive perfusion imaging of human brain tumors with EPISTAR. Eur Radiol 1996; 6: 518–512
19. Brown S.L., Ewing J.R., Kolozsvary A., Butt S., Cao Y., Kim J.H.: Magnetic resonance imaging of perfusion in rat cerebral 9L tumor after nicotinamide administration. Int J Radiat Oncol Biol Phys 1999; 43: pp. 627-633.
20. Silva A.C., Kim S.G., Garwood M.: Imaging blood flow in brain tumors using arterial spin labeling. Magn Reson Med 2000; 44: pp. 169-173.
21. Kim S.-G.: Quantification of relative cerebral blood flow change by flow-sensitive alternating inversion recovery (FAIR) technique: application to functional mapping. Magn Reson Med 1995; 34: pp. 293-301.
22. Pell GS, Proctor E, Thomas DL, Busza AL, Ordidge RJ. Validation of the FAIR technique of perfusion quantification with hydrogen clearance. I: Proceedings of the 7th Annual Meeting of ISMRM, Philadelphia, PA, 1999:599.
23. Martirosian P., Klose U., Mader I., Schick F.: FAIR True-FISP perfusion imaging of the kidneys. Magn Reson Med 2004; 51: pp. 353-361.
24. Parkes L.M., Tofts P.S.: Improved accuracy of human cerebral blood perfusion measurements using arterial spin labeling: Accounting for capillary water permeability. Magn Reson Med 2002; 48: pp. 27-41.
25. James R.E., Yue C., Robert A.K., Joseph D.F.: Arterial spin labeling: Validity testing and comparison studies. J. Magn Reson Imag 2005; 22: pp. 737-740.
26. Kety S.S., Schmidt C.F.: The determination of cerebral blood flow in man by use of nitrous oxide in low concentrations. Am J Physiol 1945; 143: pp. 53-66.
27. Buxton R.B., Frank L.R., Wong E.C., Siewert B., Warach S., Edelman R.R.: A general kinetic model for quantitative perfusion imaging with arterial spin labeling. Magn Reson Med 1998; 40: pp. 383-396.
28. Detre J.A., Leigh J.S., Williams D.S., Koretsky A.P.: Perfusion imaging. Magn Reson Med 1992; 23: pp. 37-45.
29. Williams D.S., Grandis D.J., Zhang W., Koretsky A.P.: Magnetic resonance imaging of perfusion in the isolated rat heart using spin inversion of arterial water. Magn Reson Med 1993; 30: pp. 361-365.
30. Yongbi M.N., Branch C.A., Helpern J.A.: Perfusion imaging using FOCI RF pulses. Magn Reson Med 1998; 40: 983–943
31. Lu H., Clingman C., Golay X., van Zijl P.C.M.: Determining the Longitudinal Relaxation Time (T1) of Blood at 3.0 Tesla. Magn Reson Med 2004; 52: pp. 679-682.
32. van Jaarsveld B., Krijnen P., Bartelink A., Dees A., Derkx F., Man in’t Veld A., Schalekamp M.: The Dutch Renal Artery Stenosis Intervention Cooperative (DRASTIC) Study: rationale, design and inclusion data. J Hypertens Suppl 1998; 16: pp. S21-S27.
33. Safian R.D.: Atherosclerotic Renal Artery Stenosis. Curr Treat Options Cardiovasc Med 2003; 5: pp. 91-101.