
Rationale and Objectives
The purpose of this study was to compare lesion-detection performance when interpreting computed tomography (CT) images that are acquired for attenuation correction when performing single photon emission computed tomography/computed tomography (SPECT/CT) myocardial perfusion studies. In the United Kingdom, there is a requirement that these images be interpreted; thus, it is necessary to understand observer performance on these images.
Materials and Methods
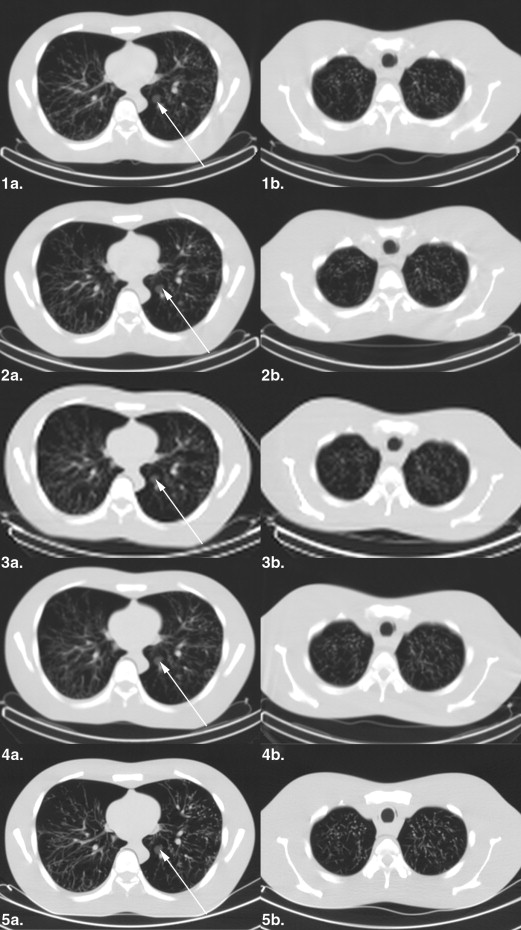
An anthropomorphic chest phantom with inserted spherical lesions of different sizes and contrasts was scanned on five different SPECT/CT systems using site-specific CT protocols for SPECT/CT myocardial perfusion imaging. Twenty-one observers (0–4 years of CT experience) searched 26 image slices (17 abnormal, containing 1–3 lesions, and 9 normal, containing no lesions) for each CT acquisition. The observers marked and rated perceived lesions under the free-response paradigm. Four analyses were conducted using jackknife alternative free-response receiver operating characteristic (JAFROC) analysis: (1) 20-pixel acceptance radius (AR) with all 21 readers, abbreviated to 20/ALL analysis, (2) 40-pixel AR with 21 readers (40/ALL), (3) 20-pixel AR with 14 readers experienced in CT (20/EXP), and (4) 20-pixel AR with 7 readers with no CT experience (20/NOT). The significance level of the test was set so as to conservatively control the overall probability of a type I error to <0.05.
Results
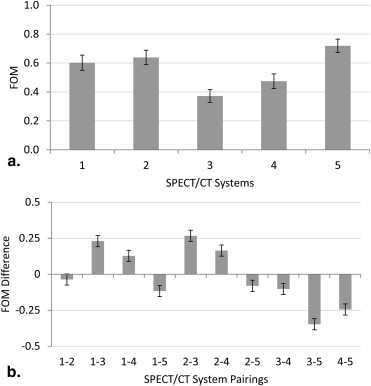
The mean JAFROC figure of merit (FOM) for the five CT acquisitions for the 20/ALL study were 0.602, 0.639, 0.372, 0.475, and 0.719 with a significant difference in lesion-detection performance evident between all individual treatment pairs ( P < .0001) with the exception of the 1-2 pairing, which was not significant (these differed only in milliamp seconds). System 5, which had the highest performance, had the smallest slice thickness and the largest matrix size. For the other analyses, the system orderings remained unchanged, and the significance of FOM difference findings remained identical to those for 20/ALL, with one exception: for 20/EXP analysis the 1-2 difference became significant with the higher milliamp seconds superior. Improved detection performance was associated with a smaller slice thickness, increased matrix size, and, to a lesser extent, increased tube charge.
Conclusions
Protocol variations for CT-based attenuation correction (AC) in SPECT/CT imaging have a measurable impact on lesion-detection performance. The results imply that z-axis resolution and matrix size had the greatest impact on lesion detection, with a weaker but detectable dependence on the product of milliamp and seconds.
Attenuation correction (AC) has become necessary in myocardial perfusion imaging (MPI) because of the likelihood of photon attenuation artifacts. In addition to a general reduction of photon counts in larger patients, localized photon attenuation artifacts typically caused by diaphragmatic attenuation in larger men and breast attenuation in larger women can cause difficulties in interpretation. Misinterpretation could lead to unnecessary invasive intervention, such as coronary angiography. This type of error is clinically unacceptable, and a high-quality attenuation map is recommended to correct for these patient-induced artifacts . For these reasons, AC is recommended by the American Society of Nuclear Cardiology and Society of Nuclear Medicine for MPI studies .
AC was initially performed using radionuclide-based transmission images but has been superseded by an x-ray computed tomography (CT)–based technique .
Get Radiology Tree app to read full this article<
Get Radiology Tree app to read full this article<
Get Radiology Tree app to read full this article<
Get Radiology Tree app to read full this article<
Materials and methods
Image Acquisition
Get Radiology Tree app to read full this article<
Get Radiology Tree app to read full this article<
Get Radiology Tree app to read full this article<
Table 1
The CT Acquisition Parameters and CT Doses Delivered by the Five SPECT/CT Systems
SPECT/CT Systems kVp mAs Product Pitch Rec. Slice Thickness (mm) Scan FOV (mm) Matrix Size Pixel Size (mm) CTDI (mGy) Number of Axial CT Images 1 140 30.4 1.9 6.1 435 256 × 256 1.70 3.976 97 2 140 18.2 1.9 6.1 435 256 × 256 1.70 2.380 116 3 140 57.7 1 10 442 128 × 128 3.45 4.600 36 4 140 57.7 1 10 435 256 × 256 1.70 4.112 40 5 120 49.6 0.94 5 600 512 × 512 1.17 3.500 58
CTDI, computed tomography dose index; FOV, field of view (x-y dimension); kVp, kilovoltage peak; mAs, milliamp seconds; Rec, reconstructed; SPECT/CT, single photon emission computed tomography/computed tomography.
Get Radiology Tree app to read full this article<
Get Radiology Tree app to read full this article<
Get Radiology Tree app to read full this article<
Observer Performance Study
Get Radiology Tree app to read full this article<
Get Radiology Tree app to read full this article<
Statistical Analysis
Get Radiology Tree app to read full this article<
Get Radiology Tree app to read full this article<
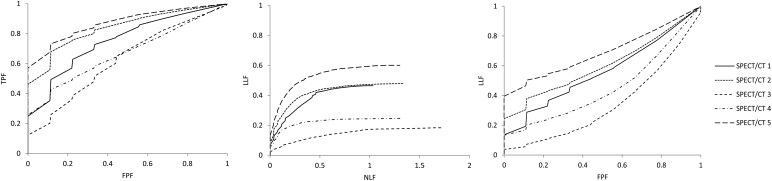
Plotting Free-response Data
Get Radiology Tree app to read full this article<
Get Radiology Tree app to read full this article<
Results
Get Radiology Tree app to read full this article<
Table 2
Summary Results for the Five SPECT/CT Systems for the Four Analyses (Two for Effect of Acceptance Radius and Two for the Effect of Reader CT Experience)
Analysis F-statistic_P_ Value Avg. number of NL Marks per Normal Case Avg. number of NL Marks per Abnormal Case Avg. number of LL Marks per Abnormal Case 20-pixel AR ( n = 21) F (4,80) = 100.16 <.0001 0.575 0.649 0.674 40-pixel AR ( n = 21) F (4,80) = 95.09 <.0001 0.569 0.626 0.701 CT Experience ( n = 14) F (4,52) = 72.45 <.0001 0.444 0.535 0.679 No CT Experience ( n = 7) F (4,24) = 26.83 <.0001 0.835 0.877 0.664
AR, acceptance radius; Avg, average; n , number of observers; LL, lesion localization; NL, nonlesion localization; SPECT/CT, single photon emission computed tomography/computed tomography.
Get Radiology Tree app to read full this article<
Get Radiology Tree app to read full this article<
Get Radiology Tree app to read full this article<
Discussion
Get Radiology Tree app to read full this article<
Get Radiology Tree app to read full this article<
Get Radiology Tree app to read full this article<
Get Radiology Tree app to read full this article<
Get Radiology Tree app to read full this article<
Get Radiology Tree app to read full this article<
Get Radiology Tree app to read full this article<
Conclusions
Get Radiology Tree app to read full this article<
Acknowledgment
Get Radiology Tree app to read full this article<
Get Radiology Tree app to read full this article<
Get Radiology Tree app to read full this article<
Get Radiology Tree app to read full this article<
Get Radiology Tree app to read full this article<
References
1. Burrell S., MacDonald A.: Artifacts and pitfalls in myocardial perfusion imaging. J Nucl Med Technol 2006; 34: pp. 193-211.
2. Flotats A., Knuuti J., Gutberlet M., et. al.: Hybrid cardiac imaging: SPECT/CT and PET/CT. A joint position statement by the European Association of Nuclear Medicine (EANM), the European Society of Cardiac Radiology (ESCR) and the European Council of Nuclear Cardiology (ECNC). Eur J Nucl Med Mol Imaging 2011; 38: pp. 201-212.
3. Buck A.K., Nekolla S., Ziegler S., et. al.: SPECT/CT. J Nucl Med 2008; 49: pp. 1305-1319.
4. Heller G.V., Links J., Bateman T.M., et. al.: American society of nuclear cardiology and society of nuclear medicine joint position statement: attenuation correction of myocardial perfusion SPECT scintigraphy. J Nucl Cardiol 2004; 11: pp. 229-230.
5. Bybel B., Brucken R.C., DiFilippo F.P., et. al.: SPECT/CT imaging: clinical utility of an emerging technology. Radiographics 2008; 28: pp. 1097-1113.
6. Patton J.A., Turkington T.G.: SPECT/CT physical principles and attenuation correction. J Nucl Med Technol 2008; 36: pp. 1-10.
7. Willowson K., Bailey D.L., Baldock C.: Quantitative SPECT reconstruction using CT-derived corrections. Phys Med Biol 2008; 53: pp. 3099-3112.
8. Goetze S., Brown T.L., Lavely W.C., et. al.: Attenuation correction in myocardial perfusion SPECT/CT: effects of misregistration and value of reregistration. J Nucl Med 2007; 48: pp. 1090-1095.
9. Pazhenkottil A.P., Ghadri J.-R., Nkoulou R.N., et. al.: Improved outcome prediction by SPECT myocardial perfusion imaging after CT attenuation correction. J Nucl Med 2011; 52: pp. 196-200.
10. The Ionising Radiation (Medical Exposure) Regulations 2000 http://www.legislation.gov.uk/uksi/2000/1059/pdfs/uksi_20001059_en.pdf [Updated 2000, Accessed 2012 May 05].
11. Preuss R., Weise R., Linder O., et. al.: Optimisation of protocol for low dose CT-derived attenuation correction in myocardial perfusion SPECT imaging. Eur J Nucl Med Mol Imaging 2008; 35: pp. 1133-1141.
12. Wells R.G., Soueidan K., Vanderwerf K., et. al.: Comparing slow- versus high-speed CT for attenuation correction of cardiac SPECT perfusion studies. J Nucl Cardiol 2012; 19: pp. 719-726.
13. Thompson J., Hogg P., Higham S., et. al.: Accurate localization of incidental findings on the computed tomography attenuation correction image: the influence of tube current variation. Nucl Med Commun 2013; 34: pp. 180-184.
14. Goetze S., Pannu H., Wahl R.: Clinically significant abnormal findings on the “nondiagnostic” CT portion of low-amperage-CT attenuation-corrected myocardial perfusion SPECT/CT studies. J Nucl Med 2006; 47: pp. 1312-1318.
15. Thompson J., Hogg P., Thompson S., et. al.: ROCView: prototype software for data collection in jackknife alternative free-response receiver operating characteristic analysis. Br J Radiol 2012; 85: pp. 1320-1326.
16. The Royal College of Radiologists. Picture archiving and communication system (PACS) and guidelines on diagnostic display devices. 2nd ed. http://www.rcr.ac.uk/docs/radiology/pdf/BFCR(12)16_PACS_DDD.pdf [Updated 11.2012; Accessed 2013 Feb 27].
17. Chakraborty D.P., Berbaum K.S.: Observer studies involving detection and localization: modelling, analysis, and validation. Med Phys 2004; 31: pp. 2313-2330.
18. Dorfman D.D., Berbaum K.S., Metz C.E.: Receiver operating characteristic rating analysis: generalization to the population of readers and patients with the jackknife method. Invest Radiol 1992; 27: pp. 723-731.
19. Dorfman D.D., Berbaum K.S., Lenth R.V., et. al.: Monte Carlo validation of a multireader method for receiver operating characteristic discrete rating data: factorial experimental design. Acad Radiol 1998; 5: pp. 591-602.
20. Hillis S.L., Berbaum K.S.: Power estimation for the Dorfman-Berbaum-Metz method. Acad Radiol 2004; 11: pp. 1260-1273.
21. Hillis S.L., Obuchowski N.A., Schartz K.M., et. al.: A comparison of the Dorfman-Berbaum-Metz and Obuchowski-Rockette methods for receiver operating characteristic (ROC) data. Stat Med 2005; 24: pp. 1579-1607.
22. Hillis S.L.: Monte Carlo validation of the Dorfman-Berbaum-Metz method using normalized pseudovalues and less data-based model simplification. Acad Radiol 2005; 12: pp. 1534-1541.
23. Hillis S.L.: A comparison of denominator degrees of freedom for multiple observer ROC analysis. Stat Med 2007; 26: pp. 596-619.
24. Hillis S.L., Berbaum K.S., Metz C.E.: Recent developments in the Dorfman-Berbaum-Metz procedure for multireader ROC study analysis. Acad Radiol 2008; 15: pp. 647-661.
25. Chakraborty D., Yoon H.-J., Mello-Thomas C.: Spatial localization accuracy of radiologists in free-response studies: inferring perceptual FROC curves from mark-rating data. Acad Radiol 2007; 14: pp. 4-18.
26. Schietinger B.J., Bozlar U., Hagspiel K.D., et. al.: The prevalence of extracardiac findings by multidetector computed tomography before atrial fibrillation ablation. Am Heart J 2008; 155: pp. 254-259.
27. International Atomic Energy Association. Clinical applications of SPECT/CT: new hybrid nuclear medicine imaging system. http://www-pub.iaea.org/MTCD/publications/PDF/te_1597_web.pdf [Updated 2008; Accessed Online 2012 Dec 04].
28. Erlandsson K., Nunez M., Kruppa D., et. al.: Reduction of CT artifacts due to respiratory motion in a slowly rotating SPECT/CT. Nuclear Science Symposium Conference Record. IEEE 2008; pp. 3775-3778.
29. Segars W.P., Tsui B.M.W.: Effect of respiratory motion in CT-based attenuation correction in SPECT using different CT scanners and protocols. Nuclear Science Symposium Conference Record. IEEE 2005; 4: pp. 2413-2417.
30. Thompson J., Szczepura K., Manning D., et. al.: Lesion detection in the CT attenuation correction image of 5 different low-resolution SPECT/CT systems: a multi-center study. Nuclear Medicine Communications 2012; 33: pp. 548.