
Rationale and Objectives
To determine independent contribution of each prostate multiparametric magnetic resonance imaging (mpMRI) sequence to cancer detection when read in isolation.
Materials and Methods
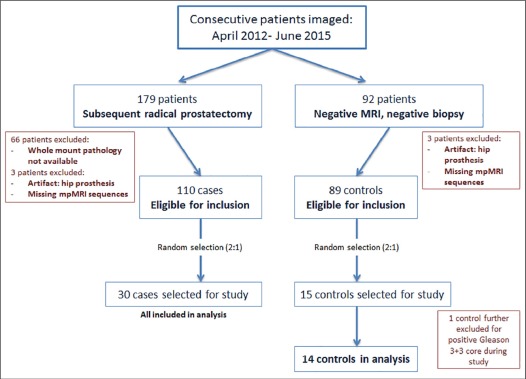
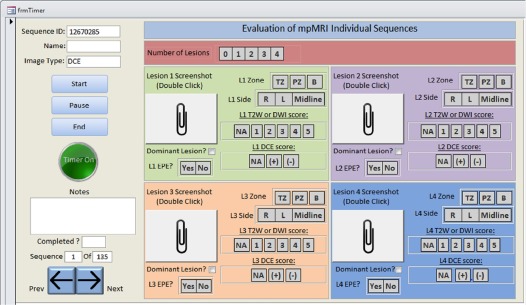
Prostate mpMRI at 3-Tesla with endorectal coil from 45 patients ( n = 30 prostatectomy cases, n = 15 controls with negative magnetic resonance imaging [MRI] or biopsy) were retrospectively interpreted. Sequences (T2-weighted [T2W] MRI, diffusion-weighted imaging [DWI], and dynamic contrast-enhanced [DCE] MRI; N = 135) were separately distributed to three radiologists at different institutions. Readers evaluated each sequence blinded to other mpMRI sequences. Findings were correlated to whole-mount pathology. Cancer detection sensitivity, positive predictive value for whole prostate (WP), transition zone, and peripheral zone were evaluated per sequence by reader, with reader concordance measured by index of specific agreement. Cancer detection rates (CDRs) were calculated for combinations of independently read sequences.
Results
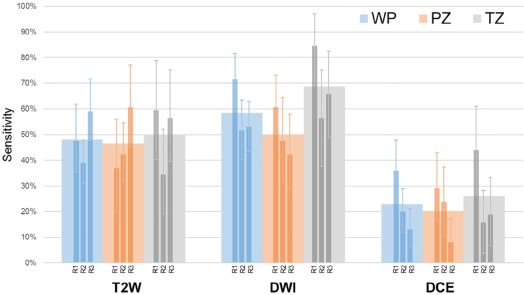
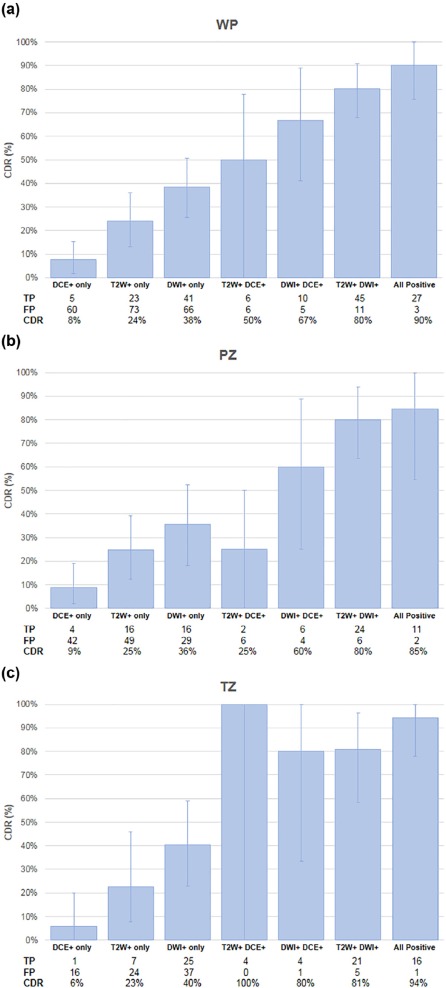
44 patients were evaluable (cases median prostate-specific antigen 6.83 [ range 1.95–51.13] ng/mL, age 62 [45–71] years; controls prostate-specific antigen 6.85 [2.4–10.87] ng/mL, age 65.5 [47–71] years). Readers had highest sensitivity on DWI (59%) vs T2W MRI (48%) and DCE (23%) in WP. DWI-only positivity (DWI+/T2W−/DCE−) achieved highest CDR in WP (38%), compared to T2W-only (CDR 24%) and DCE-only (CDR 8%). DWI+/T2W+/DCE− achieved CDR 80%, an added benefit of 56.4% from T2W-only and of 42% from DWI-only ( P < .0001). All three sequences interpreted independently positive gave highest CDR of 90%. Reader agreement was moderate (index of specific agreement: T2W = 54%, DWI = 58%, DCE = 33%).
Conclusions
When prostate mpMRI sequences are interpreted independently by multiple observers, DWI achieves highest sensitivity and CDR in transition zone and peripheral zone. T2W and DCE MRI both add value to detection; mpMRI achieves highest detection sensitivity when all three mpMRI sequences are positive.
Introduction
Prostate multiparametric magnetic resonance imaging (mpMRI) has become an established method for localizing clinically significant prostate cancer and for informing subsequent treatment planning decisions . The technique combines anatomical data from T2-weighted (T2W) magnetic resonance imaging (MRI) with functional data from diffusion-weighted imaging (DWI) and dynamic contrast-enhanced (DCE) MRI to provide up to 90% reported sensitivity in detection of significant disease . mpMRI interpretation inherently relies on findings across multiple sequence images; however, the degree to which each pulse sequence contributes to overall detection sensitivity remains unclear.
Perception of the contribution of each pulse sequence has evolved. Initial Prostate Imaging-Reporting and Data System (PI-RADS) guidelines for standardization of prostate MRI interpretation assumed equal diagnostic weight for each of the three sequences; whereas the current PI-RADS version 2 (PI-RADSv2) has weighted sequences differently depending on the lesion location within the prostate . The change was based on expert consensus and zone-focused data reflecting possibly optimal cancer detection in the transition zone (TZ) from T2W MRI sequences and in the peripheral zone (PZ) from DWI sequences . However, these studies, along with recent PI-RADSv2 validations, are almost always based on mpMRI evaluations using complete mpMRI sets . In this context, conclusions about the value of individual sequences in cancer detection are subject to innate reader bias as each sequence validates the other in the reader’s mind. Moreover, such studies are often based on a single institution’s experience. As a result, there is continued uncertainty about the true value of each mpMRI sequence in cancer detection. Therefore, the purpose of this work was to determine the independent contribution of each prostate mpMRI sequence to cancer detection when read in isolation.
Materials and Methods
Study Population
Get Radiology Tree app to read full this article<
Get Radiology Tree app to read full this article<
Study Design
Get Radiology Tree app to read full this article<
Get Radiology Tree app to read full this article<
Get Radiology Tree app to read full this article<
MRI Technique
Get Radiology Tree app to read full this article<
TABLE 1
Multiparametric MRI Acquisition Parameters Given for Prostate Imaging at 3-Tesla (3T) with Use of an Endorectal Coil.
Multiparametric MRI Sequence Parameters at 3T Parameter T2-Weighted DWI \* High b -Value DWI † DCE MRI ‡ Field of view (mm) 140 × 140 140 × 140 140 × 140 262 × 262 Acquisition Matrix 304 × 234 112 × 109 76 × 78 188 × 96 Repetition time (ms) 4434 4986 6987 3.7 Echo time (ms) 120 54 52 2.3 Flip angle (degrees) 90 90 90 8.5 Section thickness (mm), no gaps 3 3 3 3 Image reconstruction matrix (pixels) 512 × 512 256 × 256 256 × 256 256 × 256 Reconstruction voxel imaging resolution (mm/pixel) 0.27 × 0.27 × 3.00 0.55 × 0.55 × 2.73 0.55 × 0.55 × 2.73 1.02 × 1.02 × 3.00 Time for acquisition (min:s) 2:48 4:54 3:50 5:16
Sequences acquired include T2-weighted, diffusion-weighted imaging (DWI) that includes apparent diffusion coefficient map calculation, and a high b- value sequence, and dynamic contrast enhanced (DCE) magnetic resonance imaging (MRI).
Get Radiology Tree app to read full this article<
Get Radiology Tree app to read full this article<
Get Radiology Tree app to read full this article<
Get Radiology Tree app to read full this article<
MRI Interpretation
Get Radiology Tree app to read full this article<
Get Radiology Tree app to read full this article<
Pathology Correlation
Get Radiology Tree app to read full this article<
Statistical Analysis
Get Radiology Tree app to read full this article<
Get Radiology Tree app to read full this article<
Results
Patient and Lesion Characteristics
Get Radiology Tree app to read full this article<
Get Radiology Tree app to read full this article<
Reader-based Individual Sequence Sensitivity and Agreement
Get Radiology Tree app to read full this article<
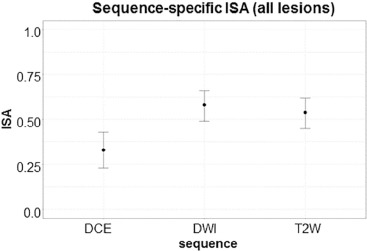
TABLE 2
Pairwise Inter-reader Specific Agreement (ISA) in the Whole Prostate. ISA Is Given for All Reader Combinations for Each Sequence Type
Readers 1–2 Readers 1–3 Readers 2–3 T2W 0.51 0.55 0.56 DWI 0.59 0.59 0.57 DCE 0.46 0.24 0.30
Get Radiology Tree app to read full this article<
Get Radiology Tree app to read full this article<
TABLE 3
Observed Number of True Positives for Each Reader, by Zone and within Each Sequence. Sensitivities Calculated for Figure 4 Were Derived From the Ratio of Number of True Positives to Number of Pathologically Confirmed Lesions (Condition True)
Reader-detected True Positives T2W DWI DCE Zone Number of Pathologically Confirmed Lesions R1 R2 R3 R1 R2 R3 R1 R2 R3 PZ 38 14 16 23 23 18 16 11 9 3 TZ 32 19 11 18 27 18 21 14 5 6 All 70 33 27 41 50 36 37 25 14 9
DCE, dynamic contrast-enhanced; DWI, diffusion-weighted imaging; PZ, peripheral zone; R, reader; T2W, T2-weighted; TZ, transition zone.
Get Radiology Tree app to read full this article<
Individual and Additive Value of MRI Sequences for Cancer Detection
Get Radiology Tree app to read full this article<
Get Radiology Tree app to read full this article<
Get Radiology Tree app to read full this article<
TABLE 4
Cancer Detection Rate Benefit (ΔCDR) in Whole Prostate (WP), Peripheral Zone (PZ), and Transition Zone (TZ).
WP PZ TZ Positive Sequence Combination Baseline Added Baseline CDR ΔCDR_P_ Value Baseline CDR ΔCDR_P_ value Baseline CDR ΔCDR_P_ Value T2W+/DWI+/DCE− T2W-only DWI+ 24.0% 56.4% <0.0001 24.6% 55.4% <0.0001 22.6% 58.2% <0.0001 DWI-only T2W+ 38.3% 42.0% <0.0001 35.6% 44.4% 0.0002 40.3% 40.4% 0.0003 T2W+/DWI−/DCE+ DCE-only T2W+ 7.7% 42.3% 0.03 8.7% 16.3% 0.38 5.9% 94.1% 0.005 T2W-only DCE+ 24.0% 26.0% 0.17 24.6% 0.4% 0.98 22.6% 77.4% 0.02 T2W−/DWI+/DCE+ DCE-only DWI+ 7.7% 59.0% <0.0001 8.7% 51.3% 0.001 5.9% 74.1% 0.0005 DWI-only DCE+ 38.3% 28.3% 0.03 35.6% 24.4% 0.16 40.3% 39.7% 0.09 T2W+/DWI+/DCE+ T2W+/DCE+ DWI+ 50.0% 40.0% 0.03 25.0% 59.6% 0.002 100.0% -5.9% 0.86 DWI+/DCE+ T2W+ 66.7% 23.3% 0.08 60.0% 24.6% 0.20 80.0% 14.1% 0.51 T2W+/DWI+ DCE+ 80.4% 9.6% 0.24 80.0% 4.6% 0.73 80.8% 13.3% 0.25
DCE, dynamic contrast-enhanced; DWI, diffusion-weighted imaging; T2W, T2-weighted.
ΔCDR is calculated as the difference in CDR between combinations of varying sequence positivity. Of note, CDRs for all sequence combinations are illustrated in Figure 5 . For example, the baseline CDR for T2W-only in WP is 24.0% and the combined CDR for T2W+/DWI+ in WP is 80.4%, giving a ΔCDR (DWI benefit to T2W-only) of 56.4% P < .0001.
Get Radiology Tree app to read full this article<
Get Radiology Tree app to read full this article<
Discussion
Get Radiology Tree app to read full this article<
Get Radiology Tree app to read full this article<
Get Radiology Tree app to read full this article<
Get Radiology Tree app to read full this article<
Get Radiology Tree app to read full this article<
Get Radiology Tree app to read full this article<
Get Radiology Tree app to read full this article<
Conclusions
Get Radiology Tree app to read full this article<
Acknowledgments
Get Radiology Tree app to read full this article<
Get Radiology Tree app to read full this article<
Get Radiology Tree app to read full this article<
References
1. Siddiqui M.M., Rais-Bahrami S., Turkbey B., et. al.: Comparison of MR/ultrasound fusion-guided biopsy with ultrasound-guided biopsy for the diagnosis of prostate cancer. JAMA 2015; 313: pp. 390-397.
2. Sciarra A., Barentsz J., Bjartell A., et. al.: Advances in magnetic resonance imaging: how they are changing the management of prostate cancer. Eur Urol 2011; 59: pp. 962-977.
3. Ahmed H.U., Kirkham A., Arya M., et. al.: Is it time to consider a role for MRI before prostate biopsy?. Nat Rev Clin Oncol 2009; 6: pp. 197-206.
4. Greer M.D., Brown A.M., Shih J.H., et. al.: Accuracy and agreement of PIRADSv2 for prostate cancer mpMRI: a multireader study. J Magn Reson Imaging 2016; 45: pp. 579-585.
5. Weinreb J.C., Barentsz J.O., Choyke P.L., et. al.: PI-RADS Prostate Imaging—Reporting and Data System: 2015, Version 2. Eur Urol 2016; 69: pp. 16-40.
6. Vache T., Bratan F., Mege-Lechevallier F., et. al.: Characterization of prostate lesions as benign or malignant at multiparametric MR imaging: comparison of three scoring systems in patients treated with radical prostatectomy. Radiology 2014; 272: pp. 446-455.
7. Akin O., Sala E., Moskowitz C.S., et. al.: Transition zone prostate cancers: features, detection, localization, and staging at endorectal MR imaging. Radiology 2006; 239: pp. 784-792.
8. Hoeks C.M., Hambrock T., Yakar D., et. al.: Transition zone prostate cancer: detection and localization with 3-T multiparametric MR imaging. Radiology 2013; 266: pp. 207-217.
9. Verma S., Rajesh A., Morales H., et. al.: Assessment of aggressiveness of prostate cancer: correlation of apparent diffusion coefficient with histologic grade after radical prostatectomy. AJR Am J Roentgenol 2011; 196: pp. 374-381.
10. Mertan F.V., Greer M.D., Shih J.H., et. al.: Prospective evaluation of the prostate imaging reporting and data system version 2 for prostate cancer detection. J Urol 2016; 196: pp. 690-696.
11. Vargas H.A., Hotker A.M., Goldman D.A., et. al.: Updated prostate imaging reporting and data system (PIRADS v2) recommendations for the detection of clinically significant prostate cancer using multiparametric MRI: critical evaluation using whole-mount pathology as standard of reference. Eur Radiol 2016; 26: pp. 1606-1612.
12. Junker D., Quentin M., Nagele U., et. al.: Evaluation of the PI-RADS scoring system for mpMRI of the prostate: a whole-mount step-section analysis. World J Urol 2015; 33: pp. 1023-1030.
13. Delongchamps N.B., Rouanne M., Flam T., et. al.: Multiparametric magnetic resonance imaging for the detection and localization of prostate cancer: combination of T2-weighted, dynamic contrast-enhanced and diffusion-weighted imaging. BJU Int 2011; 107: pp. 1411-1418.
14. Medixant : RadiAnt DICOM Viewer.2017.
15. Microsoft : Microsoft Access Professional Plus 2010.2010.
16. Shah V., Pohida T., Turkbey B., et. al.: A method for correlating in vivo prostate magnetic resonance imaging and histopathology using individualized magnetic resonance-based molds. Rev Sci Instrum 2009; 80: pp. 104301.
17. Kwak J.T., Sankineni S., Xu S., et. al.: Prostate cancer: a correlative study of multiparametric MR imaging and digital histopathology. Radiology 2017; 285: pp. 147-156.
18. De Visschere P., Lumen N., Ost P., et. al.: Dynamic contrast-enhanced imaging has limited added value over T2-weighted imaging and diffusion-weighted imaging when using PI-RADSv2 for diagnosis of clinically significant prostate cancer in patients with elevated PSA. Clin Radiol 2017; 72: pp. 23-32.
19. Wang X.Z., Wang B., Gao Z.Q., et. al.: Diffusion-weighted imaging of prostate cancer: correlation between apparent diffusion coefficient values and tumor proliferation. J Magn Reson Imaging 2009; 29: pp. 1360-1366.
20. Turkbey B., Shah V.P., Pang Y., et. al.: Is apparent diffusion coefficient associated with clinical risk scores for prostate cancers that are visible on 3-T MR images?. Radiology 2011; 258: pp. 488-495.
21. Tamada T., Sone T., Jo Y., et. al.: Apparent diffusion coefficient values in peripheral and transition zones of the prostate: comparison between normal and malignant prostatic tissues and correlation with histologic grade. J Magn Reson Imaging 2008; 28: pp. 720-726.
22. Hambrock T., Somford D.M., Huisman H.J., et. al.: Relationship between apparent diffusion coefficients at 3.0-T MR imaging and Gleason grade in peripheral zone prostate cancer. Radiology 2011; 259: pp. 453-461.
23. Rosenkrantz A.B., Parikh N., Kierans A.S., et. al.: Prostate cancer detection using computed very high b-value diffusion-weighted imaging: how high should we go?. Acad Radiol 2016; 23: pp. 704-711.
24. McNeal J.E.: Origin and evolution of benign prostatic enlargement. Invest Urol 1978; 15: pp. 340-345.
25. Xiaohang L., Bingni Z., Liangping Z., et. al.: Differentiation of prostate cancer and stromal hyperplasia in the transition zone with histogram analysis of the apparent diffusion coefficient. Acta Radiol 2017; 58: pp. 1528-1534.
26. Kim C.K., Park B.K., Han J.J., et. al.: Diffusion-weighted imaging of the prostate at 3 T for differentiation of malignant and benign tissue in transition and peripheral zones: preliminary results. J Comput Assist Tomogr 2007; 31: pp. 449-454.
27. Rosenkrantz A.B., Babb J.S., Taneja S.S., et. al.: Proposed adjustments to PI-RADS version 2 decision rules: impact on prostate cancer detection. Radiology 2017; 283: pp. 119-129.
28. Rud E., Baco E.: Re: Jeffrey C. Weinreb, Jelle O. Barentsz, Peter L. Choyke, et al. PI-RADS Prostate Imaging—Reporting and Data System: 2015, Version 2. Eur Urol 2016;69:16–40: is contrast-enhanced magnetic resonance imaging really necessary when searching for prostate cancer?. Eur Urol 2016; 70: pp. e136.
29. Barentsz J.O., Choyke P.L., Cornud F., et. al.: Reply to Erik Rud and Eduard Baco’s Letter to the Editor re: Re: Jeffrey C. Weinreb, Jelle O. Barentsz, Peter L. Choyke, et al. PI-RADS Prostate Imaging—Reporting and Data System: 2015, Version 2. Eur Urol 2016;69:16–40. Eur Urol 2016; 70: pp. e137-e138.
30. Scialpi M., Prosperi E., D’Andrea A., et. al.: Biparametric versus multiparametric MRI with non-endorectal coil at 3T in the detection and localization of prostate cancer. Anticancer Res 2017; 37: pp. 1263-1271.
31. Stanzione A., Imbriaco M., Cocozza S., et. al.: Biparametric 3T magentic resonance imaging for prostatic cancer detection in a biopsy-naive patient population: a further improvement of PI-RADS v2?. Eur J Radiol 2016; 85: pp. 2269-2274.
32. Mehralivand S., Bednarova S., Shih J.H., et. al.: Prospective evaluation of prostate imaging-reporting and data system version 2 using the international society of urological pathology prostate cancer grade group system. J Urol 2017; 198: pp. 583-590.
33. Polanec S., Helbich T.H., Bickel H., et. al.: Head-to-head comparison of PI-RADS v2 and PI-RADS v1. Eur J Radiol 2016; 85: pp. 1125-1131.