
Rationale and Objectives
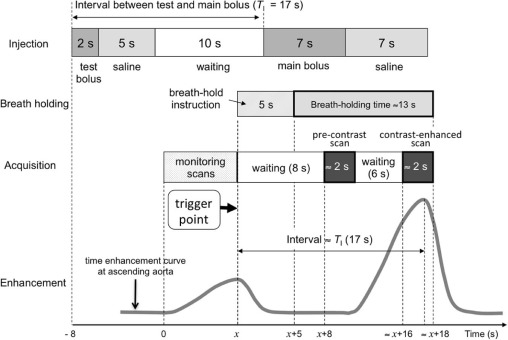
We have developed a new contrast enhancement protocol for subtraction coronary computed tomography (SCCTA) requiring a short breath-holding time. In the protocol, test and main boluses were sequentially and automatically injected, and correct timings for pre-contrast and contrast-enhanced scans for main bolus were automatically determined only by the test bolus tracking. Combined with a fixed short main bolus injection for 7 seconds, the breath-holding time was shortened as possible. The purpose of this study was to evaluate whether use of this new protocol produced adequate quality images, taking into account calcified lesions and in-stent lumens.
Materials and Methods
Patients ( n = 127) with calcium scores of >400 Agatston units or a history of stent placement were enrolled. Breath-holding times were recorded, and image quality was visually evaluated by two observers.
Results
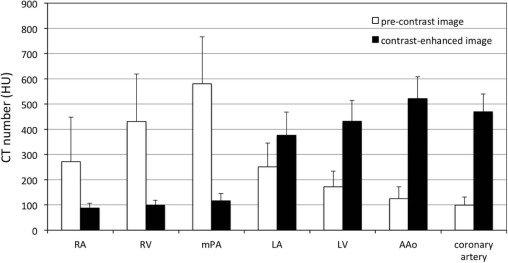
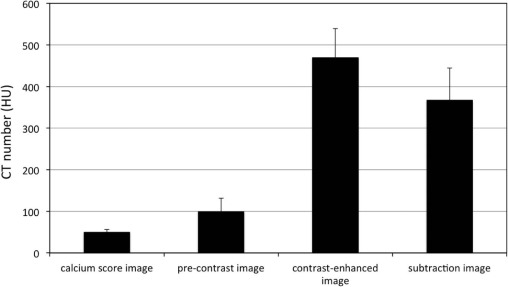
The mean ± standard deviation breath-holding time was 13.2 ± 0.6 seconds. The mean ± SD computed tomography (CT) number of coronary arteries for the pre-contrast scan was sufficiently low [99.2 ± 32.2 Hounsfield units (HU)] and, simultaneously, that for SCCTA was 367.0 ± 77.2 HU. The rate of segments evaluated as unreadable was sufficiently low (3.8%).
Conclusions
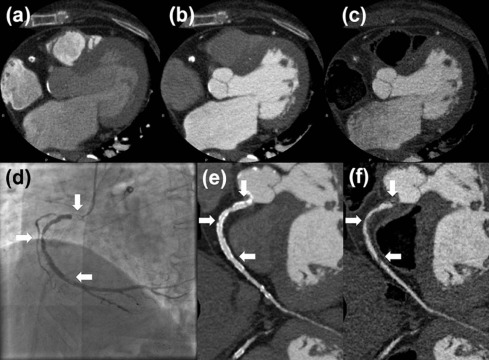
Use of the SCCTA protocol was efficient and allowed for a shorter breath-holding time and adequate diagnostic accuracy of SCCTA images, including images of calcified and stent implantation segments.
Introduction
Subtraction coronary computed tomography angiography (SCCTA) using a 320-detector row computed tomography (CT) scanner was recently developed. This effective method allows calcium to be subtracted from coronary computed tomography angiography (CCTA) images, providing improved diagnostic accuracy over conventional CCTA in patients with severe coronary artery calcification and stent . SCCTA uses two CCTA datasets collected pre-contrast and after contrast enhancement. Two types of acquisition protocols have been proposed to acquire the required datasets: the single breath-hold protocol and the two breath-hold protocol. A study by Yoshioka et al. reported that the image quality score using the single breath-hold method was significantly greater than that using the two breath-hold method. Moreover, Tanaka et al. indicated that compared to conventional CCTA, SCCTA performed with the single breath-hold method improved diagnostic accuracy, with SCCTA yielding a significantly reduced number of nondiagnostic segments. Although the breath-holding times (20–40 seconds) of this single breath-hold method has been shortened to approximately 18 seconds using the test bolus method, which enables the prediction of the peak enhancement time by evaluating the enhancement curve of the test bolus , the shortened breath-holding time remains to be problematic for some patients who cannot hold their breath for such a long time.
Furthermore, the operation of the test bolus method is complex and time-consuming as the operator has to run an independent scan plan for monitoring scans, evaluate the peak enhancement time, and then set the time parameter for the main bolus scan plan.
Get Radiology Tree app to read full this article<
Materials and Methods
Contrast Enhancement and Scanning Techniques
Get Radiology Tree app to read full this article<
Get Radiology Tree app to read full this article<
Get Radiology Tree app to read full this article<
Get Radiology Tree app to read full this article<
Get Radiology Tree app to read full this article<
Get Radiology Tree app to read full this article<
CCTA
Get Radiology Tree app to read full this article<
Patient Population and Study Protocol
Get Radiology Tree app to read full this article<
Coronary Calcium Scoring
Get Radiology Tree app to read full this article<
Coronary Subtraction
Get Radiology Tree app to read full this article<
Image Analysis
Get Radiology Tree app to read full this article<
Get Radiology Tree app to read full this article<
Statistical Analysis
Get Radiology Tree app to read full this article<
Results
Get Radiology Tree app to read full this article<
TABLE 1
Patient Characteristics ( N = 127)
Parameter Value Age, y Mean ± SD (range) 68.3 ± 10(37–86) Sex, n (%) Males 97(76.4) Females 30(23.6) Body, mean ± SD Length (cm) 162.4 ± 7.9 Weight (kg) 65.1 ± 11 Body mass index 24.6 ± 3.1 Coronary risk factors, n (%) Hypertension 94(74.0) Diabetes 55(43.3) Hypercholesterolemia 75(59.1) Smoking 47(37.0) Previous myocardial infarction 40(31.5) Previous PCI 93(73.2) Use of beta-blocker, n (%) Propranolol 18(14.2) Landiolol 78(61.4) Coronary calcium score Mean ± SD (range) 1524.4 ± 1641.0(431–6719) Pre-contrast CCTA HR, beats/min Mean ± SD (range) 53.8 ± 4.6(39–64) Contrast-enhanced CCTA HR, beat/min Mean ± SD (range) 53.7 ± 4.4(40–64) CCTA estimated effective radiation dose (sum of pre-contrast and contrast-enhanced), mSv Mean ± SD (range) 5.57 ± 1.32(1.90–9.43)
CCTA, coronary computed tomography angiography; HR, heart rate; PCI, percutaneous coronary intervention; SD, standard deviation.
Get Radiology Tree app to read full this article<
Get Radiology Tree app to read full this article<
Get Radiology Tree app to read full this article<
Get Radiology Tree app to read full this article<
TABLE 2
Image Quality Scores and Percentage of Segments with Readable Versus Unreadable Image Quality
Measure Conventional CCTA Subtraction CCTA_P_ value Image quality score (all) Mean ± SD 2.5 ± 1.0 3.6 ± 0.6 <.001 Inter-observer kappa score (95% CI) 0.880(0.842–0.915) 0.906(0.860–0.945) Segment percentage Readable image quality 49.1% 96.2% <.001 Unreadable image quality 50.9% 3.8% Image quality score Calcified segment 2.4 ± 1.0 3.6 ± 0.5 <.001 Stent implantation segment 2.6 ± 1.1 3.6 ± 0.6 <.001
CCTA, coronary computed tomography angiography; CI, confidence interval; SD, standard deviation.
Get Radiology Tree app to read full this article<
Discussion
Get Radiology Tree app to read full this article<
Get Radiology Tree app to read full this article<
Get Radiology Tree app to read full this article<
Get Radiology Tree app to read full this article<
Get Radiology Tree app to read full this article<
References
1. Yoshioka K., Tanaka R., Muranaka K.: Subtraction coronary CT angiography for calcified lesions. Cardiol Clin 2012; 30: pp. 93-102.
2. Tanaka R., Yoshioka K., Muranaka K., et. al.: Improved evaluation of calcified segments on coronary CT angiography: a feasibility study of coronary calcium subtraction. Int J Cardiovasc Imaging 2013; 29: pp. 75-81.
3. Yoshioka K., Tanaka R., Muranaka K., et. al.: Subtraction coronary CT angiography using second-generation 320-detector row CT. Int J Cardiovasc Imaging 2015; 31: pp. 51-58.
4. Fuchs A., Kuhl J.T., Chen M.Y., et. al.: Feasibility of coronary calcium and stent image subtraction using 320-detector row CT angiography. J Cardiovasc Comput Tomogr 2015; 9: pp. 393-398.
5. Amanuma M., Kondo T., Sano T., et. al.: Subtraction coronary computed tomography in patients with severe calcification. Int J Cardiovasc Imaging 2015; 31: pp. 1635-1642.
6. Viladés Medel D., Leta R., Alomar Serralach X., et. al.: Reliability of a new method for coronary artery calcium or metal subtraction by 320-row cardiac CT. Eur Radiol 2016; 26: pp. 3208-3214. Epub 2015 Dec 10
7. Amanuma M., Kondo T., Sano T., et. al.: Assessment of coronary in-stent restenosis: value of subtraction coronary computed tomography angiography. Int J Cardiovasc Imaging 2016; 32: pp. 661-670.
8. Kidoh M., Utsunomiya D., Oda S., et. al.: Optimized subtraction coronary CT angiography protocol for clinical use with short breath-holding time-initial experience. Acad Radiol 2015; 22: pp. 117-120.
9. Bae K.T.: Peak contrast enhancement in CT and MR angiography: when does it occur and why? Pharmacokinetic study in a porcine model. Radiology 2003; 227: pp. 809-816.
10. Bae K.T.: Intravenous contrast medium administration and scan timing at CT: considerations and approaches. Radiology 2010; 256: pp. 32-61.
11. McCollough C.H., Primak A.N., Braun N., et. al.: Strategies for reducing radiation dose in CT. Radiol Clin North Am 2009; 47: pp. 27-40.
12. Austen W.G., Edwards J.E., Frye R.L., et. al.: A reporting system on patients evaluated for coronary artery disease. Report of the Ad Hoc Committee for Grading of Coronary Artery Disease, Council on Cardiovascular Surgery, American Heart Association. Circulation 1975; 51: pp. 5-40.
13. Maintz D., Burg M.C., Seifarth H., et. al.: Update on multidetector coronary CT angiography of coronary stents: in vitro evaluation of 29 different stent types with dual-source CT. Eur Radiol 2009; 19: pp. 42-49.