
Rationale and Objectives
Cardiac computed tomography (CT) has emerged as a robust modality for imaging coronary stenosis and has recently been used to evaluate myocardial abnormalities such as ischemic perfusion defects and infarction. We developed a new image analysis algorithm for the semiautomatic and quantitative assessment of myocardial perfusion by CT.
Materials and Methods
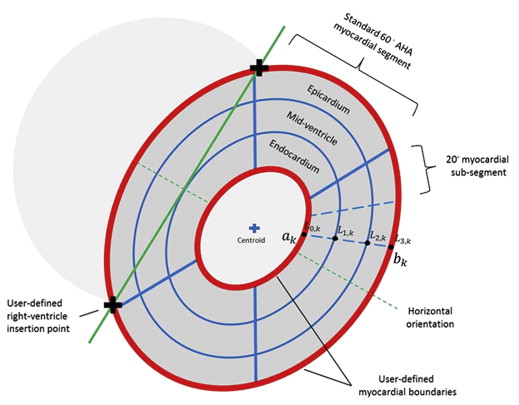
The algorithm semiautomatically segments two-dimensional short-axis reformatted DICOM images of the left ventricle into regions of interest (ROIs) in accordance with American Heart Association (AHA) standards and is capable of creating nine further ROI subsegments. This includes separate endocardial, mid-ventricle, and epicardial layers. Image intensity values (Hounsfield unit) and relative myocardial thickness are quantitatively reported for each ROI and segment.
Results
The algorithm allows comparison of the HU values at the same ROI locations between rest and stress. The reproducibility is very good; ICC 0.89 for rest images, 0.83 for stress images. The mean time for generating ROIs for the entire heart was 11 minutes versus 22 minutes for manual tracing.
Conclusion
The algorithm reports parameters relevant for evaluation of stress perfusion CT studies and will allow more accurate and reproducible analysis in cardiac CT research.
Coronary artery disease (CAD) remains the leading cause of death in the developed world . Coronary atherosclerotic plaque progressively narrows the coronary arteries, potentially leading to impaired myocardial perfusion, myocardial dysfunction, and subsequent myocardial infarction. The investigation of CAD often involves the functional assessment of stenosis severity by means of noninvasive imaging stress tests using nuclear scintigraphy, echocardiography, or cardiac magnetic resonance imaging (MRI). A flow-limiting stenosis in a coronary artery usually results in a relative deficit in myocardial perfusion (via first-pass imaging nuclear radiotracers or intravenous contrast boluses) or systolic function (wall motion) in the supplied myocardial territory between the stress and rest imaging. Myocardial stress computed tomography (CT) perfusion (CTP) is a recently described technique that uses cardiac CT to perform stress and rest first-pass perfusion imaging, simultaneously allowing imaging of anatomical coronary stenosis as well as resultant perfusion abnormalities .
The evaluation of left ventricular function and myocardial perfusion defects by noninvasive imaging modalities has largely followed the American Heart Association (AHA) 17 segment model of the heart . Determination of myocardial perfusion defects on most imaging modalities including CT are usually performed by visual comparison of the relative intensity of the myocardium between rest and stress phases. Automatic quantitative processes that compare the rest and stress phases on a segmental basis could potentially be more efficient, accurate, and reproducible in determining areas of ischemia. Such software has been reported in nuclear myocardial perfusion imaging, cardiac MRI, and, in a proprietary algorithm, in CTP .
Get Radiology Tree app to read full this article<
 Open full size image
Figure 1
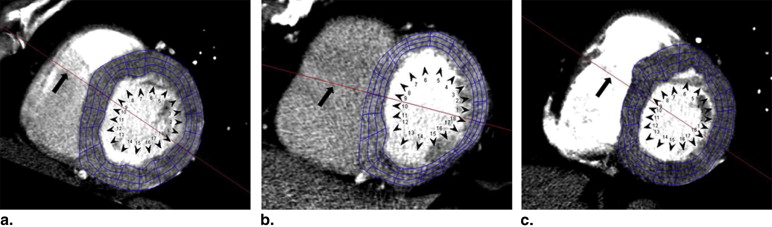
Basal short-axis slice of the heart showing the standard American Heart Association (AHA) segmentation ( red lines ). Manually drawn regions of interest (ROIs, numbered 1–6) are positioned carefully with the results displayed. There is a perfusion defect of the endocardial inferolateral wall (ROI #1) with a Hounsfield unit (HU) of 51. The epicardium is relatively normal (ROI #3) with an HU of 78. However, there is potential for error because the ROI may not be drawn in the same position between rest and stress phases. Similarly, another user will probably place ROIs in slightly different positions within the same AHA segment, which may yield a vastly different HU. LV, left ventricle; RV, right ventricle. (Color version of figure is available online).
Get Radiology Tree app to read full this article<
Materials and methods
Get Radiology Tree app to read full this article<
Get Radiology Tree app to read full this article<
Get Radiology Tree app to read full this article<
Get Radiology Tree app to read full this article<
Get Radiology Tree app to read full this article<
Dk=∣∣∣bk→−ak→∣∣∣,fork=1,…,n D
k
=
|
b
k
→
−
a
k
→
|
,
f
o
r
k
=
1
,
…
,
n
where n is the number of angles. To establish the endocardial, mid-ventricular, and epicardial layers, the myocardial thickness is divided into three equal layers having thickness of Dk/3 D
k
/
3 . Points establishing the boundary of these layers along the k -th line is calculated as:
L→i,k=aˆk[∣∣a→k∣∣+i3Dk],fori=0,1,2,3 L
→
i
,
k
=
a
ˆ
k
[
|
a
→
k
|
+
i
3
D
k
]
,
f
o
r
i
=
0
,
1
,
2
,
3
where aˆk a
ˆ
k is the unit vector representing the direction of the k -th line. As shown in Figure 2 , the thickness of the endocardial layer along the k -th line is represented as the region between L→0,k L
→
0
,
k and L→1,k L
→
1
,
k . The thickness of the mid-ventricular layer along the k -th line is represented as the region between L→1,k L
→
1
,
k and L→2,k L
→
2
,
k . The thickness of the epicardial layer along the k -th line is represented as the region between L→2,k L
→
2
,
k and L→3,k L
→
3
,
k .
Get Radiology Tree app to read full this article<
Get Radiology Tree app to read full this article<
Get Radiology Tree app to read full this article<
Get Radiology Tree app to read full this article<
Results
Get Radiology Tree app to read full this article<
Get Radiology Tree app to read full this article<
Get Radiology Tree app to read full this article<
Get Radiology Tree app to read full this article<
Get Radiology Tree app to read full this article<
Discussion
Get Radiology Tree app to read full this article<
Get Radiology Tree app to read full this article<
Get Radiology Tree app to read full this article<
Get Radiology Tree app to read full this article<
Get Radiology Tree app to read full this article<
Get Radiology Tree app to read full this article<
Conclusion
Get Radiology Tree app to read full this article<
Get Radiology Tree app to read full this article<
References
1. Heron M., Hoyert D.L., Murphy S.L., et. al.: Deaths: final data for 2006. Natl Vital Stat Rep 2009; 57: pp. 1-134.
2. Blankstein R., Shturman L.D., Rogers I.S., et. al.: Adenosine-induced stress myocardial perfusion imaging using dual-source cardiac computed tomography. J Am Coll Cardiol 2009; 54: pp. 1072-1084.
3. George R.T., Arbab-Zadeh A., Miller J.M., et. al.: Adenosine stress 64- and 256-row detector computed tomography angiography and perfusion imaging: a pilot study evaluating the transmural extent of perfusion abnormalities to predict atherosclerosis causing myocardial ischemia. Circ Cardiovasc Imaging 2009; 2: pp. 174-182.
4. Cerqueira M.D., Weissman N.J., Dilsizian V., et. al.: Standardized myocardial segmentation and nomenclature for tomographic imaging of the heart: a statement for healthcare professionals from the Cardiac Imaging Committee of the Council on Clinical Cardiology of the American Heart Association. Circulation 2002; 105: pp. 539-542.
5. Slomka P.J., Nishina H., Berman D.S., et. al.: Automatic quantification of myocardial perfusion stress-rest change: a new measure of ischemia. J Nucl Med 2004; 45: pp. 183-191.
6. Xu Y., Hayes S., Ali I., et. al.: Automatic and visual reproducibility of perfusion and function measures for myocardial perfusion SPECT. J Nucl Cardiology 2010; 17: pp. 1050-1057.
7. Delzescaux T., Frouin F., de Cesare A., et. al.: Using an adaptive semiautomated self-evaluated registration technique to analyze MRI data for myocardial perfusion assessment. J Magnetic Reson Imaging 2003; 18: pp. 681-690.
8. Achenbach S.: Stress computed tomography myocardial perfusion: steps, questions, and layers. J Am Coll Cardiol 2009; 54: pp. 1085-1087.
9. Hoffman J.I.: Transmural myocardial perfusion. Prog Cardiovasc Dis 1987; 29: pp. 429-464.
10. Kim R.J., Wu E., Rafael A., et. al.: The use of contrast-enhanced magnetic resonance imaging to identify reversible myocardial dysfunction. New Engl J Med 2000; 343: pp. 1445-1453.