
Rationale and Objectives
An analysis for the optimum selection of image features in feature domain to represent lung nodules was performed, with implementation into a classification module of a computer-aided diagnosis system.
Materials and Methods
Forty-two regions of interest obtained from 38 cases with effective diameters of 3 to 8.5 mm were used. On the basis of image characteristics and dimensionality, 11 features were computed. Nonparametric correlation coefficients, multiple regression analysis, and principal-component analysis were used to map the relation between the represented features from four radiologists and the computed features. An artificial neural network was used for the classification of benign and malignant nodules to test the hypothesis obtained from the mapping analysis.
Results
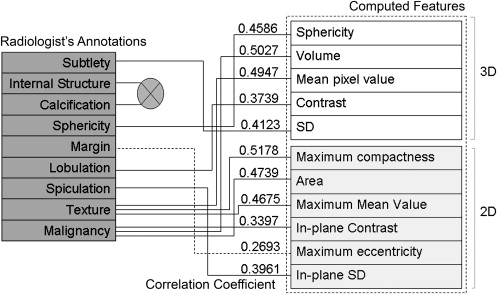
Correlation coefficients ranging from 0.2693 to 0.5178 were obtained between the radiologists’ annotations and the computed features. Of the 11 features used, three were found to be redundant when both nodule and non-nodule cases were used, and five were found redundant when nodule or non-nodule cases were used. Combination of analysis from correlation coefficients, regression analysis, principal-component analysis, and the artificial neural network resulted in the selection of optimum features to achieve F -test values of 0.821 and 0.643 for malignant and benign nodules, respectively.
Conclusion
This study demonstrates that for the optimum selection of features, each feature should be analyzed individually and collectively to evaluate the impact on the computer-aided diagnosis system on the basis of its class representation. This methodology will ultimately aid in improving the generalization capability of a classification module for early lung cancer diagnosis.
Computer-aided diagnosis (CAD) for thoracic computed tomographic imaging to detect lung nodules plays a vital role in early cancer diagnosis and thus aids in reducing the mortality rate significantly . The most crucial stage in any CAD system is the final classification module, which differentiates malignant lesions from benign lesions using their inherent image characteristics. The input to such a classification module is a set of image features that represent the nodule characteristics. These characteristic features are extracted using a mathematical approach that simulates the human representation of nodule properties.
The Fleischner Society defines a lung nodule from two perspectives. As seen by a pathologist, it is a “small, approximately spherical, circumscribed focus of abnormal tissue,” and for a radiologist, it is “a round opacity, at least moderately well marginated and no greater than 3cm in maximum diameter.” Non-nodules have a visual presentation that is very similar to nodules but are not cancerous. The assessments of nodule characteristics done by radiologists and pathologists differ from that of the image-processing perspective . However, because the image features calculated within a CAD system are motivated largely by a radiologist’s perspective, there exists an inherent correlation between human visualization and the mathematical approach to feature characterization.
Get Radiology Tree app to read full this article<
Get Radiology Tree app to read full this article<
 Open full size image
Figure 1
Proposed identification process flowchart. CT, computed tomographic; ROI, region of interest.
Get Radiology Tree app to read full this article<
Materials and methods
Database
Get Radiology Tree app to read full this article<
Get Radiology Tree app to read full this article<
Nodule Segmentation
Get Radiology Tree app to read full this article<
Get Radiology Tree app to read full this article<
Nodule Characteristics
Get Radiology Tree app to read full this article<
Table 1
Radiologist’s Annotations Used by the Lung Imaging Database Consortium
Feature Description Scale 1 Subtlety Radiologist-assessed subtlety of nodule 1 = extremely subtle, 5 = obvious 2 Internal structure Radiologist-assessed internal structure score of nodule 1 = soft tissue, 2 = fluid, 3 = fat, 4 = air 3 Calcification Radiologist-assessed of internal calcification of nodule 1 = popcorn, 2 = laminated, 3 = solid, 4 = noncentral, 5 = central, 6 = absent 4 Sphericity Radiologist-assessed shape of nodule in terms of its roundness/sphericity, with only three terms defined 1 = linear, 3 = ovoid, 5 = round 5 Margin Radiologist-assessed margin of nodule, with only the extreme values explicitly defined 1 = poorly defined, 5 = sharp 6 Lobulation Radiologist-assessed nodule lobulation, with only the extreme values explicitly defined 1 = marked, 5 = no lobulation 7 Spiculation Radiologist-assessed nodule spiculation, with only the extreme values explicitly defined 1 = marked (marked spiculation), 5 = no spiculation (no spiculation) 8 Texture Radiologist-assessed nodule internal texture, with only three terms defined 1 = nonsolid/ground class opacity, 3 = part solid/mixed, 5 = solid texture 9 Malignancy Radiologist subjective assessment of likelihood of malignancy of this nodule (assuming 60-year-old male smoker) 1 = highly unlikely for cancer, 2 = moderately unlikely for cancer, 3 = indeterminate likelihood, 4 = moderately suspicious for cancer, 5 = highly suspicious for cancer
Get Radiology Tree app to read full this article<
Get Radiology Tree app to read full this article<
Get Radiology Tree app to read full this article<
Table 2
Classification of Image Features Used in the Project
Shape Size Intensity Texture Sphericity (3D) Volume (3D) Mean pixel value (3D) Contrast (3D) Maximum compactness (2D) Area (2D) SD (3D) In-plane contrast (2D) Maximum eccentricity (2D) Maximum mean pixel value (2D) In-plane SD (2D)
SD, standard deviation; 3D, three-dimensional; 2D, two-dimensional.
Get Radiology Tree app to read full this article<
Correlation Analysis
Get Radiology Tree app to read full this article<
Parametric Versus Nonparametric
Get Radiology Tree app to read full this article<
Table 3
Shapiro-Wilk Hypothesis Test for Normality of the Data
Features_P_ Test ( P < .05) Shapiro-Wilk Test Statistic ( W ) Volume .6103 0 0.9575 Sphericity .1006 0 0.9266 Mean .0000 1 0.6723 SD .1985 0 0.9381 Contrast .0000 1 0.6687 Area .0000 1 0.6471 Compactness .6468 0 0.9586 Maximum mean .1422 0 0.9324 Maximum contrast .0859 0 0.9235 Maximum SD .0000 1 0.6608 Eccentricity .0000 1 0.7093
SD, standard deviation.
Table 4
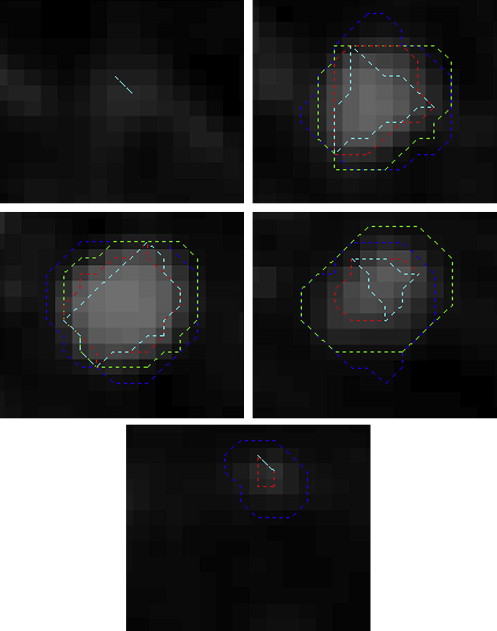
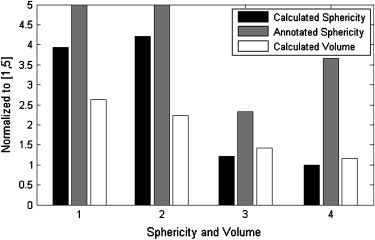
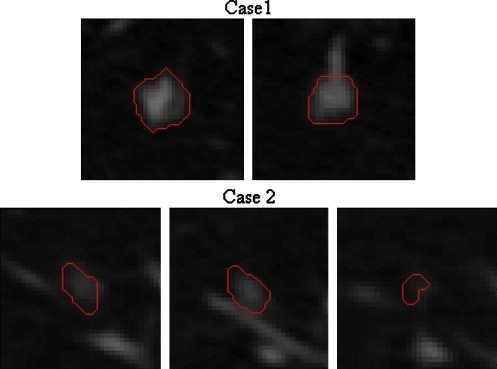
Sphericity Measurements for Figure 5
Sphericity Case Radiologist Calculated 1 3 0.1759 2 5 0.1797
Table 5
Redundant Features From Principal-Component Analysis
Category Variation Threshold Number of Redundant Features Nodule 2% 5 Non-nodule 2% 5 Both nodule and non-nodule 2% 3 Radiologist 2% 4
Table 6
Classification Results of Three and Two Dimensions and Combined Features
Correctly Classified Incorrectly Classified_F_ (nodule)F (non-nodule) 3D 76.1905 23.8095 0.828 0.615 2D 78.5714 21.4286 0.847 0.64 3D and 2D 69.0476 30.9524 0.787 0.435
3D, three-dimensional; 2D, two-dimensional.
Table 7
Classification Using All Features Except Maximum Eccentricity
Correctly Classified Incorrectly Classified_F_ (nodule)F (non-nodule) Correlation with Radiologist All but maximum eccentricity 69.0476 30.9524 0.787 0.435 0.2693
Table 8
F -Test Results for Various Features
Features_F_ (nodule)F (non-nodule) Correlation with Radiologist All computed features 0.8 0.5 N/A Volume 0.8 0 0.5027 Contrast 0.8 0 0.3739 Compactness 0.765 0 0.5178 Sphericity 0.75 0.5 0.4586 Area 0.831 0.421 0.4739 Maximum contrast 0.767 0.417 0.3397 Maximum eccentricity 0.733 0.333 0.2693 Mean 0.698 0.095 0.4947 SD 0.698 0.095 0.4123 Maximum mean 0.698 0.095 0.4675 Maximum SD 0.738 0.105 0.3961 Sphericity, area, maximum contrast, maximum eccentricity 0.821 0.643 N/A Volume, compactness, contrast 0.781 0.3 N/A
N/A, not available; SD, standard deviation.
Table 9
F -Test Results Using All Features Except Those Mentioned in the Table
All Features Excluding_F_ (nodule)F (non-nodule) Volume 0.8 0.5 Sphericity 0.814 0.56 Mean 0.822 0.522 SD 0.759 0.462 Contrast 0.793 0.538 Area 0.833 0.583 Compactness 0.8 0.5 Maximum mean 0.8 0.5 Maximum contrast 0.833 0.583 Maximum eccentricity 0.787 0.435 Maximum SD 0.759 0.462
SD, standard deviation.
Get Radiology Tree app to read full this article<
Multiple Regression Analysis
Get Radiology Tree app to read full this article<
Classification
Get Radiology Tree app to read full this article<
Get Radiology Tree app to read full this article<
Get Radiology Tree app to read full this article<
Knowledge Base
Get Radiology Tree app to read full this article<
Get Radiology Tree app to read full this article<
Results
Get Radiology Tree app to read full this article<
Get Radiology Tree app to read full this article<
Get Radiology Tree app to read full this article<
Get Radiology Tree app to read full this article<
Get Radiology Tree app to read full this article<
Get Radiology Tree app to read full this article<
Discussion
Get Radiology Tree app to read full this article<
Get Radiology Tree app to read full this article<
Get Radiology Tree app to read full this article<
Get Radiology Tree app to read full this article<
Get Radiology Tree app to read full this article<
Get Radiology Tree app to read full this article<
Get Radiology Tree app to read full this article<
Get Radiology Tree app to read full this article<
Get Radiology Tree app to read full this article<
References
1. Sluimer I., Schilham A., Prokop M., et. al.: Computer analysis of computed tomography scans of the lung: a survey. IEEE Trans Med Imaging 2006; 25: pp. 385-405.
2. Austin J.H., Müller N., Friedman P.J., et. al.: Glossary of terms for CT of the lungs: recommendations of the nomenclature committee of the Fleischner Society. Radiology 1996; 200: pp. 327-331.
3. Raicu D.S., Varutbangkul E., Cisneros J.G., et. al.: Semantics and image content integration for pulmonary nodule interpretation in thoracic computed tomography. Proc SPIE Int Soc Opt Eng 2007; 8: 65120S.1–65120S.12
4. Armato S.G., Li F., Giger M.L., et. al.: Lung cancer: performance of automated lung nodule detection applied to cancers missed in a CT screening program. Radiology 2002; 225: pp. 685-692.
5. Brown M.S., Goldin J.G., Suh R.D., et. al.: Lung micronodules: automated method for detection at thin-section CT—initial experience. Radiology 2003; 226: pp. 256-262.
6. Lee Y., Hara T., Fujita H., et. al.: Automated detection of pulmonary nodules in helical CT images based on an improved template-matching technique. IEEE Trans Med Imaging 2001; 20: pp. 595-604.
7. Tong J., Da-Zhe Z., Jin-Zhu Y., et. al.: Automated detection of pulmonary nodules in HRCT images. In2007.IEEENew York 833–836
8. Armato S.G., Giger M.L., Moran C.J., et. al.: Computerized detection of pulmonary nodules on CT scans. RadioGraphics 1999; 19: pp. 1303-1311.
9. McNitt-Gray M.F., Wyckoff N., Sayre J.W., et. al.: The effects of co-occurrence matrix based texture parameters on the classification of solitary pulmonary nodules imaged on computed tomography. Comput Med Imag Graphics 1999; 23: pp. 339-348.
10. Aoyama M., Li Q., Katsuragawa S., et. al.: Computerized scheme for determination of the likelihood measure of malignancy for pulmonary nodules on low-dose CT images. Med Phys 2003; 30: pp. 387-394.
11. Clarke L.P., Croft B.Y., Staab E., et. al.: National Cancer Institute initiative: lung image database resource for imaging research. Acad Radiol 2001; 8: pp. 447-450.
12. Armato S.G., McLennan G., McNitt-Gray M.F.: Lung Image Database Consortium: developing a resource for the medical imaging research community. Radiology 2004; 232: pp. 739-748.
13. McNitt-Gray M.F., Armato S.G., Meyer C.R.: The Lung Image Database Consortium (LIDC) data collection process for nodule detection and annotation. Acad Radiol 2007; 14: pp. 1464-1474.
14. Qian W., Li L.H., Clarke L.P.: Image feature extraction for mass detection using digital mammography: influence of wavelet analysis. Med Phys 1999; 26: pp. 402-408.
15. Qian W., Sun X.J., Song D.S., et. al.: Digital mammography: wavelet transform and Kalman filtering neural network in mass segmentation and detection. Acad Radiol 2001; 11: pp. 1074-1082.
16. Qian W., Lei M., Song D.S., et. al.: Computer aided mass detection based on ipsilateral multi-view mammograms. Acad Radiol 2007; 14: pp. 530-538.
17. Fukunaga K.: Introduction to statistical pattern recognition.1990.Academic PressLondon
18. Suzuki K., Feng Li, Sone S., et. al.: Computer-aided diagnostic scheme for distinction between benign and malignant nodules in thoracic low-dose CT by use of massive training artificial neural network. IEEE Trans Med Imaging 2005; 24: pp. 1138-1150.
19. Qian W., Zhukov T.A., Song D.S., et. al.: Computerized analysis of cellular features and biomarkers for cytologic diagnosis of early lung cancer. Anal Quant Cytol Histol 2007; 10: pp. 18-28.
20. Dodd L.E., Wagner R.F.: Armato SG III. Assessment methodologies and statistical issues for computer-aided diagnosis of lung nodules in computed tomography: contemporary research topics relevant to the Lung Image Database Consortium. Acad Radiol 2004; 11: pp. 462-475.
21. Meyer C.R., Johnson T.D., McLennan G.: Evaluation of lung MDCT nodule annotation across radiologists and methods. Acad Radiol 2006; 13: pp. 1254-1265.
22. Armato S.G., McNitt-Gray M.F., Reeves A.P.: The Lung Image Database Consortium (LIDC): an evaluation of radiologist variability in the identification of lung nodules on CT scans. Acad Radiol 2007; 14: pp. 1409-1421.
23. Land W.L., McKee D.W., Zhukov T., Qian W.: A kernelised fuzzy-support vector machine CAD system for the diagnosis of lung cancer from tissue images. Int J Funct Informat Pers Med 2008; 1: pp. 26-42.
24. Bennett K.P., Mangasarian O.L.: Robust linear programming discrimination of two linearly inseparable sets. Optim Methods Softw 1992; 1: pp. 23-34.
25. Mangasarian O.L.: Mathematical programming in data mining. Data Min Knowl Discov 1997; 42: pp. 183-201.