
Rationale and Objectives
Multimodal imaging techniques for capturing normal and diseased human anatomy and physiology are being developed to benefit patient clinical care, research, and education. In the past, the incorporation of histopathology into these multimodal datasets has been complicated by the large differences in image quality, content, and spatial association.
Materials and Methods
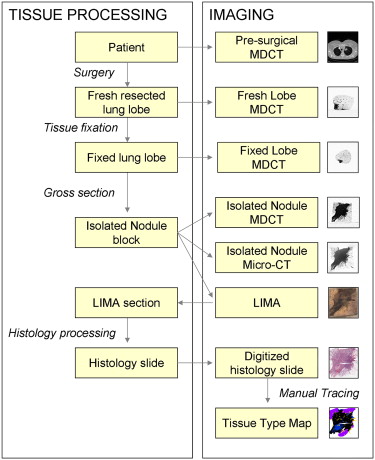
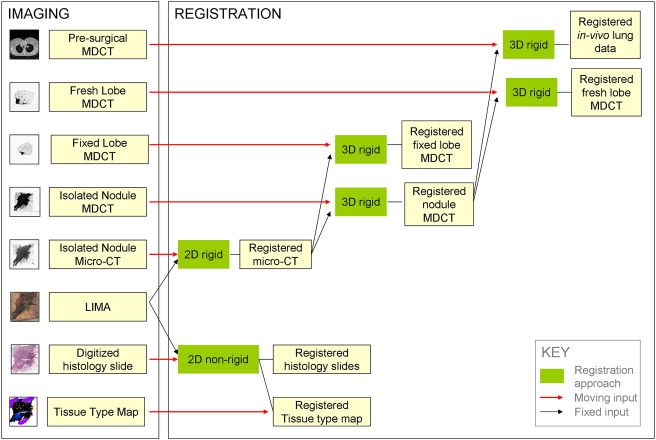
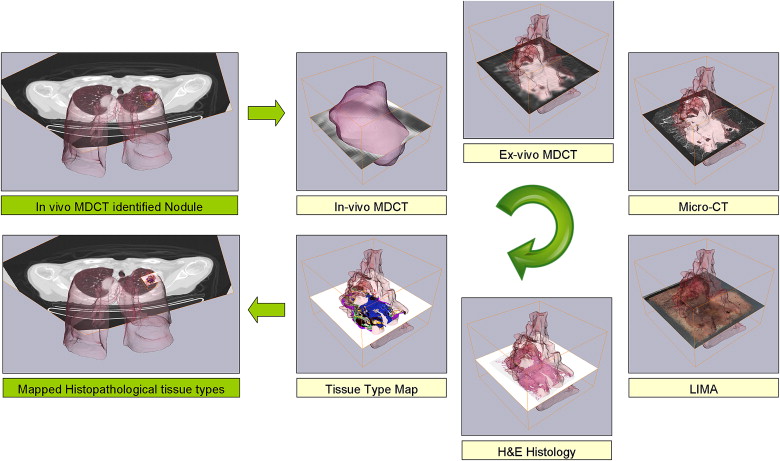
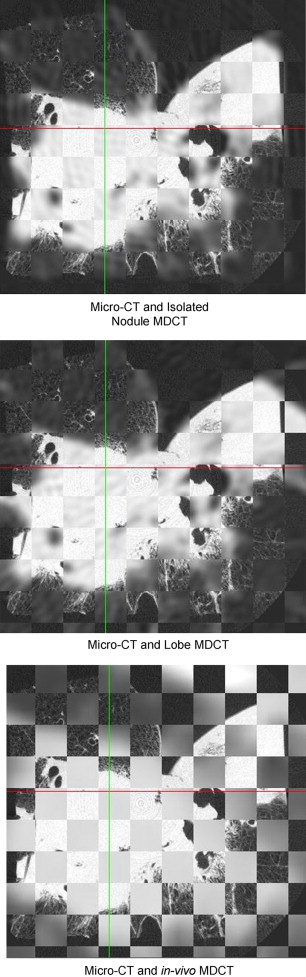
We have developed a novel system, the large-scale image microtome array (LIMA), to bridge the gap between nonstructurally destructive and destructive imaging such that reliable registration between radiological data and histopathology can be achieved. Registration algorithms have been designed to align the multimodal datasets, which include computed tomography, computed micro-tomography, LIMA, and histopathology data to a common coordinate system.
Results
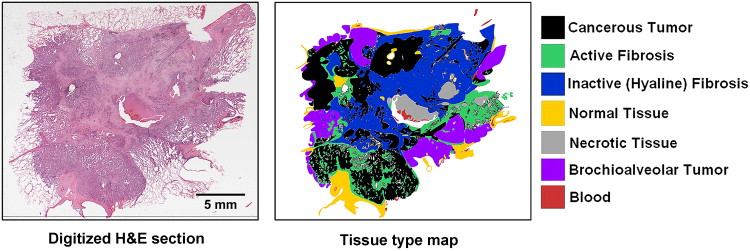
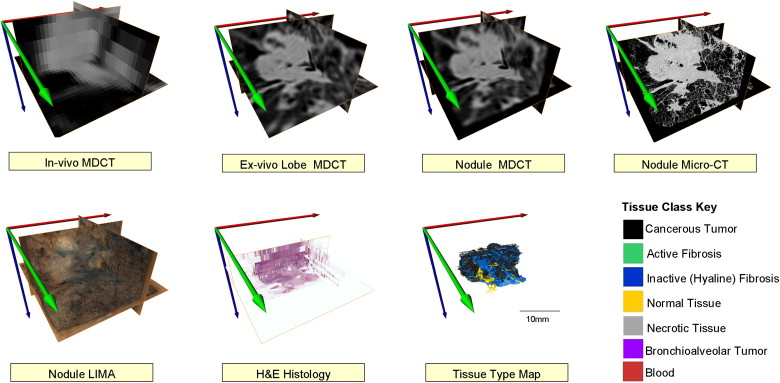
The resulting volumetric dataset provides an abundance of valuable information relating to the tissue sample including density, anatomical structure, color, texture, and cellular information in three dimensions. An image processing pipeline has been established to register all the multimodal data to a common coordinate system.
Conclusion
In this study, we have chosen to use human lung cancer nodules as an example; however, the flexibility of the image acquisition and subsequent processing algorithms makes it applicable to any soft organ tissue. A novel process model has been established to generate cross registered multimodal datasets for the investigation of human lung cancer nodule content and associated image-based representation.
The development of multimodal image acquisition and analysis continues to progress rapidly, driven by the potential to improve diagnostic and therapeutic aspects of medical care. Multimodal imaging, such as the combination of computed tomography (CT) and positron emission tomography, have been shown to improve the ability to identify potential disease states, such as lung nodules, and facilitate the planning of effective treatment approaches ( . However, the diagnostic “gold standard” in solid tumor oncology remains histological examination of diseased tissue, which requires invasive tissue sampling.
To understand and exploit all the information captured in noninvasive imaging techniques, accurate registration between the histological truth and the corresponding radiological appearance is required. This is complicated to achieve, because of the large differences in image quality, content, and loss of spatial association. Datasets that incorporate the corresponding histological truth are required to effectively evaluate the diagnostic ability of these systems.
Get Radiology Tree app to read full this article<
Get Radiology Tree app to read full this article<
Get Radiology Tree app to read full this article<
 Open full size image
Figure 1
Summary of the large image microscope array (LIMA) system. This system serves to section the tissue while recording the spatial correspondence between sections by imaging the tissue block before the removal of a section. Multiple subimages are acquired as the camera and microscope coupling rastor scan over the tissue surface. The surface is then sectioned and removed from the tissue block, via a vibrating knife, for subsequent histological processing. This process results in the generation of a color dataset which can be used as the ground truth for linking nondestructive image sets, such as computed tomography to destructive histopathology image sets.
Get Radiology Tree app to read full this article<
Get Radiology Tree app to read full this article<
Get Radiology Tree app to read full this article<
Materials and methods
Patients
Get Radiology Tree app to read full this article<
Table 1
Patient Demographic Information
Characteristic Mean Range Age (y) 66 51–79 Body mass index 26 21–33 Nodule size from radiology report Maximum diameter 27 14–50 Minimum diameter 19 10–15n% Gender Male 2 18 Female 9 82 Race Caucasian 10 91 African American 1 9 Site Right upper lobe 1 9 Right lower lobe 6 55 Left upper lobe 3 27% Left lower lobe 1 9 Diagnosis Adenocarcinoma 7 64 Squamous cell carcinoma 3 27 Neuroendocrine carcinoma 1 9 Stage Stage IA 5 46 Stage IB 3 27% Stage IIB 2 18% Stage IIIA 1 9 Smoking history Never 1 9 <1 pack per week 2 18 1 pack per week 6 55 2 pack per week 1 9 3 pack per week 1 9
Get Radiology Tree app to read full this article<
Data Acquisition Process
Get Radiology Tree app to read full this article<
Get Radiology Tree app to read full this article<
Get Radiology Tree app to read full this article<
Get Radiology Tree app to read full this article<
Get Radiology Tree app to read full this article<
Get Radiology Tree app to read full this article<
Get Radiology Tree app to read full this article<
Some Specific Challenges in Multimodal acquisition
Get Radiology Tree app to read full this article<
Get Radiology Tree app to read full this article<
Get Radiology Tree app to read full this article<
Get Radiology Tree app to read full this article<
Get Radiology Tree app to read full this article<
Registration
Get Radiology Tree app to read full this article<
Get Radiology Tree app to read full this article<
2D Rigid Registration
Get Radiology Tree app to read full this article<
fS(x)=λAx+t f
S
(
x
)
=
λ
A
x
+
t
Get Radiology Tree app to read full this article<
Get Radiology Tree app to read full this article<
D(fS)=∑ni=1||fS(Lrim)−Lrif||2=∑ni=1||λALrim+t−Lrif||2 D
(
f
S
)
=
∑
i
=
1
n
|
|
f
S
(
L
r
m
i
)
−
L
r
f
i
|
|
2
=
∑
i
=
1
n
|
|
λ
A
L
r
m
i
+
t
−
L
r
f
i
|
|
2
Get Radiology Tree app to read full this article<
Get Radiology Tree app to read full this article<
Get Radiology Tree app to read full this article<
FRE=D(fs)=∑ni=1||λALrim+t−Lrif||2 F
R
E
=
D
(
f
s
)
=
∑
i
=
1
n
|
|
λ
A
L
r
m
i
+
t
−
L
r
f
i
|
|
2
Get Radiology Tree app to read full this article<
Get Radiology Tree app to read full this article<
TRE=∑ni=1||λALeim+t−Leif||2 T
R
E
=
∑
i
=
1
n
|
|
λ
A
L
e
m
i
+
t
−
L
e
f
i
|
|
2
Get Radiology Tree app to read full this article<
Get Radiology Tree app to read full this article<
2D Nonrigid Registration
Get Radiology Tree app to read full this article<
fTPS(x)=Dx+∑ni−1wiU(∣∣x−Lrim∣∣) f
T
P
S
(
x
)
=
D
x
+
∑
i
−
1
n
w
i
U
(
|
x
−
L
r
m
i
|
)
where U(r)=r2logr2 U
(
r
)
=
r
2
log
r
2 , D is a matrix representing the affine transformation and w i is the warping coefficient matrix that represents the non-affine deformation. The bending energy function, E, is minimized to control the extent of warping to the smallest deformation possible:
E[f(x)]=∬R2(f2xx+2f2xy+f2yy)dxdy E
[
f
(
x
)
]
=
∬
ℜ
2
(
f
x
x
2
+
2
f
x
y
2
+
f
y
y
2
)
d
x
d
y
Get Radiology Tree app to read full this article<
Get Radiology Tree app to read full this article<
Get Radiology Tree app to read full this article<
FRE=∑ni=1∣∣∣∣fTPS(Lrim)−Lrif||2=0 F
R
E
=
∑
i
=
1
n
|
|
f
T
P
S
(
L
r
m
i
)
−
L
r
f
i
|
|
2
=
0
Get Radiology Tree app to read full this article<
Get Radiology Tree app to read full this article<
TRE=∑ni=1||fTPS(Leim)−Leif||2 T
R
E
=
∑
i
=
1
n
|
|
f
T
P
S
(
L
e
m
i
)
−
L
e
f
i
|
|
2
Get Radiology Tree app to read full this article<
3D Rigid Registration
Get Radiology Tree app to read full this article<
Get Radiology Tree app to read full this article<
Get Radiology Tree app to read full this article<
Get Radiology Tree app to read full this article<
fR(x)=Ax+t f
R
(
x
)
=
A
x
+
t
Get Radiology Tree app to read full this article<
Get Radiology Tree app to read full this article<
Get Radiology Tree app to read full this article<
NMI(A,B)=H(A)+H(B)H(A,B) N
M
I
(
A
,
B
)
=
H
(
A
)
+
H
(
B
)
H
(
A
,
B
)
Get Radiology Tree app to read full this article<
Get Radiology Tree app to read full this article<
H(X)=−∑ni=1p(xi)logbp(xi) H
(
X
)
=
−
∑
i
=
1
n
p
(
x
i
)
log
b
p
(
x
i
)
Get Radiology Tree app to read full this article<
Get Radiology Tree app to read full this article<
Results
Get Radiology Tree app to read full this article<
Get Radiology Tree app to read full this article<
Get Radiology Tree app to read full this article<
Get Radiology Tree app to read full this article<
Get Radiology Tree app to read full this article<
Get Radiology Tree app to read full this article<
Get Radiology Tree app to read full this article<
Get Radiology Tree app to read full this article<
Discussion
Get Radiology Tree app to read full this article<
Get Radiology Tree app to read full this article<
Get Radiology Tree app to read full this article<
Get Radiology Tree app to read full this article<
Get Radiology Tree app to read full this article<
Get Radiology Tree app to read full this article<
Get Radiology Tree app to read full this article<
Get Radiology Tree app to read full this article<
Get Radiology Tree app to read full this article<
Get Radiology Tree app to read full this article<
Acknowledgment
Get Radiology Tree app to read full this article<
Get Radiology Tree app to read full this article<
References
1. Oehr P., Biersack J., Coleman R.E.: PET and PET-CT in oncology.2004.SpringerVerlag Berlin Heidelberg, NY
2. van Der Wel A., Nijsten S., Hochstenbag M., et. al.: Increased therapeutic ratio by 18FDG-PET CT planning in patients with clinical CT stage N2-N3M0 non-small-cell lung cancer: a modeling study. Int J Radiat Oncol Biol Phys 2005; 61: pp. 649-655.
3. Bybel B., Brunken R.C., DiFilippo F.P., et. al.: SPECT/CT imaging: clinical utility of an emerging technology. Radiographics 2008; 28: pp. 1097-1113.
4. von Schulthess G.: Molecular anatomic imaging: PET-CT and SPECT-CT integrated modality imaging.2007.Lippincott Williams and WilkinsPhiladelphia, PA
5. Seltzer S.E., Getty D.J., Pickett R.M., et. al.: Multimodality diagnosis of liver tumors: feature analysis with CT, liver-specific and contrast-enhanced MR, and a computer model. Acad Radiol 2002; 9: pp. 256-269.
6. Kennel S.J., Davis I.A., Branning J., et. al.: High resolution computed tomography and MRI for monitoring lung tumor growth in mice undergoing radioimmunotherapy: correlation with histology. Med Phys 2000; 27: pp. 1101-1107.
7. Chan R., He Y., Haque A., et. al.: Computed tomographic-pathologic correlation of gross tumor volume and clinical target volume in non-small cell lung cancer: a pilot experience. Arch Pathol Lab Med 2001; 125: pp. 1469-1472.
8. Clarke S.E., Hammond R.R., Mitchell J.R., et. al.: Quantitative assessment of carotid plaque composition using multicontrast MRI and registered histology. Magn Reson Med 2003; 50: pp. 1199-1208.
9. Namati E., De Ryk J., Thiesse J., et. al.: Large image microscope array for the compilation of multimodality whole organ image databases. Anat Rec (Hoboken) 2007; 290: pp. 1377-1387.
10. de Ryk J, Namati E, Reinhardt J, et al. A whole organ serial sectioning and imaging system for correlation of pathology to computed tomography. In: SPIE: Three-dimensional and multidimensional microscopy. San Diego, CA, 2004; 224–234.
11. de Ryk J, Thiesse J, Reinhardt J, et al. Establishing multimodality datasets with incorporation of 3D histopathology for soft tissue classification. In: SPIE: Medical imaging. San Diego, CA, 2006; 1–8.
12. Thiesse J, Namati E, De Ryk J, et al. Bright field segmentation tomography (BFST) for use as surface identification in stereomicroscopy. In: SPIE: Three-dimensional and multidimensional microscopy. San Diego, CA, 2004; 216–224.
13. Heitzman R.: Radiologic-pathologic correlations.The Lung.1984.New York, NY: The C.V. Mosby Company
14. Korobkin M., Brodeur F.J., Francis I.R., et. al.: Delayed enhanced CT for differentiation of benign from malignant adrenal masses. Radiology 1996; 200: pp. 737-742.
15. Goshtasby A.: 2D and 3D image registration for medical, remote sensing, and industrial applications.2005.John Wiley and SonsHoboken, NJ
16. Fitzpatrick J.M., West J.B.: The distribution of target registration error in rigid-body point-based registration. IN: IEEE Trans Med Imaging 2001; pp. 917-927.
17. Fitzpatrick J.M., West J.B., Maurer C.R.J.: Predicting error in rigid-body point-based registration. IN: IEEE Trans Med Imaging 1998; pp. 694-702.
18. Bookstein F.: Principal warps: thin-plate splines and the decomposition of deformations. IEEE Transactions on pattern analysis and machine intelligence 1989; 11: pp. 567-585.
19. Rohr K., Stiehl H.S., Sprengel R., et. al.: Landmark-based elastic registration using approximating thin-plate splines. IEEE Trans Med Imaging 2001; pp. 526-534.
20. Li G., Nikolova S., Bartha R.: Registration of in vivo magnetic resonance T1-weighted brain images to triphenyltetrazolium chloride stained sections in small animals. J Neurosci Methods 2006; 156: pp. 368-375.
21. Studholme C., Hill D., Hawkes D.: An overlap invariant entropy measure of 3D medical image alignment. Pattern Recognition 1999; 32: pp. 71-86.
22. Travis W.D., Garg K., Franklin W.A., et. al.: Evolving concepts in the pathology and computed tomography imaging of lung adenocarcinoma and bronchioloalveolar carcinoma. J Clin Oncol 2005; 23: pp. 3279-3287.
23. Suzuki K., Yokose T., Yoshida J., et. al.: Prognostic significance of the size of central fibrosis in peripheral adenocarcinoma of the lung. Ann Thorac Surg 2000; 69: pp. 893-897.
24. Okudera K., Kamata Y., Takanashi S., et. al.: Small adenocarcinoma of the lung: prognostic significance of central fibrosis chiefly because of its association with angiogenesis and lymphangiogenesis. Pathol Int 2006; 56: pp. 494-502.
25. Noguchi M., Morikawa A., Kawasaki M., et. al.: Small adenocarcinoma of the lung. Histologic characteristics and prognosis. Cancer 1995; 75: pp. 2844-2852.
26. Olcott C.R.: Cell types and histologic patterns in carcinoma of the lung; observations on the significance of tumors containing more than one type of cell. Am J Pathol 1955; 31: pp. 975-995.
27. Shah S.K., McNitt-Gray M.F., Rogers S.R., et. al.: Computer aided characterization of the solitary pulmonary nodule using volumetric and contrast enhancement features. Acad Radiol 2005; 12: pp. 1310-1319.
28. Way T.W., Hadjiiski L.M., Sahiner B., et. al.: Computer-aided diagnosis of pulmonary nodules on CT scans: segmentation and classification using 3D active contours. Med Phys 2006; 33: pp. 2323-2337.
29. Jacobs M.A., Windham J.P., Soltanian-Zadeh H., et. al.: Registration and warping of magnetic resonance images to histological sections. Med Phys 1999; 26: pp. 1568-1578.
30. Pelizzari C.A., Chen G.T., Spelbring D.R., et. al.: Accurate three-dimensional registration of CT, PET, and/or MR images of the brain. J Comput Assist Tomogr 1989; 13: pp. 20-26.
31. Dodd L.E., Wagner R.F., Armato S.G., et. al.: Assessment methodologies and statistical issues for computer-aided diagnosis of lung nodules in computed tomography: contemporary research topics relevant to the lung image database consortium. Acad Radiol 2004; 11: pp. 462-475.
32. Wormans D., Beyer F., Diederich S., et. al.: Diagnostic performance of a commercially available computer-aided diagnosis system for automatic detection of pulmonary nodules: comparison with single and double reading. Fortschr Rontgenstr 2004; 176: pp. 953-958.
33. Awai K., Murao K., Ozawa A., et. al.: Pulmonary nodules at chest CT: effect of computer-aided diagnosis on radiologists’ detection performance. Radiology 2004; 230: pp. 347-352.
34. McLennan G., Clarke L., Hohl R.: Imaging as a biomarker for therapy response: cancer as a prototype for the creation of research resources. Clin Pharmacol Ther 2008; 84: pp. 433-436.