
Rationale and Objectives
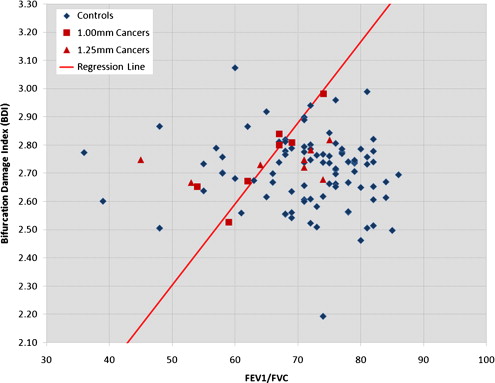
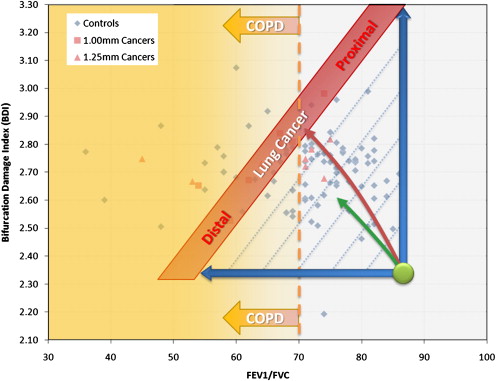
Lung cancer is caused primarily by repeated exposure to carcinogenic particulate matter and noxious gasses with high particulate deposition localized to airway bifurcations and the lung periphery. The quantitative measurement and analysis of these sites has the potential to stratify lung cancer risk. The aim of this preliminary study was to assess the performance of a new method for estimating individual lung cancer risk based on the analysis of airway bifurcations on high-resolution (HR) computed tomographic (CT) scanning and spirometry.
Materials and Methods
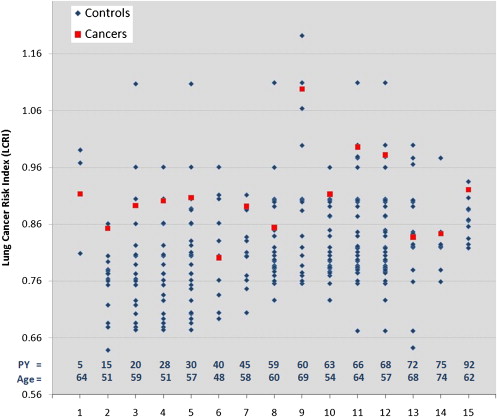
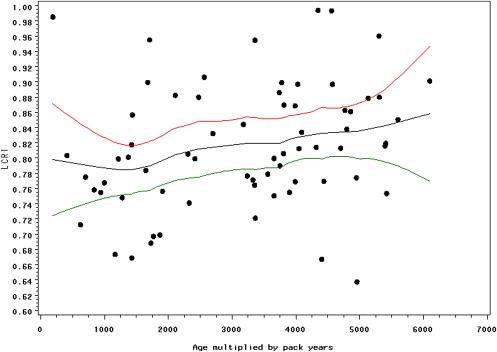
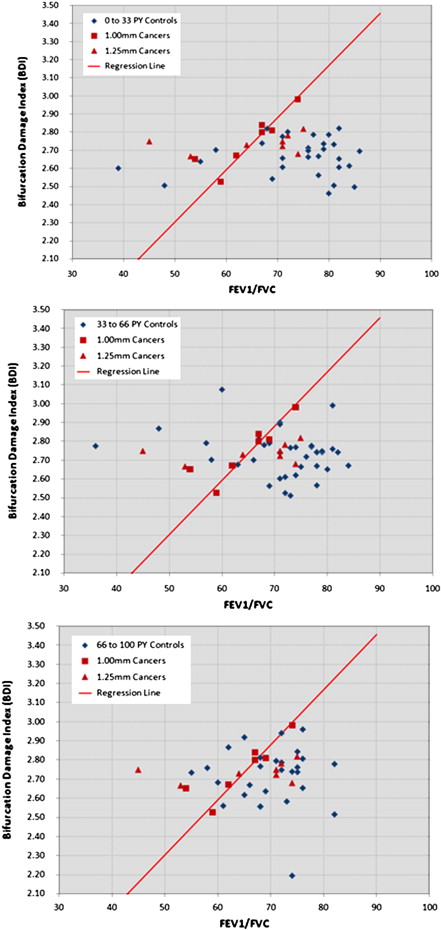
One hundred eight subjects with spirometry and thin-slice CT data were selected from a CT screening study including 15 patients with early lung cancer and 93 age-matched and pack-year–matched controls. A subset of seven patients with cancer and 72 controls were scanned with 1-mm CT slice thickness, representing an HR case subset. A quantitative lung cancer risk index method was developed on the basis of airway bifurcation x-ray attenuation combined with the ratio of forced expiratory volume in 1 second to forced vital capacity. Cochran-Mantel-Haenszel and conditional logistic regression tests were used to analyze performance.
Results
Cochran-Mantel-Haenszel crude analysis revealed a cancer detection sensitivity and specificity of 67% and 72% for all cases and 100% and 73% for the HR case subset, respectively. Conditional logistic regression showed that a 0.0328 increase in lung cancer risk index was associated with odds ratios of 1.84 (95% confidence interval, 1.18–2.85) for the full data set ( P = .0067) and 2.89 (95% confidence interval, 1.02-8.19) for the HR subset ( P = .0467).
Conclusions
A preliminary evaluation of a new lung cancer risk estimation method based on thin slice CT and spirometry showed a statistically significant association with lung cancer.
Lung cancer is the leading cause of cancer death worldwide and is responsible for >1.3 million deaths each year . In the United States, a 17.3% 5-year survival rate is attributable largely to the high rate of late-stage diagnosis, when treatment options are rarely curative. However, the onset of malignancy generally occurs over decades of life as a result of genetic predisposition to respiratory injury and repeated toxic exposure and damage to lung tissues. Functional declines , structural changes and preneoplastic molecular changes have been documented to occur within the lungs of smokers as cigarette smoke exposure increases. This report provides preliminary evidence that anatomic x-ray attenuation changes also occur, particularly in lung tissues that receive some of the highest levels of toxic exposure.
A large body of environmental health and toxicity research has demonstrated that the deposition of particulate matter is a critical mechanism governing the toxic dose exposure of the lung . Particulate matter, a major source of toxicity in cigarette smoke, is carried through the airways and deposited on the respiratory epithelium on the basis of several fundamental physical forces . This creates “hot spots” in the lung where particulate matter deposition and exposure to noxious gasses are high.
Get Radiology Tree app to read full this article<
Get Radiology Tree app to read full this article<
Get Radiology Tree app to read full this article<
Get Radiology Tree app to read full this article<
Materials and methods
Subjects
Get Radiology Tree app to read full this article<
Get Radiology Tree app to read full this article<
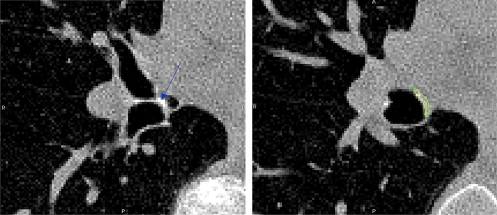
Quantitative CT Analysis
Get Radiology Tree app to read full this article<
Get Radiology Tree app to read full this article<
Get Radiology Tree app to read full this article<
Get Radiology Tree app to read full this article<
Get Radiology Tree app to read full this article<
BDI=CFn⋅∑ni=1log(BDi−CDi), B
D
I
=
CF
n
⋅
∑
i
=
1
n
log
(
BD
i
−
CD
i
)
,
where i is the index of the n = 5 segmental bifurcations measured.
Get Radiology Tree app to read full this article<
Get Radiology Tree app to read full this article<
Get Radiology Tree app to read full this article<
Table 1
Scanner Correction Factors Used to Correct for Variation in Acquisition Systems
Scanner Model ∗ Slice Thickness (mm) Correction Control Subjects Patients with Cancer Definition 1.00 0.9676 13 0 Sensation 64 1.00 1.0000 50 1 Volume Zoom 1.00 1.0264 9 6 Volume Zoom 1.25 1.0703 21 8
Get Radiology Tree app to read full this article<
Get Radiology Tree app to read full this article<
Get Radiology Tree app to read full this article<
Get Radiology Tree app to read full this article<
Get Radiology Tree app to read full this article<
Get Radiology Tree app to read full this article<
Get Radiology Tree app to read full this article<
Statistical Analysis
Get Radiology Tree app to read full this article<
Results
Get Radiology Tree app to read full this article<
Table 2
Study Population Characteristics According to Cancer Status
Patients with Cancer Control Subjects Variable ( n = 15) ( n = 93)P Age (y) 59.7 ± 7.3 58.9 ± 7.2 .6680 ∗ Men 13 (86.7%) 79 (84.9%) 1.0000 † Smoking exposure (pack-years) 49.1 ± 25.2 51.9 ± 25.3 .6661 ‡ FEV 1 /FVC 65.1 ± 8.9 71.6 ± 9.5 .0530 ‡ 1-mm slice thickness 7 (46.7%) 72 (77.4%) .0241 †
FEV 1 , forced expiratory volume in 1 second; FVC, forced vital capacity.
Data are expressed as mean ± SD or as number (percentage).
Get Radiology Tree app to read full this article<
Get Radiology Tree app to read full this article<
Get Radiology Tree app to read full this article<
Table 3
Distribution of Lung Cancer Histologic Types and Stages
Patients with Cancer Lung Cancer Subtype ( n = 15) Stage I Stage II Stage III Stage IV Adenocarcinoma 9 (60%) 6 2 — 1 Squamous cell 2 (13%) 2 — — — Large cell 2 (13%) 1 — 1 — Small cell 2 (13%) — — 2 —
Get Radiology Tree app to read full this article<
Get Radiology Tree app to read full this article<
Get Radiology Tree app to read full this article<
Get Radiology Tree app to read full this article<
Get Radiology Tree app to read full this article<
Get Radiology Tree app to read full this article<
Get Radiology Tree app to read full this article<
Get Radiology Tree app to read full this article<
Discussion
Get Radiology Tree app to read full this article<
Get Radiology Tree app to read full this article<
Get Radiology Tree app to read full this article<
Get Radiology Tree app to read full this article<
Get Radiology Tree app to read full this article<
Get Radiology Tree app to read full this article<
Get Radiology Tree app to read full this article<
Get Radiology Tree app to read full this article<
Get Radiology Tree app to read full this article<
Get Radiology Tree app to read full this article<
Get Radiology Tree app to read full this article<
Get Radiology Tree app to read full this article<
Get Radiology Tree app to read full this article<
Get Radiology Tree app to read full this article<
Get Radiology Tree app to read full this article<
Get Radiology Tree app to read full this article<
Get Radiology Tree app to read full this article<
Get Radiology Tree app to read full this article<
Conclusion
Get Radiology Tree app to read full this article<
Acknowledgments
Get Radiology Tree app to read full this article<
Appendix
Get Radiology Tree app to read full this article<
Get Radiology Tree app to read full this article<
Get Radiology Tree app to read full this article<
Get Radiology Tree app to read full this article<
Get Radiology Tree app to read full this article<
Get Radiology Tree app to read full this article<
References
1. World Health Organization. The global burden of disease: 2004 update. Available at: http://www.who.int/healthinfo/global_burden_disease/GBD_report_2004update_full.pdf . Accessed April .
2. Ries LAG, Melbert D, Krapcho M, et al. SEER cancer statistics review, 1975-2005. Available at: http://seer.cancer.gov/csr/1975_2005/ . Accessed April 7, 2010.
3. Alberg A.J., Ford J.G., Samet J.M.: Epidemiology of lung cancer: ACCP evidence-based clinical practice guidelines (2nd edition). Chest 2007; 132: pp. 29S-55S.
4. Kishi K., Gurney J.W., Schroeder D.R., et. al.: The correlation of emphysema or airway obstruction with the risk of lung cancer: a matched case-controlled study. Eur Respir J 2002; 19: pp. 1093-1098.
5. Mannino D.M., Aguayo S.M., Petty T.L., et. al.: Low lung function and incident lung cancer in the United States: data from the First National Health and Nutrition Examination Survey follow-up. Arch Intern Med 2003; 163: pp. 1475-1480.
6. de Torres J.P., Bastarrika G., Wisnivesky J.P., et. al.: Assessing the relationship between lung cancer risk and emphysema detected on low-dose CT of the chest. Chest 2007; 132: pp. 1932-1938.
7. Bastarrika G., Wisnivesky J.P., Pueyo J.C., et. al.: Low-dose volumetric computed tomography for quantification of emphysema in asymptomatic smokers participating in an early lung cancer detection trial. J Thorac Imaging 2009; 24: pp. 206-211.
8. Wistuba I.I., Gazdar A.F.: Lung cancer preneoplasia. Ann Rev Pathol Mech Dis 2006; 1: pp. 331-348.
9. Kim C.S., Hu S.C.: Regional deposition of inhaled particles in human lungs: comparison between men and women. J Appl Physiol 1998; 84: pp. 1834-1844.
10. Balashazy I., Hofmann W., Heistracher T.: Local particle deposition patterns may play a key role in the development of lung cancer. J Appl Physiol 2003; 94: pp. 1719-1725.
11. Phalen R.F., Oldham M.J., Nel A.E.: Tracheobronchial particle dose considerations for in vitro toxicology studies. Toxicol Sci 2006; 92: pp. 126-132.
12. Crawford-Brown D.: Theoretical and mathematical foundations of human health risk analysis: biophysical theory of environmental health science.1997.Kluwer AcademicBoston
13. Broday D.M.: Deposition of ultrafine particles at carinal ridges of the upper bronchial airways. Aeros Sci Technol 2004; 38: pp. 991-1000.
14. Martell E.A.: α-Radiation dose at bronchial bifurcations of smokers from indoor exposure to radon progeny. Proc Natl Acad Sci U S A 1983; 80: pp. 1285-1289.
15. Svartengren M., Hassler E., Philipson K., et. al.: Spirometric data and penetration of particles to the alveoli. Br J Ind Med 1986; 43: pp. 188-191.
16. Churg A., Brauer M.: Ambient atmospheric particles in the airways of human lungs. Ultrastruct Pathol 2000; 24: pp. 353-361.
17. Skillrud D.M., Offord K.P., Miller R.D.: Higher risk of lung cancer in chronic obstructive pulmonary disease. A prospective, matched, controlled study. Ann Intern Med 1986; 105: pp. 503-507.
18. Tockman M.S., Anthonisen N.R., Wright E.C., et. al.: Airways obstruction and the risk for lung cancer. Ann Intern Med 1987; 106: pp. 512-518.
19. Bastarrika G., García-Velloso M.J., Lozano M.D., et. al.: Early lung cancer detection using spiral computed tomography and positron emission tomography. Am J Respir Crit Care Med 2005; 171: pp. 1378-1383.
20. Tack D.Gevenois P.A.Radiation dose from adult and pediatric multidetector computed tomography.2007.Springer-VerlagBerlin, Germany:
21. Miller M.R., Hankinson J., Brusasco V., et. al.: Standardisation of spirometry. Eur Respir J 2005; 26: pp. 319-338.
22. Bonucci E.: Biological calcification: normal and pathological processes in the early stages.2007.SpringerBerlin, Germany
23. Rabe K.F., Hurd S., Anzueto A., et. al.: Global strategy for the diagnosis, management, and prevention of chronic obstructive pulmonary disease: GOLD executive summary. Am J Respir Crit Care Med 2007; 176: pp. 532-555.
24. Mantel N., Haenszel W.: Statistical aspects of the analysis of data from retrospective studies of disease. J Natl Cancer Inst 1959; 22: pp. 719-748.
25. Local regression. Available at: http://en.wikipedia.org/wiki/Local_regression . Accessed April 7, 2010.
26. Hogg J.C., Wright J.L., Wiggs B.R., et. al.: Lung structure and function in cigarette smokers. Thorax 1994; 49: pp. 473-478.
27. Newell R.: Anatomy of the post-laryngeal airways, lungs and diaphragm. Surgery 2005; 23: pp. 393-397.
28. Edge J.R., Millard F.J., Reid L., et. al.: The radiographic appearances of the chest in persons of advanced age. Br J Radiol 1964; 37: pp. 769-774.
29. Young R.H., Sandstrom R.E., Mark G.J.: Tracheopathia osteoplastica: clinical, radiologic, and pathological correlations. J Thorac Cardiovasc Surg 1980; 79: pp. 537-541.
30. Zuscik M.J., Hilton M.J., Zhang X., et. al.: Regulation of chondrogenesis and chondrocyte differentiation by stress. J Clin Invest 2008; 118: pp. 429-438.
31. Ballaz S., Mulshine J.L.: The potential contributions of chronic inflammation to lung carcinogenesis. Clin Lung Cancer 2003; 5: pp. 46-62.
32. Engels E.A.: Inflammation in the development of lung cancer: epidemiological evidence. Exp Rev Anticancer Ther 2008; 8: pp. 605-615.
33. Hankinson J.L., Odencrantz J.R., Fedan K.B.: Spirometric reference values from a sample of the general U.S. population. Am J Respir Crit Care Med 1999; 159: pp. 179-187.
34. Spitz M.R., Hong W.K., Amos C.I., et. al.: A risk model for prediction of lung cancer. J Natl Cancer Inst 2007; 99: pp. 715-726.
35. Boedeker K.L., McNitt-Gray M.F.: Application of the noise power spectrum in modern diagnostic MDCT: part II. Noise power spectra and signal to noise. Phys Med Biol 2007; 52: pp. 4047-4061.