
Rationale and Objectives
Poorly differentiated non–small cell lung cancer (NSCLC) indicated a poor prognosis and well-differentiated NSCLC indicates a noninvasive nature and good prognosis. The purpose of this study was to build and validate a radiomics signature to predict the degree of tumor differentiation (DTD) for patients with NSCLC.
Materials and Methods
A total of 487 patients with pathologically diagnosed NSCLC were retrospectively included in our study. Five hundred ninety-one radiomics features were extracted from each tumor from the contrast-enhanced computed tomography images. A minimum redundancy maximum relevance algorithm and a logistic regression model were used for dimension reduction, feature selection, and radiomics signature building. The performance of the radiomics signature was assessed using receiver operating characteristic analysis, and the area under the receiver operating characteristic curve (AUC), sensitivity, specificity, and accuracy were calculated to quantify the association between a signature and DTD. An independent validation set contained 184 consecutive patients with NSCLC.
Results
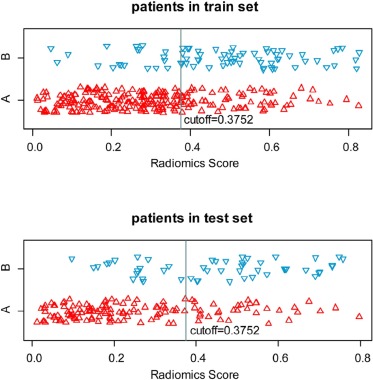
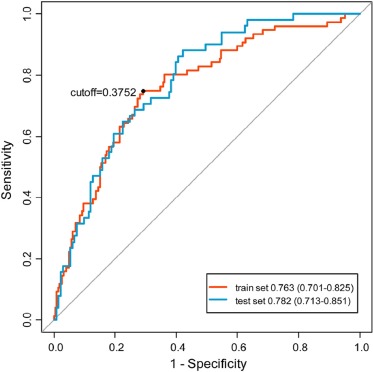
A nine-radiomics-feature-based signature was built and it could differentiate low and high DTDs in the training set (AUC = 0.763, sensitivity = 0.750, specificity = 0.665, and accuracy = 0.687), and the radiomics signature had good discrimination performance in the validation set (AUC = 0.782, sensitivity = 0.608, specificity = 0.752, and accuracy = 0.712).
Conclusions
A radiomics signature based on contrast-enhanced computed tomography imaging is a potentially useful imaging biomarker for differentiating low from high DTD in patients with NSCLC.
Introduction
Lung cancer is the leading cause of cancer mortality worldwide, and non–small cell lung cancer (NSCLC) is the major type of lung cancer (80%) . The malignancy and prognosis of patients with NSCLC are affected by numerous factors, such as the histologic degree of tumor differentiation (DTD), cancer stage, and lymph node metastasis . Of these factors, it has been confirmed that DTD is associated with prognosis: a poorly differentiated tumor indicates a poor prognosis, and a well-differentiated tumor indicates a noninvasive nature and good prognosis . Therefore, accurately discriminating the DTD before surgery is critical for designing therapeutic strategies and for predicting disease prognosis .
In routine clinical practice, the currently used method to determine the DTD is mainly histopathologic analysis of the tumor via biopsy by microscopy observation, which is clinically limited by the inherent risk of invasive procedures; this method is laborious, requires highly trained operators, and is prone to be disruptive because of individual-to-individual judgment . Thus, automatic, noninvasive alternatives are desired. In this regard, medical imaging provides promising potential and has been already routinely used in clinical practice for oncological diagnosis, staging, and evaluation of response to treatment . Recently, a study indicated that dual-energy computed tomography (CT) could be a valuable functional imaging method to estimate DTD in primary lung cancer . However, the dual-energy CT has not been widely used in clinical practice.
Get Radiology Tree app to read full this article<
Get Radiology Tree app to read full this article<
Materials and Methods
Patients
Get Radiology Tree app to read full this article<
Get Radiology Tree app to read full this article<
CT Scanning Protocol
Get Radiology Tree app to read full this article<
Pathologic Analysis
Get Radiology Tree app to read full this article<
Tumor Imaging Segmentation
Get Radiology Tree app to read full this article<
Radiomics Feature Extraction
Get Radiology Tree app to read full this article<
Statistical Analysis
Demographic Characteristic of the Patients
Get Radiology Tree app to read full this article<
Radiomics Feature Selection and Radiomics Signature Building
Get Radiology Tree app to read full this article<
Get Radiology Tree app to read full this article<
Evaluation and Validation of the Radiomics Signature
Get Radiology Tree app to read full this article<
Get Radiology Tree app to read full this article<
Results
Demographic Characteristics of the Patients
Get Radiology Tree app to read full this article<
TABLE 1
Clinical Characteristics of Patients with NSCLC in the Training and the Validation Sets
Characteristic Training Set Validation Set_P_ Gender .073 Male 202 107 Female 101 77 Age (mean ± SD) (y) 61.2 ± 10.6 60.2 ± 9.7 .301 Degree of differentiation .592 High DTD 227 133 Low DTD 76 51
DTD, degree of tumor differentiation; NSCLC, non–small cell lung cancer; SD, standard deviation.
The number in the table is the number of the patients except the age.
Get Radiology Tree app to read full this article<
Get Radiology Tree app to read full this article<
Radiomics Feature Selection and Radiomics Signature Building
Get Radiology Tree app to read full this article<
RadiomicsScore=−5.606+0.07390×RLN–90–0+0.5160×contrast–45–1–0+(−5.045)×LRLGLE–90–0+(−6.267e−06)×his–SD–2.5+0.480×contrast–135–1–0+(−2.887)×correlation–90–3–0+(−0.342)×contrast–90–1–0+(−56.580)×SRE–90–0+(6.059e−03)×his–50–mean–0 Radiomics
Score
=
−
5.606
+
0.07390
×
RLN
̲
90
̲
0
+
0.5160
×
contrast
̲
45
̲
1
̲
0
+
(
−
5.045
)
×
LRLGLE
̲
90
̲
0
+
(
−
6.267
e
−
06
)
×
his
̲
SD
̲
2.5
+
0.480
×
contrast
̲
135
̲
1
̲
0
+
(
−
2.887
)
×
correlation
̲
90
̲
3
̲
0
+
(
−
0.342
)
×
contrast
̲
90
̲
1
̲
0
+
(
−
56.580
)
×
SRE
̲
90
̲
0
+
(
6.059
e
−
03
)
×
his
̲
50
̲
mean
̲
0
Get Radiology Tree app to read full this article<
Get Radiology Tree app to read full this article<
TABLE 2
Comparison of Radiomics Features and Radiomics Signature Between High- and Low-DTD NSCLC in Both Training and Validation Sets
Training Set Validation Set Features High DTD Low DTD_P_ High DTD Low DTD_P_ RLN_90_0 672.0 (670.2–674.3) 674.3 (671.8–676.3) 8.31E-06 672.2 (670.7–673.9) 673.3 (670.1–675.7) 1.62E-01 Contrast_45_1_0 7.392 (6.781–8.385) 8.549 (7.438–9.636) 5.82E-07 7.471 (6.588–8.470) 8.298 (7.289–9.324) 1.00E-03 LRLGLE_90_0 0.3897 (0.3608–0.4407) 0.3667 (0.3454–0.3972) 2.77E-06 0.4271 (0.3747–0.5039) 0.3717 (0.3517–0.4033) 1.75E-06 his_SD_2.5 779.3 (107.9–5233.0) 14,850 (3,638–52,720) 1.56E-11 268.20 (38.49–1785.00) 3,214.0 (798.4–24,520.0) 5.11E-07 Contrast_135_1_0 7.662 (6.763–8.841) 8.835 (7.810–10.470) 6.92E-07 7.635 (6.728–8.620) 9.012 (7.576–10.360) 8.35E-06 Correlation_90_3_0 0.2805 (0.1981–0.3708) 0.1874 (0.1378–0.2578) 3.53E-08 0.2940 (0.2242–0.3699) 0.2030 (0.1464–0.2694) 2.12E-05 Contrast_90_1_0 4.950 (4.133–6.096) 6.298 (5.188–7.751) 1.92E-08 4.680 (3.920–5.837) 6.366 (5.222–7.428) 4.34E-08 SRE_90_0 0.8527 (0.8453–0.8621) 0.8630 (0.8545–0.8712) 4.25E-07 0.8535 (0.8494–0.8608) 0.8590 (0.8469–0.8663) 1.07E-01 his_50_mean_0 30.67 (14.55–67.10) 93.38 (49.77–154.20) 8.54E-11 22.52 (10.95–48.14) 46.90 (31.21–112.00) 2.07E-06 Radiomics score 0.2816 (0.1556–0.3945) 0.4954 (0.3672–0.6079) 6.79E-12 0.1950 (0.1093–0.3735) 0.4721 (0.2770–0.5830) 3.43E-09
DTD, degree of tumor differentiation; NSCLC, non–small cell lung cancer.
The value of each radiomics feature was expressed as median (interquartile range).
Get Radiology Tree app to read full this article<
Evaluation and Validation of the Radiomics Signature
Get Radiology Tree app to read full this article<
Get Radiology Tree app to read full this article<
Get Radiology Tree app to read full this article<
Discussion
Get Radiology Tree app to read full this article<
Get Radiology Tree app to read full this article<
Get Radiology Tree app to read full this article<
Get Radiology Tree app to read full this article<
Get Radiology Tree app to read full this article<
Get Radiology Tree app to read full this article<
Get Radiology Tree app to read full this article<
Get Radiology Tree app to read full this article<
Appendix. The Algorithm for Image Features Calculation
Get Radiology Tree app to read full this article<
Get Radiology Tree app to read full this article<
Get Radiology Tree app to read full this article<
∇2G(x,y)=−1πσ4(1−x2+y22σ2)e−(x2+y22σ2) ∇
2
G
(
x
,
y
)
=
−
1
π
σ
4
(
1
−
x
2
+
y
2
2
σ
2
)
e
−
(
x
2
+
y
2
2
σ
2
)
where x,y denotes the spatial coordinates of the pixel and σ is the value of the filter parameter.
Get Radiology Tree app to read full this article<
Get Radiology Tree app to read full this article<
mean=1N∑Ni=1X(i) mean
=
1
N
∑
i
=
1
N
X
(
i
)
Get Radiology Tree app to read full this article<
SD=1N∑Ni=1(X(i)−X¯¯¯)2 SD
=
1
N
∑
i
=
1
N
(
X
(
i
)
−
X
¯
)
2
Get Radiology Tree app to read full this article<
β–mean=1N−M∑Ni=MX(i) β
̲
mean
=
1
N
−
M
∑
i
=
M
N
X
(
i
)
β–SD=1N−M∑Ni=M(X(i)−X¯¯¯)2 β
̲
SD
=
1
N
−
M
∑
i
=
M
N
(
X
(
i
)
−
X
¯
)
2
Get Radiology Tree app to read full this article<
kurtosis=1N∑Ni=1(X(i)−X¯¯¯)4(1N∑Ni=1(X(i)−X¯¯¯)2√)4 kurtosis
=
1
N
∑
i
=
1
N
(
X
(
i
)
−
X
¯
)
4
(
1
N
∑
i
=
1
N
(
X
(
i
)
−
X
¯
)
2
)
4
Get Radiology Tree app to read full this article<
skewness=1N∑Ni=1(X(i)−X¯¯¯)3(1N∑Ni=1(X(i)−X¯¯¯)2√)3 skewness
=
1
N
∑
i
=
1
N
(
X
(
i
)
−
X
¯
)
3
(
1
N
∑
i
=
1
N
(
X
(
i
)
−
X
¯
)
2
)
3
Get Radiology Tree app to read full this article<
Get Radiology Tree app to read full this article<
Get Radiology Tree app to read full this article<
contrast=∑Ngi=1∑Ngj=1|i−j|2P(i,j) contrast
=
∑
i
=
1
N
g
∑
j
=
1
N
g
|
i
−
j
|
2
P
(
i
,
j
)
Get Radiology Tree app to read full this article<
correlation=∑Ngi=1∑Ngj=1ijP(i,j)−μi(i)μj(j)σx(i)σy(j) correlation
=
∑
i
=
1
N
g
∑
j
=
1
N
g
i
j
P
(
i
,
j
)
−
μ
i
(
i
)
μ
j
(
j
)
σ
x
(
i
)
σ
y
(
j
)
Get Radiology Tree app to read full this article<
entropy=−∑Ngi=1∑Ngj=1P(i,j)log[P(i,j)] entropy
=
−
∑
i
=
1
N
g
∑
j
=
1
N
g
P
(
i
,
j
)
log
[
P
(
i
,
j
)
]
Get Radiology Tree app to read full this article<
energy=∑Ngi=1∑Ngj=1[P(i,j)]2 energy
=
∑
i
=
1
N
g
∑
j
=
1
N
g
[
P
(
i
,
j
)
]
2
Get Radiology Tree app to read full this article<
homogeneity=∑Ngi=1∑Ngj=1P(i,j)1+|i−j|2 homogeneity
=
∑
i
=
1
N
g
∑
j
=
1
N
g
P
(
i
,
j
)
1
+
|
i
−
j
|
2
Get Radiology Tree app to read full this article<
Get Radiology Tree app to read full this article<
Get Radiology Tree app to read full this article<
SRE=∑Ngi=1∑Nrj=1[p(i,j|θ)j2]∑Ngi=1∑Nrj=1p(i,j|θ) SRE
=
∑
i
=
1
N
g
∑
j
=
1
N
r
[
p
(
i
,
j
|
θ
)
j
2
]
∑
i
=
1
N
g
∑
j
=
1
N
r
p
(
i
,
j
|
θ
)
Get Radiology Tree app to read full this article<
LRE=∑Ngi=1∑Nrj=1j2p(i,j|θ)∑Ngi=1∑Nrj=1p(i,j|θ) LRE
=
∑
i
=
1
N
g
∑
j
=
1
N
r
j
2
p
(
i
,
j
|
θ
)
∑
i
=
1
N
g
∑
j
=
1
N
r
p
(
i
,
j
|
θ
)
Get Radiology Tree app to read full this article<
GLN=∑Ngi=1[∑Nrj=1p(i,j|θ)]2∑Ngi=1∑Nrj=1p(i,j|θ) GLN
=
∑
i
=
1
N
g
[
∑
j
=
1
N
r
p
(
i
,
j
|
θ
)
]
2
∑
i
=
1
N
g
∑
j
=
1
N
r
p
(
i
,
j
|
θ
)
Get Radiology Tree app to read full this article<
RLN=∑Nrj=1[∑Ngi=1p(i,j|θ)]2∑Ngi=1∑Nrj=1p(i,j|θ) RLN
=
∑
j
=
1
N
r
[
∑
i
=
1
N
g
p
(
i
,
j
|
θ
)
]
2
∑
i
=
1
N
g
∑
j
=
1
N
r
p
(
i
,
j
|
θ
)
Get Radiology Tree app to read full this article<
RP=∑Ngi=1∑Nrj=1p(i,j|θ)Np RP
=
∑
i
=
1
N
g
∑
j
=
1
N
r
p
(
i
,
j
|
θ
)
N
p
Get Radiology Tree app to read full this article<
LGLRE=∑Ngi=1∑Nrj=1[p(i,j|θ)i2]∑Ngi=1∑Nrj=1p(i,j|θ) LGLRE
=
∑
i
=
1
N
g
∑
j
=
1
N
r
[
p
(
i
,
j
|
θ
)
i
2
]
∑
i
=
1
N
g
∑
j
=
1
N
r
p
(
i
,
j
|
θ
)
Get Radiology Tree app to read full this article<
HGLRE=∑Ngi=1∑Nrj=1i2p(i,j|θ)∑Ngi=1∑Nrj=1p(i,j|θ) HGLRE
=
∑
i
=
1
N
g
∑
j
=
1
N
r
i
2
p
(
i
,
j
|
θ
)
∑
i
=
1
N
g
∑
j
=
1
N
r
p
(
i
,
j
|
θ
)
Get Radiology Tree app to read full this article<
SRLGLE=∑Ngi=1∑Nrj=1[p(i,j|θ)i2j2]∑Ngi=1∑Nrj=1p(i,j|θ) SRLGLE
=
∑
i
=
1
N
g
∑
j
=
1
N
r
[
p
(
i
,
j
|
θ
)
i
2
j
2
]
∑
i
=
1
N
g
∑
j
=
1
N
r
p
(
i
,
j
|
θ
)
Get Radiology Tree app to read full this article<
SRHGLE=∑Ngi=1∑Nrj=1[p(i,j|θ)i2j2]∑Ngi=1∑Nrj=1p(i,j|θ) SRHGLE
=
∑
i
=
1
N
g
∑
j
=
1
N
r
[
p
(
i
,
j
|
θ
)
i
2
j
2
]
∑
i
=
1
N
g
∑
j
=
1
N
r
p
(
i
,
j
|
θ
)
Get Radiology Tree app to read full this article<
LRLGLE=∑Ngi=1∑Nrj=1[p(i,j|θ)j2i2]∑Ngi=1∑Nrj=1p(i,j|θ) LRLGLE
=
∑
i
=
1
N
g
∑
j
=
1
N
r
[
p
(
i
,
j
|
θ
)
j
2
i
2
]
∑
i
=
1
N
g
∑
j
=
1
N
r
p
(
i
,
j
|
θ
)
Get Radiology Tree app to read full this article<
LRHGLE=∑Ngi=1∑Nrj=1p(i,j|θ)i2j2∑Ngi=1∑Nrj=1p(i,j|θ) LRHGLE
=
∑
i
=
1
N
g
∑
j
=
1
N
r
p
(
i
,
j
|
θ
)
i
2
j
2
∑
i
=
1
N
g
∑
j
=
1
N
r
p
(
i
,
j
|
θ
)
Get Radiology Tree app to read full this article<
Get Radiology Tree app to read full this article<
Get Radiology Tree app to read full this article<
Get Radiology Tree app to read full this article<
Get Radiology Tree app to read full this article<
Mean(Gabor)=1N∑Ni=1X(i) Mean
(
Gabor
)
=
1
N
∑
i
=
1
N
X
(
i
)
where N indicates the sum of image pixels and the X ( i ) presents the intensity i on the Gabor image.
Get Radiology Tree app to read full this article<
Get Radiology Tree app to read full this article<
Get Radiology Tree app to read full this article<
Get Radiology Tree app to read full this article<
Get Radiology Tree app to read full this article<
Get Radiology Tree app to read full this article<
Get Radiology Tree app to read full this article<
Get Radiology Tree app to read full this article<
References
1. Jemal A., Siegel R., Xu J., et. al.: Cancer statistics, 2010. CA Cancer J Clin 2010; 60: pp. 277-300.
2. Park Y.Y., Park E.S., Kim S.B., et. al.: Development and validation of a prognostic gene-expression signature for lung adenocarcinoma. PLoS ONE 2012; 7: e44225
3. Potti A., Mukherjee S., Petersen R., et. al.: A genomic strategy to refine prognosis in early-stage non-small-cell lung cancer. N Engl J Med 2006; 355: pp. 570-580.
4. Chen H.Y., Yu S.L., Chen C.H., et. al.: A five-gene signature and clinical outcome in non-small-cell lung cancer. N Engl J Med 2007; 356: pp. 11-20.
5. Zhang F., Zheng W., Ying L., et. al.: A nomogram to predict brain metastases of resected non-small cell lung cancer patients. Ann Surg Oncol 2016; 23: pp. 3033-3039.
6. Fernandes A.P., Capitanio A., Selenius M., et. al.: Expression profiles of thioredoxin family proteins in human lung cancer tissue: correlation with proliferation and differentiation. Histopathology 2009; 55: pp. 313-320.
7. Nomori H., Cong Y., Abe M., et. al.: Diffusion-weighted magnetic resonance imaging in preoperative assessment of non-small cell lung cancer. J Thorac Cardiovasc Surg 2015; 149: pp. 991-996.
8. Li C., Yang Y., Wei L., et. al.: An array-based approach to determine different subtype and differentiation of non-small cell lung cancer. Theranostics 2015; 5: pp. 62-70.
9. Iwano S., Ito R., Umakoshi H., et. al.: Evaluation of lung cancer by enhanced dual-energy CT: association between three-dimensional iodine concentration and tumour differentiation. Br J Radiol 2015; 88: pp. 20150224.
10. Klaeser B., Wiskirchen J., Wartenberg J., et. al.: PET/CT-guided biopsies of metabolically active bone lesions: applications and clinical impact. Eur J Nucl Med Mol Imaging 2010; 37: pp. 2027-2036.
11. Tatli S., Gerbaudo V.H., Mamede M., et. al.: Abdominal masses sampled at PET/CT-guided percutaneous biopsy: initial experience with registration of prior pet/ct images. Radiology 2010; 256: pp. 305-311.
12. Shen G., Jia Z., Deng H.: Apparent diffusion coefficient values of diffusion-weighted imaging for distinguishing focal pulmonary lesions and characterizing the subtype of lung cancer: a meta-analysis. Eur Radiol 2016; 26: pp. 556-566.
13. Park B., Kim H.K., Choi Y.S., et. al.: Prediction of pathologic grade and prognosis in mucoepidermoid carcinoma of the lung using (1)(8)F-FDG PET/CT. Korean J Radiol 2015; 16: pp. 929-935.
14. Lambin P., Rios-Velazquez E., Leijenaar R., et. al.: Radiomics: extracting more information from medical images using advanced feature analysis. Eur J Cancer 2012; 48: pp. 441-446.
15. Gillies R.J., Kinahan P.E., Hricak H.: Radiomics: images are more than pictures, they are data. Radiology 2016; 278: pp. 563-577.
16. Leijenaar R.T., Carvalho S., Hoebers F.J., et. al.: External validation of a prognostic CT-based radiomic signature in oropharyngeal squamous cell carcinoma. Acta Oncol 2015; 54: pp. 1423-1429.
17. Aerts H.J., Velazquez E.R., Leijenaar R.T., et. al.: Decoding tumour phenotype by noninvasive imaging using a quantitative radiomics approach. Nat Commun 2014; 5: pp. 4006.
18. Rios Velazquez E., Parmar C., Liu Y., et. al.: Somatic mutations drive distinct imaging phenotypes in lung cancer. Cancer Res 2017; 77: pp. 3922-3930.
19. Huang Y., Liu Z., He L., et. al.: Radiomics signature: a potential biomarker for the prediction of disease-free survival in early-stage (I or II) non-small cell lung cancer. Radiology 2016; 281: pp. 152234.
20. Coroller T.P., Grossmann P., Hou Y., et. al.: CT-based radiomic signature predicts distant metastasis in lung adenocarcinoma. Radiother Oncol 2015; 114: pp. 345-350.
21. Wu W., Parmar C., Grossmann P., et. al.: Exploratory study to identify radiomics classifiers for lung cancer histology. Front Oncol 2016; 6: pp. 71.
22. Goode R.K., Auclair P.L., Ellis G.L.: Mucoepidermoid carcinoma of the major salivary glands: clinical and histopathologic analysis of 234 cases with evaluation of grading criteria. Cancer 1998; 82: pp. 1217-1224.
23. Parmar C., Grossmann P., Bussink J., et. al.: Machine learning methods for quantitative radiomic biomarkers. Sci Rep 2015; 5: pp. 13087.
24. Huang Y.Q., Liang C.H., He L., et. al.: Development and validation of a radiomics nomogram for preoperative prediction of lymph node metastasis in colorectal cancer. J Clin Oncol 2016; 34: pp. 2157-2164.
25. Sterlacci W., Tzankov A., Veits L., et. al.: The prognostic impact of sex on surgically resected non-small cell lung cancer depends on clinicopathologic characteristics. Am J Clin Pathol 2011; 135: pp. 611-618.
26. Ou S.H., Ziogas A., Zell J.A.: A comparison study of clinicopathologic characteristics of Southern California Asian American Non-small Cell Lung Cancer (NSCLC) patients by smoking status. J Thorac Oncol 2010; 5: pp. 158-168.
27. Sun Z., Aubry M.C., Deschamps C., et. al.: Histologic grade is an independent prognostic factor for survival in non-small cell lung cancer: an analysis of 5018 hospital- and 712 population-based cases. J Thorac Cardiovasc Surg 2006; 131: pp. 1014-1020.
28. Tang X.: Texture information in run-length matrices. IEEE Trans Image Process 1998; 7: pp. 1602-1609.
29. Swensen S.J., Viggiano R.W., Midthun D.E., et. al.: Lung nodule enhancement at CT: multicenter study. Radiology 2000; 214: pp. 73-80.
30. Spira D., Neumeister H., Spira S.M., et. al.: Assessment of tumor vascularity in lung cancer using volume perfusion CT (VPCT) with histopathologic comparison: a further step toward an individualized tumor characterization. J Comput Assist Tomogr 2013; 37: pp. 15-21.
31. Lambin P., Leijenaar R.T.H., Deist T.M., et. al.: Radiomics: the bridge between medical imaging and personalized medicine. Nat Rev Clin Oncol 2017; 14: pp. 749-762.
32. Limkin E.J., Sun R., Dercle L., et. al.: Promises and challenges for the implementation of computational medical imaging (radiomics) in oncology. Ann Oncol 2017; 28: pp. 1191-1206.
33. Ng F., Kozarski R., Ganeshan B., et. al.: Assessment of tumor heterogeneity by CT texture analysis: can the largest cross-sectional area be used as an alternative to whole tumor analysis?. Eur J Radiol 2013; 82: pp. 342-348.
34. Lubner M.G., Stabo N., Lubner S.J., et. al.: CT textural analysis of hepatic metastatic colorectal cancer: pre-treatment tumor heterogeneity correlates with pathology and clinical outcomes. Abdom Imaging 2015; 40: pp. 2331-2337.