
Rationale and Objectives
To evaluate a computer-aided diagnosis (CADx) system for the characterization of liver lesions in computed tomography (CT) scans. The stand-alone predictive performance of the CADx system was assessed and compared to that of three radiologists who were provided with the same amount of image information to which the CADx system had access.
Materials and Methods
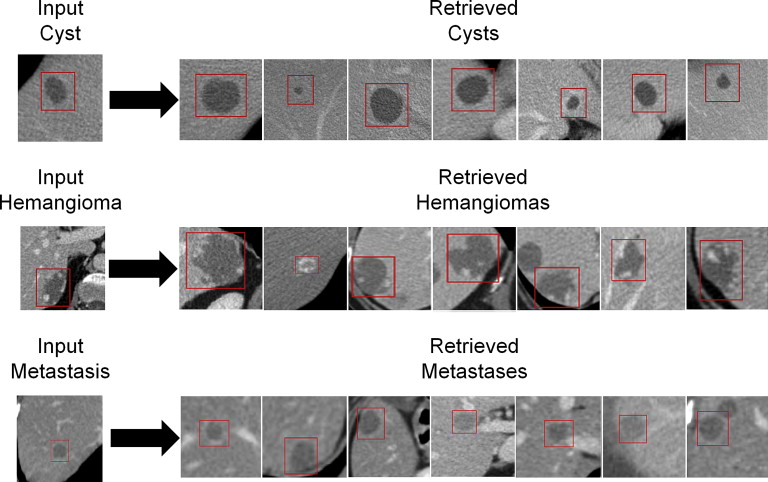
The CADx system operates as an image search engine exploiting texture analysis of liver lesion image data for the lesion in question and lesions from a database. A region of interest drawn around an indeterminate liver lesion is used as input query. The CADx system retrieves lesions of similar histology (benign/malignant), density (hypodense/hyperdense), or type (cyst/hemangioma/metastasis). The system’s performance was evaluated with leave-one-patient-out receiver operating characteristic area under the curve on 685 CT scans from 372 patients that contained 2325 liver lesions (193 <1 cm³). Sensitivity, specificity, and positive and negative predictive values were evaluated separately for subcentimeter lesions. Results were compared to those of three radiologists who rated 83 liver lesions (20 hemangiomas, 20 metastases, 20 cysts, 20 hepatocellular carcinomas, and 3 focal nodular hyperplasias) displaying only the liver.
Results
The CADx system’s leave-one-patient-out receiver operating characteristic area under the curve was 97.1% for density, 91.4% for histology, and 95.5% for lesion type. For subcentimeter lesions, input of additional semantic information improved the system’s performance. The CADx system has been proved to significantly outperform radiologists in discriminating lesion histology and type, provided the radiologists have no access to information other than the image. The radiologists were most reliable in diagnosing hemangioma given the limited image data.
Conclusions
The CADx system under study discriminated reliably between various liver lesions, even outperforming radiologists when accessing the same image information and demonstrated promising performance in classifying subcentimeter lesions in particular.
Despite intense efforts to cure or to control cancer through advances in imaging, surgery, chemotherapy, and radiation therapy, treatment of most malignancies continues to be challenging. This is reflected, for example, by the fact that in the past 5 years, overall cancer deaths in the European Union (EU) have only decreased by 10% in men and 7% in women, and for liver cancer in particular, no decrease in the rates is expected in 2013 . Most patients die not because of the growth of the primary cancer but because of its spread to other sites. Various types of malignant primary tumors spread to the liver, which is the second most common site for cancer metastases. Liver metastases have been proved to significantly worsen the survival rate compared to patients without hepatic involvement . Furthermore, the confirmed presence of liver metastases compels the crucial choice of a suitable treatment, such as chemotherapy, surgery, radiofrequency ablation (RFA), transarterial chemoembolization (TACE), or selective internal radiotherapy treatment (SIRT). Despite their pivotal importance, liver lesions are at risk of being missed by clinicians in images of the most commonly used modalities . Not only detection but also characterization and risk assessment are difficult, particularly for small lesions, further hindering prompt and personalized patient management.
Focal liver lesions are usually detected in routine computed tomography (CT) scans. Different types of liver lesions often display similar image features and general appearance, and both hypodense and hyperdense lesions may have various benign and malignant differential diagnoses. Therefore, correctly classifying liver lesions is a challenging task that requires medical expertise, training, concentration, and time. In the era of thin slice imaging, radiological reading has become even more time consuming . With the rapid advances in the related technology, smaller, even subcentimeter, lesions can be identified on the scans; their characterization, however, remains challenging—many of them would be called indeterminate . It is well known that the interpretation of findings may suffer from interreader variability and is prone to error , especially when benign and malignant lesions display similar visual appearances . As demonstrated by Ganeshan et al , computer-based texture analysis might be one approach to assist in the diagnosis of such indeterminate hepatic lesions. Recently, Napel et al suggested a radiological image search to improve the diagnosis of indeterminate liver lesions in CT examinations.
Get Radiology Tree app to read full this article<
Get Radiology Tree app to read full this article<
 Open full size image
Figure 1
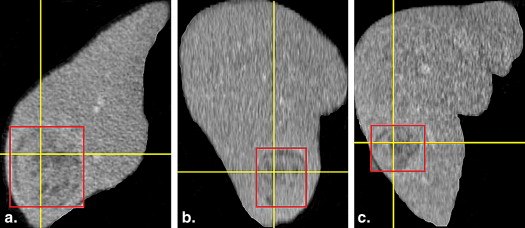
Radiological work flow using the computer-aided diagnosis (CADx) system: The radiologist detects an indeterminate liver lesion in a computed tomography (CT) scan and seeks computer assistance in discrimination. He then draws a region of interest (ROI) around the lesion and inputs this lesion image from a CT scan into the CADx system. The radiologist has the option to input additional semantic information describing the lesions (e.g., focality or rim continuity) as part of the query and then determines in which context he or she wishes to have discrimination support (e.g., lesion type) The investigated system is based on texture analysis, a database of annotated liver lesions, and a training process, which from a technical standpoint relies on a random forest similarity model and content-based image retrieval algorithms (in the image, blue represents benign lesions, while red represents malignant lesions) and operates much like a radiological image search engine. The system analyzes the image features of the input liver lesion (here, a malignant lesion, red ROI) and compares the input lesion’s features with the features of already classified database liver lesions. The CADx system then retrieves and displays annotated database lesions most similar to the input lesion in the given context. Both the images and the associated records and files of the retrieved patients are presented.
Get Radiology Tree app to read full this article<
Materials and methods
Get Radiology Tree app to read full this article<
Data Acquisition and Scan Technique
Get Radiology Tree app to read full this article<
Get Radiology Tree app to read full this article<
Lesions in the Study
Get Radiology Tree app to read full this article<
Table 1
Breakdown of the Underlying Database of 2325 Liver Lesions from the Evaluated Computer-Aided Diagnosis System
Liver Lesions ≥1 cm 3 Liver Lesions <1 cm 3 Lesion density Hyperdense 353 46 Hypodense 1779 147 Lesion histology Benign 716 104 Malignant 1416 89 Lesion type Benign primary liver tumors 35 8 Malignant primary liver tumors 38 15 Cysts 449 91 Hemangiomas 229 5 Metastases 1381 74 Total number of lesions 2132 193
Get Radiology Tree app to read full this article<
Get Radiology Tree app to read full this article<
CADx System
Get Radiology Tree app to read full this article<
Get Radiology Tree app to read full this article<
Get Radiology Tree app to read full this article<
Get Radiology Tree app to read full this article<
Evaluation
Get Radiology Tree app to read full this article<
Get Radiology Tree app to read full this article<
Get Radiology Tree app to read full this article<
Get Radiology Tree app to read full this article<
Get Radiology Tree app to read full this article<
Get Radiology Tree app to read full this article<
Get Radiology Tree app to read full this article<
Get Radiology Tree app to read full this article<
Get Radiology Tree app to read full this article<
Results
CADx
Get Radiology Tree app to read full this article<
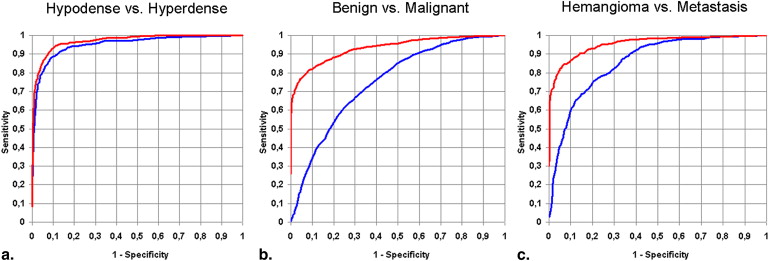
Table 2
Retrieval Accuracy of the Computer-Aided Diagnosis System for All Investigated Liver Lesions (Leave-One-Patient-Out Receiver Operating Characteristic Area under the Curve)
Retrieval Accuracy Input of Image Input of Image + Input of High-Level Semantic Features Lesion density 95.2% (98.7%) 97.1% (98.5%) Lesion histology 75.1% (73.3%) 91.4% (84.6%) Lesion type 85.8% (81.9%) 95.5% (92.7%)
Retrieval accuracy for liver lesions <1 cm 3 is shown in parentheses.
Get Radiology Tree app to read full this article<
Get Radiology Tree app to read full this article<
Get Radiology Tree app to read full this article<
Get Radiology Tree app to read full this article<
Get Radiology Tree app to read full this article<
Radiologists
Get Radiology Tree app to read full this article<
Get Radiology Tree app to read full this article<
Get Radiology Tree app to read full this article<
Get Radiology Tree app to read full this article<
Discussion and conclusion
Get Radiology Tree app to read full this article<
Get Radiology Tree app to read full this article<
Get Radiology Tree app to read full this article<
Get Radiology Tree app to read full this article<
Get Radiology Tree app to read full this article<
Get Radiology Tree app to read full this article<
Get Radiology Tree app to read full this article<
Get Radiology Tree app to read full this article<
Get Radiology Tree app to read full this article<
Get Radiology Tree app to read full this article<
Get Radiology Tree app to read full this article<
Get Radiology Tree app to read full this article<
Get Radiology Tree app to read full this article<
Get Radiology Tree app to read full this article<
Get Radiology Tree app to read full this article<
Get Radiology Tree app to read full this article<
Supplementary Data
Get Radiology Tree app to read full this article<
Appendix
Get Radiology Tree app to read full this article<
References
1. Malvezzi M., Bertuccio P., Levi F., et. al.: European cancer mortality predictions for the year 2012. Ann Oncol 2012; 23: pp. 1044-1052.
2. Lencioni R., Cioni D., Bartolozzi C.: Focal liver lesions: detection, characterization, ablation.1st ed.2005.SpringerBerlin/Heidelberg, Germany, New York, NY
3. Andriole K.P., Wolfe J.M., Khorasani R., et. al.: Optimizing analysis, visualization, and navigation of large image data sets: one 5000-section CT scan can ruin your whole day. Radiology 2011; 259: pp. 346-362.
4. Taylor S.A., Halligan S., Burling D., et. al.: CT colonography: effect of experience and training on reader performance. Eur Radiol 2004; 14: pp. 1025-1033.
5. Anders K., Ropers U., Kuettner A., et. al.: Individually adapted, interactive multiplanar reformations vs. semi-automated coronary segmentation and curved planar reformations for stenosis detection in coronary computed tomography angiography. Eur J Radiol 2011; 80: pp. 89-95.
6. Singh S., Maxwell J., Baker J.A., et. al.: Computer-aided classification of breast masses: performance and interobserver variability of expert radiologists versus residents. Radiology 2011; 258: pp. 73-80.
7. Singh S., Pinsky P., Fineberg N.S., et. al.: Evaluation of reader variability in the interpretation of follow-up CT scans at lung cancer screening. Radiology 2011; 259: pp. 263-270.
8. Robinson P.J.: Radiology’s Achilles’ heel: error and variation in the interpretation of the Röntgen image. Br J Radiol 1997; 70: pp. 1085-1098.
9. Baker M.E., Bogoni L., Obuchowski N.A.: Computer-aided detection of colorectal polyps: can it improve sensitivity of less-experienced readers? Preliminary findings. Radiology 2007; 245: pp. 140-149.
10. Costa MJ, Tsymbal A., Hammon M, et al. A discriminative distance learning-based CBIR framework for characterization of indeterminate liver lesions. Lect Notes Comput Sci 2012; 7075:92–104.
11. Ganeshan B., Burnand K., Young R., et. al.: Dynamic contrast-enhanced texture analysis of the liver: initial assessment in colorectal cancer. Invest Radiol 2011; 46: pp. 160-168.
12. Napel S.A., Beaulieu C.F., Rodriguez C.: Automated retrieval of CT images of liver lesions on the basis of image similarity: method and preliminary results. Radiology 2012; 256: pp. 243-252.
13. A. Tsymbal, M. Huber, Zhou SK. Learning discriminative distance functions for case retrieval and decision support. Proceedings of Industrial Conference on Data Mining–Workshops. 2012; 65–80.
14. Krüger-Brand H.E.: Wissensmanagement: Web 3.0 im Dienst der Medizin. Dtsch Arztebl 2009; 106: pp. 458.
15. Hanley J.A., McNeil B.J.: The meaning and use of the area under a receiver operating characteristic (ROC) curve. Radiology 1982; 143: pp. 29-36.
16. Chen E.-L., Chung P.-C., Chen C.-L., et. al.: An automatic diagnostic system for CT liver image classification. IEEE Trans Biomed Eng 1998; 45: pp. 783-794.
17. Nino-Murcia M., Olcott E.W., Jeffrey R.B., et. al.: Focal Liver Lesions: Pattern-based Classification Scheme for Enhancement at Arterial Phase CT1. Radiology 2000; 215: pp. 746-751.
18. Gletsos M., Mougiakakou S.G., Matsopoulos G.K., et. al.: A computer-aided diagnostic system to characterize CT focal liver lesions: design and optimization of a neural network classifier. IEEE Transactions on Information Technology in Biomedicine 2003; 7: pp. 153-162.
19. Bilello M., Gokturk S.B., Desser T., et. al.: Automatic detection and classification of hypodense hepatic lesions on contrast-enhanced venous-phase CT. Med Phys 2004; 31: pp. 2584-2593.
20. Mougiakakou S.G., Valavanis I.K., Nikita A., et. al.: Differential diagnosis of CT focal liver lesions using texture features, feature selection and ensemble driven classifiers. Artif Intell Med 2007; 41: pp. 25-37.
21. Ye Jun, Yan A., Shuquing W., et. al.: Multi-phase CT image based hepatic lesion diagnosis by SVM. 2009. Proc Biomed Eng Inform 2009; pp. 1-5.
22. Yang W., Lu Z., Yu M., et. al.: Content-based retrieval of focal liver lesions using bag-of-visual-words representations of single- and multiphase contrast-enhanced CT images. J Digit Imaging 2012; 25: pp. 708-719.
23. Seltzer S.E., Getty D.J., Pickett R.M., et. al.: Multimodality diagnosis of liver tumors. Acad Radiol 2002; 9: pp. 256-269.
24. van Ginneken B., Schaefer-Prokop C.M., Prokop M.: Computer-aided diagnosis: how to move from the laboratory to the clinic. Radiology 2011; 261: pp. 719-732.
25. Depeursinge A., Fischer B., Müller H., et. al.: Prototypes for content-based image retrieval in clinical practice. Open Med Inform 2011; 5: pp. 58-72.
26. Doi K.: Computer-aided diagnosis in medical imaging: historical review, current status and future potential. Comput Med Imaging Graph 2007; 31: pp. 198-211.
27. Akgül C.B., Rubin D.L., Napel S., et. al.: Content-based image retrieval in radiology: current status and future directions. J Digit Imaging 2011; 24: pp. 208-222.
28. Krupinski E.A.: Computer-aided detection in clinical environment: benefits and challenges for radiologists. Radiology 2004; 231: pp. 7-9.
29. Korenblum D., Rubin D., Napel S., et. al.: Managing biomedical image metadata for search and retrieval of similar images. J Digital Imaging 2011; 24: pp. 739-748.
30. Robinson P.J., Arnold P., Wilson D.: Small indeterminate lesions on CT of the liver: a follow-up study of stability. Br J Radiol 2003; 76: pp. 866-874.
31. Kim K.W., Kim A.Y., Kim T.K., et. al.: Small (<or= 2 cm) hepatic lesions in colorectal cancer patients: detection and characterization on mangafodipir trisodium-enhanced MRI. AJR Am J Roentgenol 2004; 182: pp. 1233-1240.
32. Mueller G.C., Hussain H.K., Carlos R.C., et. al.: Effectiveness of MR imaging in characterizing small hepatic lesions: routine versus expert interpretation. AJR Am J Roentgenol 2003; 180: pp. 673-680.
33. Patterson S.A., Khalil H.I., Panicek D.M.: MRI evaluation of small hepatic lesions in women with breast cancer. AJR Am J Roentgenol 2006; 187: pp. 307-312.