
Rationale and Objectives
We propose a novel single index for the quantification of emphysema severity based on an aggregation of multiple computed tomographic features evident in the lung parenchyma of smokers. Our goal was to demonstrate that this single index provides complementary information to the current standard measure of emphysema, percent emphysema (percent low attenuation areas [ LAA %]), and may be superior in its association with clinically relevant outcomes.
Materials and Methods
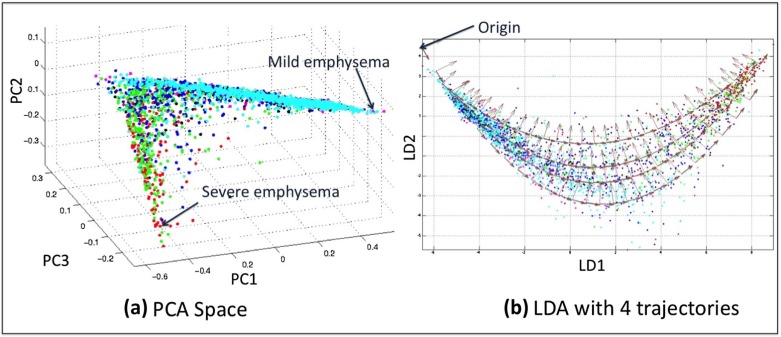
The inputs to our algorithm were objective assessments of multiple emphysema subtypes (normal tissue; panlobular; paraseptal; and mild, moderate, and severe centrilobular emphysema). We applied dimensionality reduction techniques to the emphysema quantities to find a space that maximizes the variance of these subtypes. A single emphysema severity index was then derived from a parametrization of the reduced space, and the clinical utility of the measure was explored in a large cross-sectional cohort of 8914 subjects from the COPDGene Study.
Results
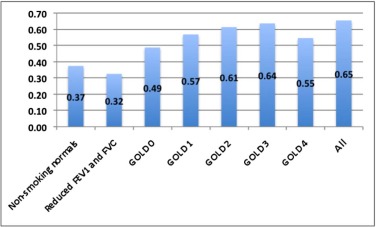
There was a statistically significant association between the severity index and the LAA %. Subjects with more severe chronic obstructive pulmonary disease (higher Global initiative for Obstructive Lung Disease stage) tended to have a higher computed tomography severity index. Finally, the severity index was associated with clinical outcomes such as lung function and provided a stronger association to these measures than the LAA %.
Conclusions
The method provides a single clinically relevant index that can assess the severity of emphysema and that provides information that is complimentary to the more commonly used LAA %.
Introduction
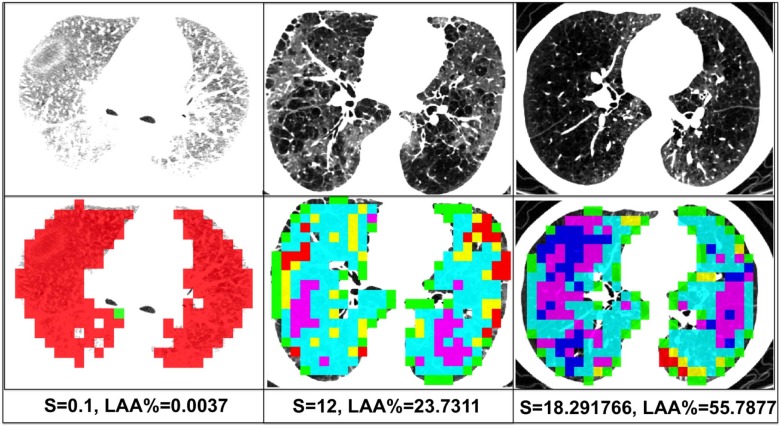
Chronic obstructive pulmonary disease (COPD) is characterized by emphysematous destruction of the lung parenchyma. Objective quantification of this process is an important part of disease characterization. Standard methods to do this are based upon a densitometric assessment of the lung parenchyma where a Hounsfield unit threshold is used to delineate emphysematous from nonemphysematous tissue. This measure can be expressed as a fraction but is most commonly reported as the percent low attenuation areas ( LAA %) . Although easy to use for correlative investigation, the LAA % does not fully assess the heterogeneous nature of emphysema or its subtypes.
The clinical significance of six features that capture the prevalence of emphysema subtypes (normal tissue [NT]; paraseptal; panlobular; and mild, moderate, and severe centrilobular emphysema) has been previously demonstrated. It has also been shown that these features provide complementary information to LAA % . However, it becomes increasingly difficult to perform regression analysis as the number of features increases. In addition, it is difficult to appreciate how a variable mixture of these features results in the same level of disease severity. It would therefore be useful to aggregate these multiple features into a single measure without losing information about the individual subtypes. However, currently available methods for the quantification of emphysema on computed tomography (CT) images either do not quantify severity based on emphysema subtypes or suffer from low performance and inter-scanner variability.
Get Radiology Tree app to read full this article<
Materials and Methods
Population
Get Radiology Tree app to read full this article<
Get Radiology Tree app to read full this article<
Get Radiology Tree app to read full this article<
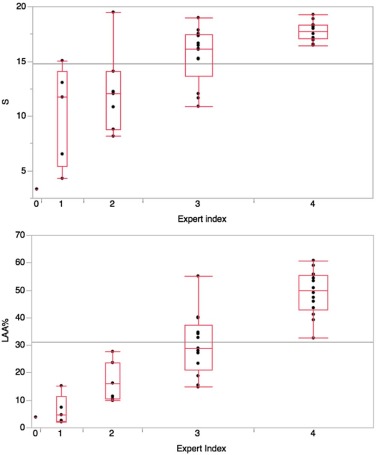
Table 1
Distribution of S and LAA % Across GOLD Stages
Nonsmoking Normal Subjects Reduced FEV 1 and FVC GOLD 0 GOLD 1 GOLD 2 GOLD 3 GOLD 4 Variable Train Test Train Test Train Test Train Test Train Test Train Test Train Test n = 0 n = 102 n = 213 n = 804 n = 931 n = 2788 n = 203 n = 505 n = 491 n = 1171 n = 315 n = 660 n = 172 n = 292 Men/Women — 33/69 103/110 359/445 449/482 1487/1301 105/98 259/246 184/307 537/634 72/243 198/462 16/156 34/258 Age at enrollment — 60.7 ± 10.3 60.7 ± 8.9 60.1 ± 9.2 58.9 ± 9.1 59.5 ± 9.2 59.4 ± 9.2 58.9 ± 8.7 59.6 ± 8.8 59.7 ± 9.2 60.7 ± 9.0 60.5 ± 9.0 61.2 ± 8.7 61.2 ± 9.1 BMI (kg/m 2 ) — 28.4 ± 5.1 31.2 ± 7.3 31.5 ± 7.1 28.5 ± 5.8 29.0 ± 5.7 26.7 ± 4.9 27.0 ± 4.8 28.9 ± 6.0 28.7 ± 6.1 27J ± 6.2 28.1 ± 6.3 25.2 ± 5.5 24.9 ± 5.5 Current smoker — 0/102 114/99 519/285 489/442 1666/1122 119/84 315/190 296/195 739/432 244/71 499/161 154/18 263/29 Total lung capacity — 5.4 ± 1.2 4.6 ± 1.1 4.5 ± 1.1 5.4 ± 1.3 5.4 ± 1.3 6.2 ± 1.5 6.1 ± 1.4 5.7 ± 1.4 5.8 ± 1.4 6.1 ± 1.4 6.3 ± 1.5 6.6 ± 1.4 7.0 ± 1.5LAA % — 1.9 ± 2.5 1.7 ± 1.9 1.4 ± 2.4 2.6 ± 2.9 1.8 ± 2.4 6.7 ± 6.3 4.7 ± 5.3 8.4 ± 7.9 6.6 ± 7.5 18.0 ± 12.7 15.2 ± 12.2 27.7 ± 13.7 26.4 ± 14.2FEV 1pp — 103.0 ± 13.7 70.6 ± 8.0 70.7 ± 7.9 98.0 ± 11.8 97.5 ± 11.4 91.4 ± 9.3 90.6 ± 8.9 64.9 ± 8.6 65.3 ± 8.4 40.0 ± 5.7 40.4 ± 5.7 22A ± 4.8 23.0 ± 4.6 ATS pack-years — 39.5 ± 21.0 48.4 ± 28.1 43.7 ± 24.9 43.1 ± 24.4 44.0 ± 25.1 44.8 ± 24.2 44.7 ± 24.8 43.5 ± 23.0 46.2 ± 26.6 43.8 ± 24.9 45.4 ± 25.9 46.4 ± 26.5 45.3 ± 27.2
BMI, body mass index; FEV 1 , forced expiratory volume in 1 second; FVC, forced vital capacity; GOLD, Global Initiative for Obstructive Lung Disease; LAA %, percent low attenuation areas.
Get Radiology Tree app to read full this article<
Get Radiology Tree app to read full this article<
CT Protocols
Get Radiology Tree app to read full this article<
Emphysema Subtype Features
Get Radiology Tree app to read full this article<
Get Radiology Tree app to read full this article<
Severity Index From CT Image Information
Get Radiology Tree app to read full this article<
Get Radiology Tree app to read full this article<
Get Radiology Tree app to read full this article<
Get Radiology Tree app to read full this article<
Get Radiology Tree app to read full this article<
Statistical Analysis
Get Radiology Tree app to read full this article<
Get Radiology Tree app to read full this article<
Get Radiology Tree app to read full this article<
Get Radiology Tree app to read full this article<
Get Radiology Tree app to read full this article<
in the models for distance walked and SGRQ, and adjusted for age, gender, race, height, smoking status, and number of pack-years in the model for FEV 1 .
Get Radiology Tree app to read full this article<
Results
Analysis of Severity
Get Radiology Tree app to read full this article<
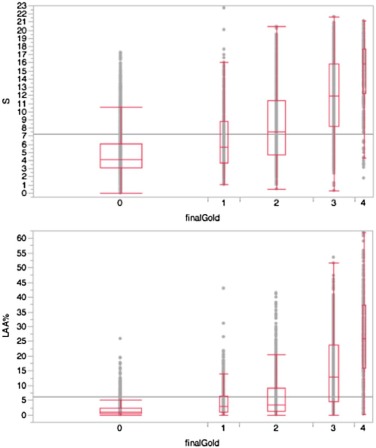
Table 2
Statistics for S and LAA % Across GOLD Stages
Statistic Emphysema Measure Nonsmoking Normal Subjects Reduced FEV 1 and FVC GOLD 0 GOLD 1 GOLD 2 GOLD 3 GOLD 4 Mean_S_ 4.38 5.30 4.92 6.55 8.36 11.87 14.76LAA % 1.92 1.36 1.81 4.74 6.55 15.16 26.36 Minimum_S_ 0.61 0.15 −0.02 1.04 0.50 0.29 1.81LAA % 0.02 0.00 0.00 0.02 0.02 0.02 0.13 Maximum_S_ 14.96 19.63 17.27 22.70 20.41 21.65 21.13LAA % 13.24 33.80 25.88 42.95 41.44 53.50 61.91 Coefficient of variation_S_ 65.16 54.84 55.89 55.14 51.80 39.32 27.26LAA % 129.63 177.92 131.96 112.51 114.81 80.31 53.80
FEV 1 , forced expiratory volume in 1 second; FVC, forced vital capacity; GOLD, Global Initiative for Obstructive Lung Disease; LAA %, percent low attenuation areas.
Get Radiology Tree app to read full this article<
Get Radiology Tree app to read full this article<
Get Radiology Tree app to read full this article<
Get Radiology Tree app to read full this article<
Get Radiology Tree app to read full this article<
Associations With Outcomes
Get Radiology Tree app to read full this article<
Get Radiology Tree app to read full this article<
Get Radiology Tree app to read full this article<
Table 3
Univariate Regression Models for each of the Outcomes. Either S or LAA % Is Used in each Model
Outcome Variable in Model Adjusted R-Squared Coeff. of Variation Parameter Estimate Standard Error Pr > |t|FEV 1 S 0.2382 34.08072 −0.09773 0.00222 <0.0001LAA % 0.2215 34.45309 −0.04721 0.00112 <0.0001 Six-minute walk S 0.1004 26.24787 −8.19542 0.31094 <0.0001LAA % 0.0674 26.72477 −3.36491 0.15859 <0.0001 SGRQ S 0.1138 80.33368 1.69611 0.05997 <0.0001LAA % 0.0993 80.99069 0.79356 0.03029 <0.0001
FEV 1 , forced expiratory volume in 1 second; LAA %, percent low attenuation areas; SGRQ, St. George’s Respiratory Questionnaire.
Get Radiology Tree app to read full this article<
Get Radiology Tree app to read full this article<
Table 4
Multivariate Regression Models for each of the Outcomes Controlling for Covariates
Outcome Adjusted R-Squared Coeff. of Variation Variable Parameter Estimate Standard Error Pr > |t|FEV 1 0.5868 25.09844 S −0.04202 0.0029 <0.0001LAA % −0.02687 0.0014 <0.0001 Six-minute walk 0.3259 22.72081 S −1.75754 0.5125 0.0006LAA % −1.09679 0.2639 <0.0001 SGRQ 0.3491 68.85068 S 0.44639 0.09786 <0.0001LAA % 0.2555 0.05039 <0.0001
FEV 1 , forced expiratory volume in 1 second; LAA%, percent low attenuation areas; SGRQ, St. George’s Respiratory Questionnaire.
Get Radiology Tree app to read full this article<
Discussion
Get Radiology Tree app to read full this article<
Get Radiology Tree app to read full this article<
Get Radiology Tree app to read full this article<
Get Radiology Tree app to read full this article<
Get Radiology Tree app to read full this article<
Get Radiology Tree app to read full this article<
Conclusions
Get Radiology Tree app to read full this article<
Acknowledgments
Get Radiology Tree app to read full this article<
Appendix
Supplementary material
Get Radiology Tree app to read full this article<
Appendix S1
Get Radiology Tree app to read full this article<
References
1. Muller N.L., Staples C.A., Miller R.R., et. al.: “Density mask”. An objective method to quantitate emphysema using computed tomography. Chest 1988; 94: pp. 782-787.
2. Mendoza C.S., Washko G.R., Ross J.C., et. al.: Emphysema quantification in a multi-scanner hrct cohort using local intensity distributions. Proc IEEE Int Symp Biomed Imaging 2012; 88: pp. 474-477.
3. Hara T., Yamamoto A., Zhou X., et. al.: Automated detection system for pulmonary emphysema on 3D chest CT images. Proc SPIE Int Soc Opt Eng 2004; 5370: pp. 915-919.
4. Xu Y., Sonka M., McLennan G., et. al.: MDCT-based 3-D texture classification of emphysema and early smoking related lung pathologies. IEEE Trans Med Imaging 2006; 25: pp. 464-475.
5. Uppaluri R., Mitsa T., Sonka M., et. al.: Quantification of pulmonary emphysema from lung computed tomography images. Am J Respir Crit Care Med 1997; 156: pp. 248-254.
6. Depeursinge A., Sage D., Hidki A., et. al.: Lung tissue classification using wavelet frames. Conf Proc IEEE Eng Med Biol Soc 2007; 2007: pp. 6259-6262.
7. Park Y., Seo J.B., Kim N., et. al.: Texture-based quantification of pulmonary emphysema on high-resolution computed tomography: comparison with density-based quantification and correlation with pulmonary function test. Invest Radiol 2008; 43: pp. 395-402.
8. Dharmagunawardhana C., Mahmoodi S., Bennett M., et. al.: Quantitative analysis of pulmonary emphysema using isotropic Gaussian Markov random fields.9th International Conference on Computer Vision Theory and Applications.2014.pp. 44-53.
9. Hame Y., Elsa A., Hoffman E., et. al.: Adaptive quantification and longitudinal analysis of pulmonary emphysema with a hidden Markov measure field model. EEE Trans Med Imaging 2014; 33: pp. 1527-1540.
10. Duda R.O., Hart P.E., Stork D.G., et. al.: Pattern classification.2nd ed.2001.
11. Regan E., Hokanson J., Murphy J., et. al.: Genetic epidemiology of COPD (COPDGene) study design. COPD 2010; 7: pp. 32-43.
12. Standardization of spirometry, 1994 update. American Thoracic Society. Am J Respir Crit Care Med1995.pp. 1107-1136. 152
13. Jones P.W., Quirk F.H., Baveystock C.M.: The St. George’s Respiratory Questionnaire. Respir Med 1991; 85: pp. 25-31.
14. Diaz A., Han M.K., Come C.E., et. al.: Effect of emphysema on CT scan measures of airway dimensions in smokers. Chest 2013; 143: pp. 687-693.
15. Jolliffe I.T.: Principal component analysis.Lovric M.International encyclopedia of statistical science.2011.SpringerNew York:pp. 1094-1096.
16. McLachlan G.J.: Discriminant analysis and statistical pattern recognition, Wiley series in probability and mathematical statistics.1992.J. Wiley and SonsNew York, Chichester, Brisbane
17. Martinez C.H., Chen Y.-H., Westgate P.M., et. al.: Relationship between quantitative CT metrics and health status and bode in chronic obstructive pulmonary disease. Thorax 2012; 67: pp. 399-406.
18. Rambod M., Porszasz J., Make B.J., et. al.: Six-minute walk distance predictors, including CT scan measures, in the COPDGene cohort. Chest 2012; 141: pp. 867-875.
19. Cho M.H., Castaldi P.J., Hersh C.P., et. al.: A genome-wide association study of emphysema and airway quantitative imaging phenotypes. Am J Respir Crit Care Med 2015; 192: pp. 559-569.