
Rationale and Objectives
The aim of this study was to assess the feasibility of 18 F-fluorodeoxyglucose (FDG)-positron emission tomography/computed tomography (PET/CT) to systematically detect and quantify differential effects of chronic tobacco use in organs of the whole body.
Materials and Methods
Twenty healthy male subjects (10 nonsmokers and 10 chronic heavy smokers) were enrolled. Subjects underwent whole-body FDG-PET/CT, diagnostic unenhanced chest CT, mini-mental state examination, urine testing for oxidative stress, and serum testing. The organs of interest (thyroid, skin, skeletal muscle, aorta, heart, lung, adipose tissue, liver, spleen, brain, lumbar spinal bone marrow, and testis) were analyzed on FDG-PET/CT images to determine their metabolic activities using standardized uptake value (SUV) or metabolic volumetric product (MVP). Measurements were compared between subject groups using two-sample t tests or Wilcoxon rank-sum tests as determined by tests for normality. Correlational analyses were also performed.
Results
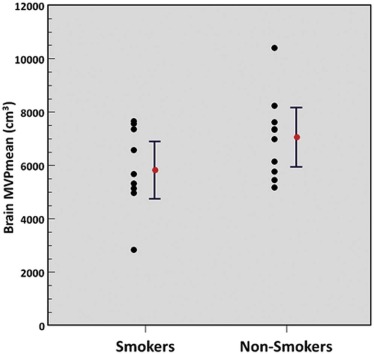
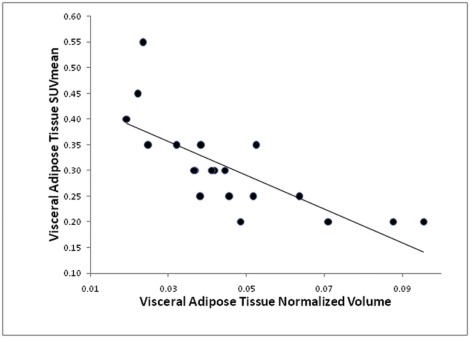
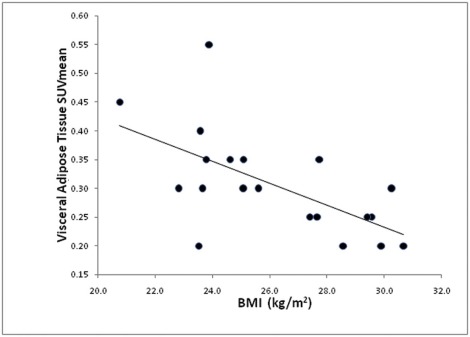
FDG-PET/CT revealed significantly decreased metabolic activity of lumbar spinal bone marrow (MVPmean: 29.8 ± 9.7 cc vs 40.8 ± 11.6 cc, P = 0.03) and liver (SUVmean: 1.8 ± 0.2 vs 2.0 ± 0.2, P = 0.049) and increased metabolic activity of visceral adipose tissue (SUVmean: 0.35 ± 0.10 vs 0.26 ± 0.06, P = 0.02) in chronic smokers compared to nonsmokers. Normalized visceral adipose tissue volume was also significantly decreased ( P = 0.04) in chronic smokers. There were no statistically significant differences in the metabolic activity of other assessed organs.
Conclusions
Subclinical organ effects of chronic tobacco use are detectable and quantifiable on FDG-PET/CT. FDG-PET/CT may, therefore, play a major role in the study of systemic toxic effects of tobacco use in organs of the whole body for clinical or research purposes.
Introduction
Smoking is one of the most important sources of toxic exposure in humans, and is a major cause of morbidity and mortality worldwide. It is associated with a wide variety of disease conditions that affect multiple organ systems of the body secondary to increased levels of cellular oxidative stress, receptor binding, genetic mutations, and release of proinflammatory chemical substances. However, the subclinical metabolic and proinflammatory effects of chronic tobacco use have not been systematically assessed body wide at the organ level in humans, largely due to the lack of available robust quantitative diagnostic techniques for this purpose. The ability to detect and to quantify the severity of the subclinical organ effects of chronic tobacco use may be important to determine individualized risk for development of various disease conditions, to foster smoking cessation, and to monitor the effects of interventions utilized to mitigate the adverse effects of smoking.
18 F-2-fluorodeoxyglucose (FDG)-positron emission tomography (PET)/computed tomography (CT) is a molecular imaging technique that is available for accurate quantitative assessment of cellular metabolism in the whole body. Although FDG-PET/CT is predominantly used to assess patients with cancer in clinical practice, it is also useful to noninvasively detect and quantify inflammation, infection, and other etiologies of altered tissue metabolism in organs of the body . As such, it is reasonable to hypothesize that FDG-PET/CT can be used to assess the subclinical metabolic and proinflammatory effects of smoking. Yet, to our knowledge, no human studies with FDG-PET/CT have been performed to systematically study the effects of chronic tobacco use upon organs of the whole body. Therefore, in this pilot study, we assessed the feasibility of FDG-PET/CT to quantitatively assess the differential metabolic and inflammatory changes in organs of the whole body in relation to chronic tobacco use.
Materials and Methods
Get Radiology Tree app to read full this article<
Study Sample
Get Radiology Tree app to read full this article<
Get Radiology Tree app to read full this article<
Get Radiology Tree app to read full this article<
Get Radiology Tree app to read full this article<
Whole-body FDG-PET/CT and Thoracic Diagnostic CT Image Acquisition
Get Radiology Tree app to read full this article<
Get Radiology Tree app to read full this article<
Nonimaging-based Assessments
Get Radiology Tree app to read full this article<
Get Radiology Tree app to read full this article<
Whole-body FDG-PET/CT and Thoracic Diagnostic CT Image Analysis
Get Radiology Tree app to read full this article<
Get Radiology Tree app to read full this article<
Get Radiology Tree app to read full this article<
Get Radiology Tree app to read full this article<
Get Radiology Tree app to read full this article<
Statistical Analysis
Get Radiology Tree app to read full this article<
Results
Get Radiology Tree app to read full this article<
Get Radiology Tree app to read full this article<
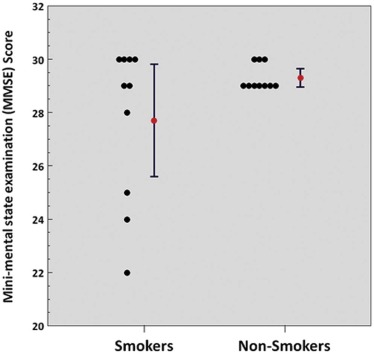
TABLE 1
Subject MMSE and Urinary Laboratory Test Results Based on Smoking Status
Open full size image
MMSE, mini-mental state examination.
Results are displayed as mean ± standard deviation with significant P values (<0.05) in the last column highlighted in gray.
Get Radiology Tree app to read full this article<
Get Radiology Tree app to read full this article<
Get Radiology Tree app to read full this article<
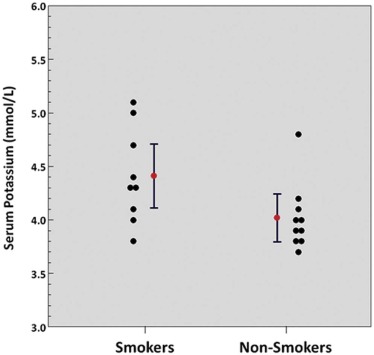
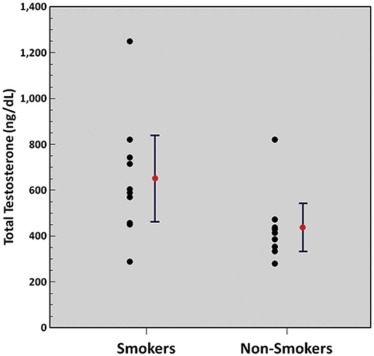
TABLE 2
Subject Serum Laboratory Test Results Based on Smoking Status
 Open full size image
Results are displayed as mean ± standard deviation with significant P values (<0.05) in the last column highlighted in gray.
Get Radiology Tree app to read full this article<
Get Radiology Tree app to read full this article<
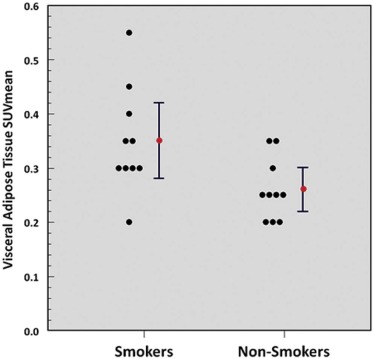
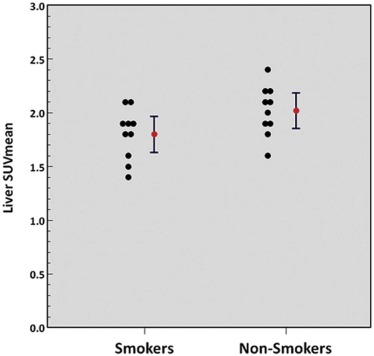
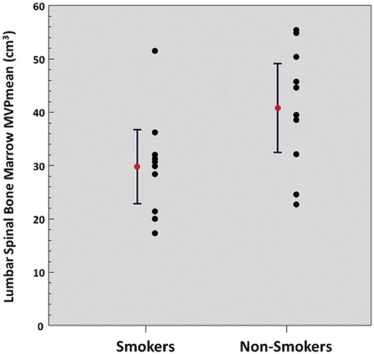
TABLE 3
Subject Organ Properties Measured on PET/CT and Diagnostic Thoracic CT Based on Smoking Status
Open full size image
cSUVmean, partial volume corrected mean standardized uptake value; MVPmean, mean metabolic volumetric product; PET/CT, positron emission tomography/computed tomography; SAT, subcutaneous adipose tissue; SUVmean, mean standardized uptake value; VAT, visceral adipose tissue.
Results are displayed as mean ± standard deviation with significant P values (<0.05) in the last column highlighted in gray.
Get Radiology Tree app to read full this article<
Get Radiology Tree app to read full this article<
Get Radiology Tree app to read full this article<
Discussion
Get Radiology Tree app to read full this article<
Get Radiology Tree app to read full this article<
Get Radiology Tree app to read full this article<
Get Radiology Tree app to read full this article<
Get Radiology Tree app to read full this article<
Get Radiology Tree app to read full this article<
Get Radiology Tree app to read full this article<
Get Radiology Tree app to read full this article<
Get Radiology Tree app to read full this article<
Conclusion
Get Radiology Tree app to read full this article<
Get Radiology Tree app to read full this article<
Acknowledgments
Get Radiology Tree app to read full this article<
Get Radiology Tree app to read full this article<
References
1. Kwee T.C., Torigian D.A., Alavi A.: Overview of positron emission tomography, hybrid positron emission tomography instrumentation, and positron emission tomography quantification. J Thorac Imaging 2013; 28: pp. 4-10.
2. Kwee T.C., Torigian D.A., Alavi A.: Oncological applications of positron emission tomography for evaluation of the thorax. J Thorac Imaging 2013; 28: pp. 11-24.
3. Kwee T.C., Torigian D.A., Alavi A.: Nononcological applications of positron emission tomography for evaluation of the thorax. J Thorac Imaging 2013; 28: pp. 25-39.
4. Heatherton T.F., Kozlowski L.T., Frecker R.C., et. al.: The Fagerstrom Test for Nicotine Dependence: a revision of the Fagerstrom Tolerance Questionnaire. Br J Addict 1991; 86: pp. 1119-1127.
5. Pomerleau C.S., Carton S.M., Lutzke M.L., et. al.: Reliability of the Fagerstrom Tolerance Questionnaire and the Fagerstrom Test for Nicotine Dependence. Addict Behav 1994; 19: pp. 33-39.
6. Tombaugh T.N., McIntyre N.J.: The mini-mental state examination: a comprehensive review. J Am Geriatr Soc 1992; 40: pp. 922-935.
7. Hofheinz F., Dittrich S., Potzsch C., et. al.: Effects of cold sphere walls in PET phantom measurements on the volume reproducing threshold. Phys Med Biol 2010; 55: pp. 1099-1113.
8. Torigian D.A., Lopez R.F., Alapati S., et. al.: Feasibility and performance of novel software to quantify metabolically active volumes and 3D partial volume corrected SUV and metabolic volumetric products of spinal bone marrow metastases on 18F-FDG-PET/CT. Hell J Nucl Med 2011; 14: pp. 8-14.
9. Hofheinz F., Langner J., Petr J., et. al.: A method for model-free partial volume correction in oncological PET. EJNMMI Res 2012; 2: pp. 16.
10. Grevera G., Udupa J., Odhner D., et. al.: CAVASS: a computer-assisted visualization and analysis software system. J Digit Imaging 2007; 20: pp. 101-118.
11. Udupa J.K., Odhner D., Zhao L., et. al.: Body-wide hierarchical fuzzy modeling, recognition, and delineation of anatomy in medical images. Med Image Anal 2014; 18: pp. 752-771.
12. Torigian D.A., Dam V., Chen X., et. al.: In vivo quantification of pulmonary inflammation in relation to emphysema severity via partial volume corrected F-FDG-PET using computer-assisted analysis of diagnostic chest CT. Hell J Nucl Med 2013; 16: pp. 12-18.
13. Falcao A.X., Udupa J.K., Miyazawa F.K.: An ultra-fast user-steered image segmentation paradigm: live wire on the fly. IEEE Trans Med Imaging 2000; 19: pp. 55-62.
14. Tong Y., Udupa J.K., Torigian D.A.: Optimization of abdominal fat quantification on CT imaging through use of standardized anatomic space: a novel approach. Med Phys 2014; 41: 063501-1-11
15. Tong Y., Udupa J.K., Wu C., et. al.: Fat segmentation on chest CT images via fuzzy models. Proc SPIE 2016; 9786: 978609-1-6
16. World Health Organization fact sheet. Available at: http://www.who.int/mediacentre/factsheets/fs339/en/
17. World Health Organization report on the global tobacco epidemic. Enforcing bans on tobacco advertising, promotion and sponsorship; Available at: http://www.who.int/tobacco/global_report/2013/en/
18. Centers for Disease Control and Prevention fact sheet, current cigarette smoking among adults in the United States. Available at: http://www.cdc.gov/tobacco/data_statistics/fact_sheets/adult_data/cig_smoking/index.htm
19. Yanbaeva D.G., Dentener M.A., Creutzberg E.C., et. al.: Systemic effects of smoking. Chest 2007; 131: pp. 1557-1566.
20. Metelitsa A.I., Lauzon G.J.: Tobacco and the skin. Clin Dermatol 2010; 28: pp. 384-390.
21. Khanna A.K., Xu J., Uber P.A., et. al.: Tobacco smoke exposure in either the donor or recipient before transplantation accelerates cardiac allograft rejection, vascular inflammation, and graft loss. Circulation 2009; 120: pp. 1814-1821.
22. Samet J.M.: Tobacco smoking: the leading cause of preventable disease worldwide. Thorac Surg Clin 2013; 23: pp. 103-112.
23. DeMarini D.M.: Genotoxicity of tobacco smoke and tobacco smoke condensate: a review. Mutat Res 2004; 567: pp. 447-474.
24. Hammond D., O’Connor R.J.: Constituents in tobacco and smoke emissions from Canadian cigarettes. Tob Control 2008; 17: pp. i24-i31.
25. National Center for Chronic Disease Prevention and Health Promotion (US); Office on Smoking and Health (US) : How tobacco smoke causes disease: the biology and behavioral basis for smoking-attributable disease: a report of the surgeon general.2010.Centers for Disease Control and Prevention (US)Atlanta, GA Available at: http://www.ncbi.nlm.nih.gov/books/NBK53017/
26. Vanfleteren L.E., van Meerendonk A.M., Franssen F.M., et. al.: A possible link between increased metabolic activity of fat tissue and aortic wall inflammation in subjects with COPD. A retrospective 18F-FDG-PET/CT pilot study. Respir Med 2014; 108: pp. 883-890.
27. Christen T., Sheikine Y., Rocha V.Z., et. al.: Increased glucose uptake in visceral versus subcutaneous adipose tissue revealed by PET imaging. JACC Cardiovasc Imaging 2010; 3: pp. 843-851.
28. Wang Q.: Smoking and body weight: evidence from China Health and Nutrition Survey. BMC Public Health 2015; 15: pp. 1238.
29. Molenaar E.A., Massaro J.M., Jacques P.F., et. al.: Association of lifestyle factors with abdominal subcutaneous and visceral adiposity: the Framingham Heart Study. Diabetes Care 2009; 32: pp. 505-510.
30. Stadler M., Tomann L., Storka A., et. al.: Effects of smoking cessation on beta-cell function, insulin sensitivity, body weight, and appetite. Eur J Endocrinol 2014; 170: 219-7
31. Chen H., Vlahos R., Bozinovski S., et. al.: Effect of short-term cigarette smoke exposure on body weight, appetite and brain neuropeptide Y in mice. Neuropsychopharmacology 2005; 30: pp. 713-719.
32. Yoshida T., Yoshioka K., Hiraoka N., et. al.: Effect of nicotine on norepinephrine turnover and thermogenesis in brown adipose tissue and metabolic rate in MSG obese mice. J Nutr Sci Vitaminol (Tokyo) 1990; 36: pp. 123-130.
33. McEvoy J.W., Nasir K., DeFilippis A.P., et. al.: Relationship of cigarette smoking with inflammation and subclinical vascular disease: the Multi-Ethnic Study of Atherosclerosis. Arterioscler Thromb Vasc Biol 2015; 35: pp. 1002-1010.
34. Shiels M.S., Katki H.A., Freedman N.D., et. al.: Cigarette smoking and variations in systemic immune and inflammation markers. J Natl Cancer Inst 2014; 106: pp. 1-8.
35. Chiolero A., Faeh D., Paccaud F., et. al.: Consequences of smoking for body weight, body fat distribution, and insulin resistance. Am J Clin Nutr 2008; 87: pp. 801-809.
36. Onat A., Ayhan E., Hergenc G., et. al.: Smoking inhibits visceral fat accumulation in Turkish women: relation of visceral fat and body fat mass to atherogenic dyslipidemia, inflammatory markers, insulin resistance, and blood pressure. Metabolism 2009; 58: pp. 963-970.
37. Pak K., Kim S.J., Kim I.J., et. al.: Hepatic FDG uptake is not associated with hepatic steatosis but with visceral fat volume in cancer screening. Nucl Med Mol Imaging 2012; 46: pp. 176-181.
38. Beyth S., Mosheiff R., Safran O., et. al.: Cigarette smoking is associated with a lower concentration of CD105(+) bone marrow progenitor cells. Bone Marrow Res 2015; 2015: pp. 914935.
39. Zhou J., Eksioglu E.A., Fortenbery N.R., et. al.: Bone marrow mononuclear cells up-regulate toll-like receptor expression and produce inflammatory mediators in response to cigarette smoke extract. PLoS ONE 2011; 6: pp. e21173.
40. Fernandez-Ferrero S., Ramos F.: Dyshaemopoietic bone marrow features in healthy subjects are related to age. Leuk Res 2001; 25: pp. 187-189.
41. Wannamethee S.G., Lever A.F., Shaper A.G., et. al.: Serum potassium, cigarette smoking, and mortality in middle-aged men. Am J Epidemiol 1997; 145: pp. 598-606.
42. Kung C.M., Wang H.L., Tseng Z.L.: Cigarette smoking exacerbates health problems in young men. Clin Invest Med 2008; 31: pp. E138-E149.
43. Wagner M., Schulze-Rauschenbach S., Petrovsky N., et. al.: Neurocognitive impairments in non-deprived smokers–results from a population-based multi-center study on smoking-related behavior. Addict Biol 2013; 18: pp. 752-761.
44. Durazzo T.C., Meyerhoff D.J., Nixon S.J.: Chronic cigarette smoking: implications for neurocognition and brain neurobiology. Int J Environ Res Public Health 2010; 7: pp. 3760-3791.
45. Wang C., Xu X., Qian W., et. al.: Altered human brain anatomy in chronic smokers: a review of magnetic resonance imaging studies. Neurol Sci 2015; 36: pp. 497-504.
46. Karama S., Ducharme S., Corley J., et. al.: Cigarette smoking and thinning of the brain’s cortex. Mol Psychiatry 2015; 20: pp. 778-785.
47. Durazzo T.C., Meyerhoff D.J., Mon A., et. al.: Chronic cigarette smoking in healthy middle-aged individuals is associated with decreased regional brain n-acetylaspartate and glutamate levels. Biol Psychiatry 2015; 79: pp. 481-488.
48. Costello M.R., Mandelkern M.A., Shoptaw S., et. al.: Effects of treatment for tobacco dependence on resting cerebral glucose metabolism. Neuropsychopharmacology 2010; 35: pp. 605-612.
49. Schroeder T., Vidal Melo M.F., Musch G., et. al.: PET imaging of regional 18F-FDG uptake and lung function after cigarette smoke inhalation. J Nucl Med 2007; 48: pp. 413-419.
50. Jones H.A., Marino P.S., Shakur B.H., et. al.: In vivo assessment of lung inflammatory cell activity in patients with COPD and asthma. Eur Respir J 2003; 21: pp. 567-573.
51. Jones H.A., Clark R.J., Rhodes C.G., et. al.: In vivo measurement of neutrophil activity in experimental lung inflammation. Am J Respir Crit Care Med 1994; 149: pp. 1635-1639.
52. Jones H.A., Cadwallader K.A., White J.F., et. al.: Dissociation between respiratory burst activity and deoxyglucose uptake in human neutrophil granulocytes: implications for interpretation of (18)F-FDG PET images. J Nucl Med 2002; 43: pp. 652-657.
53. Jacene H.A., Patel P.P., Chin B.B.: 2-Deoxy-2-[18F] fluoro-D-glucose uptake in intercostal respiratory muscles on positron emission tomography/computed tomography: smokers versus nonsmokers. Mol Imaging Biol 2004; 6: pp. 405-410.
54. Osman M.M., Tran I.T., Muzaffar R., et. al.: Does (1)(8)F-FDG uptake by respiratory muscles on PET/CT correlate with chronic obstructive pulmonary disease?. J Nucl Med Technol 2011; 39: pp. 252-257.
55. Basu S., Alzeair S., Li G., et. al.: Etiopathologies associated with intercostal muscle hypermetabolism and prominent right ventricle visualization on 2-deoxy-2[F-18]fluoro-D-glucose-positron emission tomography: significance of an incidental finding and in the setting of a known pulmonary disease. Mol Imaging Biol 2007; 9: pp. 333-339.
56. Aydin A., Hickeson M., Yu J.Q., et. al.: Demonstration of excessive metabolic activity of thoracic and abdominal muscles on FDG-PET in patients with chronic obstructive pulmonary disease. Clin Nucl Med 2005; 30: pp. 159-164.
57. Duarte P.S., Zhuang H., Machado C., et. al.: Increased FDG uptake in the right cardiac chambers in a patient with pulmonary emphysema. Clin Nucl Med 2002; 27: pp. 605-606.
58. Coulson J.M., Rudd J.H., Duckers J.M., et. al.: Excessive aortic inflammation in chronic obstructive pulmonary disease: an 18F-FDG PET pilot study. J Nucl Med 2010; 51: pp. 1357-1360.