
Rationale and Objectives
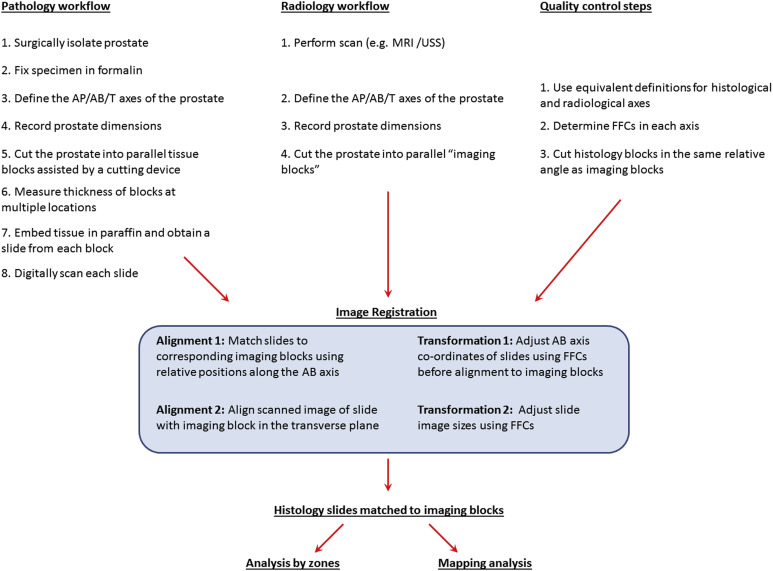
Evaluation of prostate imaging tests against whole-mount histology specimens requires accurate alignment between radiologic and histologic data sets. Misalignment results in false-positive and -negative zones as assessed by imaging. We describe a workflow for three-dimensional alignment of prostate imaging data against whole-mount prostatectomy reference specimens and assess its performance against a standard workflow.
Materials and Methods
Ethical approval was granted. Patients underwent motorized transrectal ultrasound (Prostate Histoscanning) to generate a three-dimensional image of the prostate before radical prostatectomy. The test workflow incorporated steps for axial alignment between imaging and histology, size adjustments following formalin fixation, and use of custom-made parallel cutters and digital caliper instruments. The control workflow comprised freehand cutting and assumed homogeneous block thicknesses at the same relative angles between pathology and imaging sections.
Results
Thirty radical prostatectomy specimens were histologically and radiologically processed, either by an alignment-optimized workflow ( n = 20) or a control workflow ( n = 10). The optimized workflow generated tissue blocks of heterogeneous thicknesses but with no significant drifting in the cutting plane. The control workflow resulted in significantly nonparallel blocks, accurately matching only one out of four histology blocks to their respective imaging data. The image-to-histology alignment accuracy was 20% greater in the optimized workflow ( P < .0001), with higher sensitivity (85% vs. 69%) and specificity (94% vs. 73%) for margin prediction in a 5 × 5-mm grid analysis.
Conclusions
A significantly better alignment was observed in the optimized workflow. Evaluation of prostate imaging biomarkers using whole-mount histology references should include a test-to-reference spatial alignment workflow.
Measuring the accuracy of imaging biomarkers to localize prostate cancer is a complex task that involves correlating the match in the zonal distribution of lesions between the test imaging data and histopathologic reference. In most studies that use whole-mount radical prostatectomy specimens as “gold standard” references , important assumptions are that histologic and radiologic zonal boundaries are aligned to each other and that zonal assignment of lesions is accurate ( Fig 1 ). Such assumptions, however, would not hold if zonal boundaries are misaligned ( Fig 1 a,b), or histologic sectioning is variable ( Fig 1 c), both of which will reduce the overall accuracy results and undermine the internal validity of the study as set out in the Standards for the Diagnostic Accuracy Studies guidelines . There are no validated methods to assess the spatial alignment between imaging and histologic data and to ensure that misalignment is minimized.
 Open full size image
Figure 1
Problems associated with zonal correlation of lesions between whole-mount pathology with radiology data are shown schematically in sagittal illustrations of the prostate. Lesions are indicated as a blue spot . Blue or red lines indicate boundaries of zones or slices, respectively. In this example of a three-zone analysis, a lesion can lie either in the midzone alone or both to the midzone and apex, depending on how zonal boundaries are defined (a) . Hence, an imaging biomarker with 100% accuracy can still result in poor accuracy if zonal boundaries between pathology and imaging are not aligned (a) . In comparing step sections of pathology and radiology, differences in relative angles of sectioning lead to a similar result (b) . Errors in zonal assignment can also arise from incorrect assumptions regarding the quality of sectioning (c) . Lesions are usually assigned to zones by interpolating the findings of step sections. Hence, a lesion involving sections 2 and 3 can be localized to the midzone, if sections were all cut at a known thickness and in a plane perpendicular to the apical-basal axis. However, if sections were cut in parallel but with heterogeneous thicknesses, or in a nonparallel manner, assumptions of equal and parallel sections could result in lesions being mislocalized. (Color version of figure is available online.)
Get Radiology Tree app to read full this article<
Materials and methods
Patients
Get Radiology Tree app to read full this article<
Alignment-optimized Workflow
Get Radiology Tree app to read full this article<
Get Radiology Tree app to read full this article<
Imaging Analysis
Get Radiology Tree app to read full this article<
Get Radiology Tree app to read full this article<
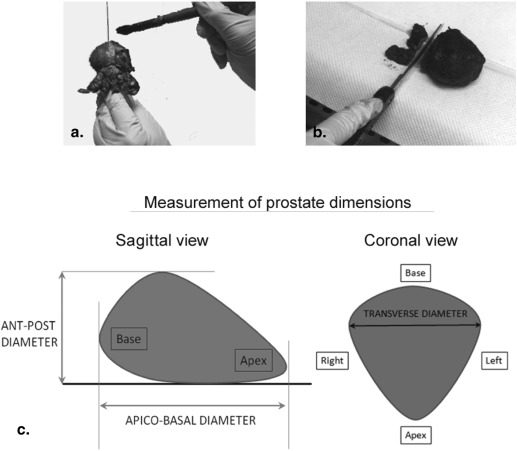
Formalin Fixation and Recording of Macroscopic Descriptions
Get Radiology Tree app to read full this article<
Get Radiology Tree app to read full this article<
Formalin Fixation Coefficients
Get Radiology Tree app to read full this article<
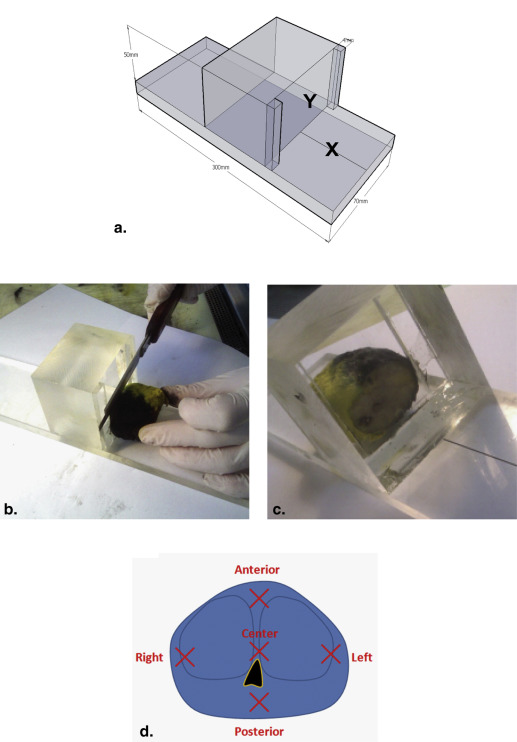
Generation of Tissue Sections
Get Radiology Tree app to read full this article<
Get Radiology Tree app to read full this article<
Assessment of Cutting Error Using the Tissue Planer
Get Radiology Tree app to read full this article<
Get Radiology Tree app to read full this article<
Get Radiology Tree app to read full this article<
Examination and Scanning of Pathologic Slides
Get Radiology Tree app to read full this article<
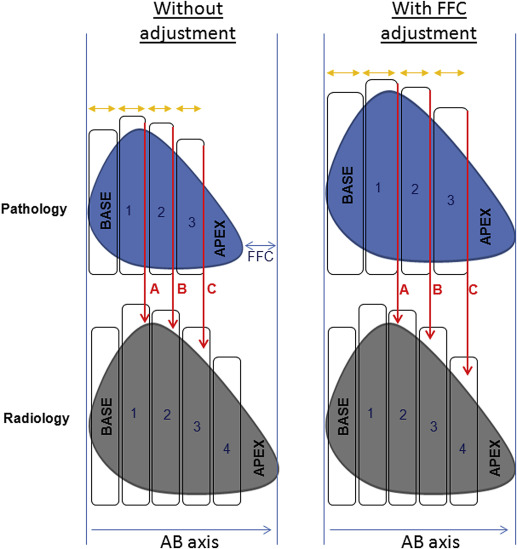
Alignment and Matching of Pathologic Slides to Imaging Blocks in the AB Axis
Get Radiology Tree app to read full this article<
Get Radiology Tree app to read full this article<
Alignment and Assessment of Overlay Accuracy between Pathologic Slides and Imaging Blocks in the Transverse Plane
Get Radiology Tree app to read full this article<
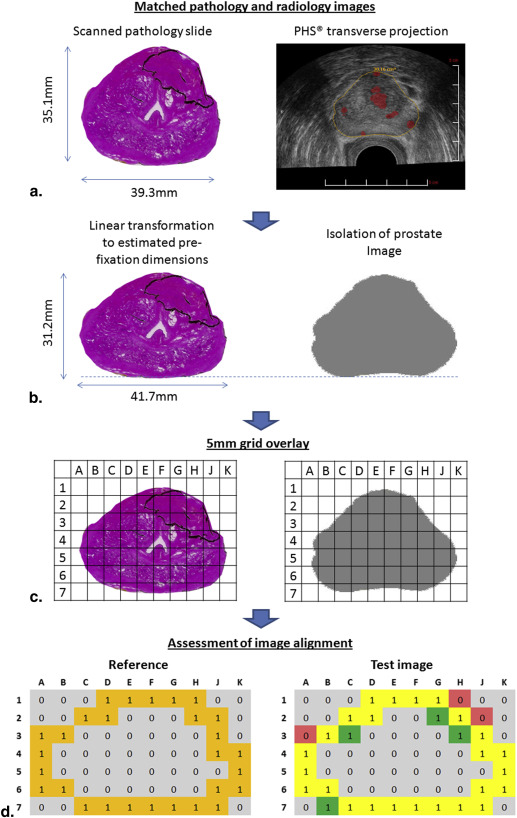
Get Radiology Tree app to read full this article<
Statistical Analysis
Get Radiology Tree app to read full this article<
Results
The Effect of Formalin Fixation on Prostate Dimensions and Volume
Get Radiology Tree app to read full this article<
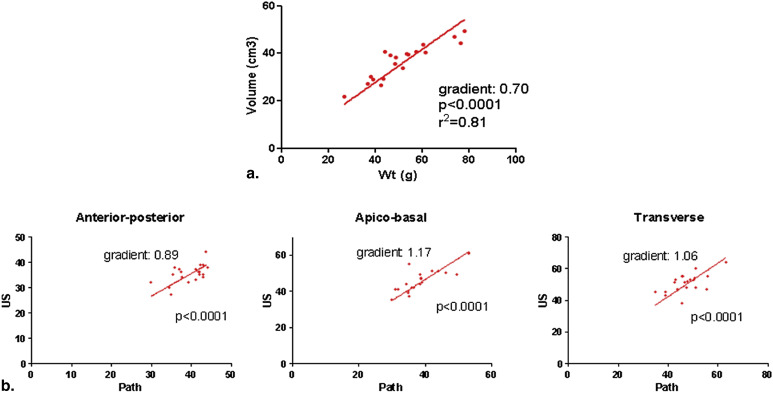
Get Radiology Tree app to read full this article<
Parallel Sectioning Accuracy of the Tissue Planer Versus Freehand Cutting
Get Radiology Tree app to read full this article<
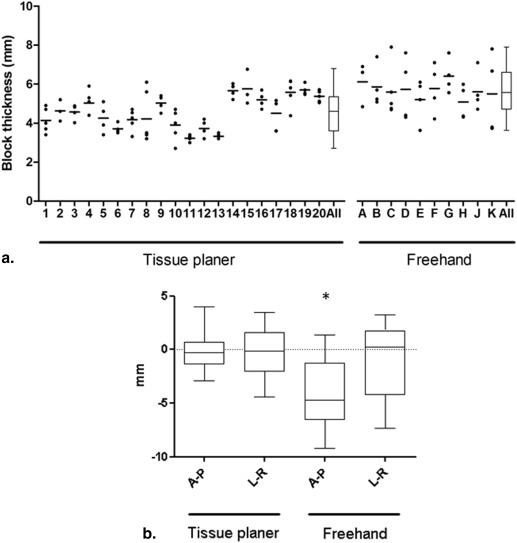
Get Radiology Tree app to read full this article<
Assessment of Alignment in the AB Axis
Get Radiology Tree app to read full this article<
Alignment in the Transverse Plane
Get Radiology Tree app to read full this article<
Table 1
Contingency Tables Comparing Margin Overlay Accuracy between Optimized and Control Alignment Workflows
Radiology, Margin Present Radiology, No Margin Optimized workflow—prostate sectioning by tissue planer, with alignment based on FFC-adjusted coordinates in all axes Histology, margin Present 1692 307 Histology, no margin 256 3737 Control workflow—freehand prostate sectioning, with alignment without FFC-adjusted coordinates Histology, margin present 571 256 Histology, no margin 526 1425
Get Radiology Tree app to read full this article<
Discussion
Get Radiology Tree app to read full this article<
Get Radiology Tree app to read full this article<
Get Radiology Tree app to read full this article<
Get Radiology Tree app to read full this article<
Get Radiology Tree app to read full this article<
Get Radiology Tree app to read full this article<
Get Radiology Tree app to read full this article<
Get Radiology Tree app to read full this article<
Conclusions
Get Radiology Tree app to read full this article<
Acknowledgments
Get Radiology Tree app to read full this article<
Get Radiology Tree app to read full this article<
Get Radiology Tree app to read full this article<
Get Radiology Tree app to read full this article<
Get Radiology Tree app to read full this article<
References
1. Rosenkrantz A.B., Mannelli L., Kong X., et. al.: Prostate cancer: utility of fusion of T2-weighted and high b-value diffusion-weighted images for peripheral zone tumor detection and localization. J Magn Reson Imaging 2011; 34: pp. 95-100.
2. Jackson A.S., Reinsberg S.A., Sohaib S.A., et. al.: Dynamic contrast-enhanced MRI for prostate cancer localization. Br J Radiol 2009; 82: pp. 148-156.
3. Hambrock T., Somford D.M., Huisman H.J., et. al.: Relationship between apparent diffusion coefficients at 3.0-T MR imaging and Gleason grade in peripheral zone prostate cancer. Radiology 2011; 259: pp. 453-461.
4. Delongchamps N.B., Rouanne M., Flam T., et. al.: Multiparametric magnetic resonance imaging for the detection and localization of prostate cancer: combination of T2-weighted, dynamic contrast-enhanced and diffusion-weighted imaging. BJU Int 2011; 107: pp. 1411-1418.
5. Vargas H.A., Akin O., Franiel T., et. al.: Diffusion-weighted endorectal MR imaging at 3 T for prostate cancer: tumor detection and assessment of aggressiveness. Radiology 2011; 259: pp. 775-784.
6. Bossuyt P.M., Reitsma J.B., Bruns D.E., et. al.: Towards complete and accurate reporting of studies of diagnostic accuracy: the STARD initiative. BMJ 2003; 326: pp. 41-44.
7. Ashburner J., Fristo K.J.: Chapter 2, “Rigid Body Registration”. Human brain function.2 ed.2004.Academic Press
8. Salomon G., Spethmann J., Beckmann A., et. al.: Accuracy of HistoScanning for the prediction of a negative surgical margin in patients undergoing radical prostatectomy. BJU Int 2013; 111: pp. 60-66.
9. Simmons L.A., Autier P., Zat’ura F., et. al.: Detection, localisation and characterisation of prostate cancer by prostate HistoScanning (™) . BJU Int 2012; 110: pp. 28-35.
10. Braeckman J., Autier P., Soviany C., et. al.: The accuracy of transrectal ultrasonography supplemented with computer-aided ultrasonography for detecting small prostate cancers. BJU Int 2008; 102: pp. 1560-1565.
11. Montironi R., van der Kwast T., Boccon-Gibod L., et. al.: Handling and pathology reporting of radical prostatectomy specimens. Eur Urol 2003; 44: pp. 626-636.
12. Dickinson L., Ahmed H.U., Allen C., et. al.: Magnetic resonance imaging for the detection, localisation, and characterisation of prostate cancer: recommendations from a European consensus meeting. Eur Urol 2011; 59: pp. 477-494.
13. Schatzkin A., Gail M.: The promise and peril of surrogate end points in cancer research. Nat Rev Cancer 2002; 2: pp. 19-27.
14. McClure T.D., Margolis D.J., Reiter R.E., et. al.: Use of MR imaging to determine preservation of the neurovascular bundles at robotic-assisted laparoscopic prostatectomy. Radiology 2012; 262: pp. 874-883.
15. Arumainayagam N., Ahmed H.U., Moore C.M., et. al.: Multiparametric MR imaging for detection of clinically significant prostate cancer: a validation cohort study with transperineal template prostate mapping as the reference standard. Radiology 2013; 268: pp. 761-769.
16. Bubley G.J., Bloch B.N., Vazquez C., et. al.: Accuracy of endorectal magnetic resonance/transrectal ultrasound fusion for detection of prostate cancer during brachytherapy. Urology 2013; 81: pp. 1284-1289.
17. Gangi A., Tsoumakidou G., Abdelli O., et. al.: Percutaneous MR-guided cryoablation of prostate cancer: initial experience. Eur Radiol 2012; 22: pp. 1829-1835.
18. Niaf E., Rouviere O., Mege-Lechevallier F., et. al.: Computer-aided diagnosis of prostate cancer in the peripheral zone using multiparametric MRI. Phys Med Biol 2012; 57: pp. 3833-3851.
19. Braeckman J., Autier P., Garbar C., et. al.: Computer-aided ultrasonography (HistoScanning): a novel technology for locating and characterizing prostate cancer. BJU Int 2008; 101: pp. 293-298.
20. Tamada T., Sone T., Jo Y., et. al.: Prostate cancer: relationships between postbiopsy hemorrhage and tumor detectability at MR diagnosis. Radiology 2008; 248: pp. 531-539.
21. Bloch B.N., Furman-Haran E., Helbich T.H., et. al.: Prostate cancer: accurate determination of extracapsular extension with high-spatial-resolution dynamic contrast-enhanced and T2-weighted MR imaging–initial results. Radiology 2007; 245: pp. 176-185.
22. Selnaes K.M., Heerschap A., Jensen L.R., et. al.: Peripheral zone prostate cancer localization by multiparametric magnetic resonance at 3 T: unbiased cancer identification by matching to histopathology. Invest Radiol 2012; 47: pp. 624-633.
23. Wu L.M., Xu J.R., Ye Y.Q., et. al.: The clinical value of diffusion-weighted imaging in combination with T2-weighted imaging in diagnosing prostate carcinoma: a systematic review and meta-analysis. AJR Am J Roentgenol 2012; 199: pp. 103-110.
24. Mowatt G., Scotland G., Boachie C., et. al.: The diagnostic accuracy and cost-effectiveness of magnetic resonance spectroscopy and enhanced magnetic resonance imaging techniques in aiding the localisation of prostate abnormalities for biopsy: a systematic review and economic evaluation. Health Technol Assess 2013; 17: pp. vii-xix. 1–281
25. Egevad L., Algaba F., Berney D.M., et. al.: Handling and reporting of radical prostatectomy specimens in Europe: a web-based survey by the European Network of Uropathology (ENUP). Histopathology 2008; 53: pp. 333-339.
26. Riches S.F., Payne G.S., Morgan V.A., et. al.: MRI in the detection of prostate cancer: combined apparent diffusion coefficient, metabolite ratio, and vascular parameters. AJR Am J Roentgenol 2009; 193: pp. 1583-1591.
27. Mena E., Turkbey B., Mani H., et. al.: 11C-Acetate PET/CT in localized prostate cancer: a study with MRI and histopathologic correlation. J Nucl Med 2012; 53: pp. 538-545.
28. Shah V., Turkbey B., Mani H., et. al.: Decision support system for localizing prostate cancer based on multiparametric magnetic resonance imaging. Med Phys 2012; 39: pp. 4093-4103.
29. Drew B., Jones E.C., Reinsberg S., et. al.: Device for sectioning prostatectomy specimens to facilitate comparison between histology and in vivo MRI. JMRI 2010; 32: pp. 992-996.
30. Jhavar S.G., Fisher C., Jackson A., et. al.: Processing of radical prostatectomy specimens for correlation of data from histopathological, molecular biological, and radiological studies: a new whole organ technique. J clin pathol 2005; 58: pp. 504-508.
31. Shah V., Pohida T., Turkbey B., et. al.: A method for correlating in vivo prostate magnetic resonance imaging and histopathology using individualized magnetic resonance-based molds. Rev Sci Instrum 2009; 80: pp. 104301.
32. Jager G.J., Ruijter E.T., van de Kaa C.A., et. al.: Local staging of prostate cancer with endorectal MR imaging: correlation with histopathology. AJR Am J Roentgenol 1996; 166: pp. 845-852.
33. Lencioni R., Menchi I., Paolicchi A., et. al.: Prediction of pathological tumor volume in clinically localized prostate cancer: value of endorectal coil magnetic resonance imaging. Magma 1997; 5: pp. 117-121.
34. Sommer F.G., Nghiem H.V., Herfkens R., et. al.: Determining the volume of prostatic carcinoma: value of MR imaging with an external-array coil. AJR Am J Roentgenol 1993; 161: pp. 81-86.
35. Schiebler M.L., Tomaszewski J.E., Bezzi M., et. al.: Prostatic carcinoma and benign prostatic hyperplasia: correlation of high-resolution MR and histopathologic findings. Radiology 1989; 172: pp. 131-137.
36. Kimm S.Y., Tarin T.V., Lee J.H., et. al.: Methods for registration of magnetic resonance images of ex vivo prostate specimens with histology. JMRI 2012; 36: pp. 206-212.
37. Hughes C., Rouviere O., Mege-Lechevallier F., et. al.: Robust alignment of prostate histology slices with quantified accuracy. IEEE Trans Biomed Eng 2013; 60: pp. 281-291.