
Rationale and Objectives
To introduce a simple magnetic resonance imaging (MRI) protocol for quantitative assessment of intraperitoneal, retroperitoneal, and subcutaneous adipose tissue (AT) and to compare AT distribution between diabetic and nondiabetic individuals.
Materials and Methods
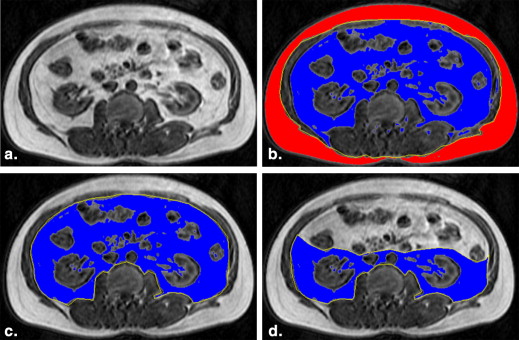
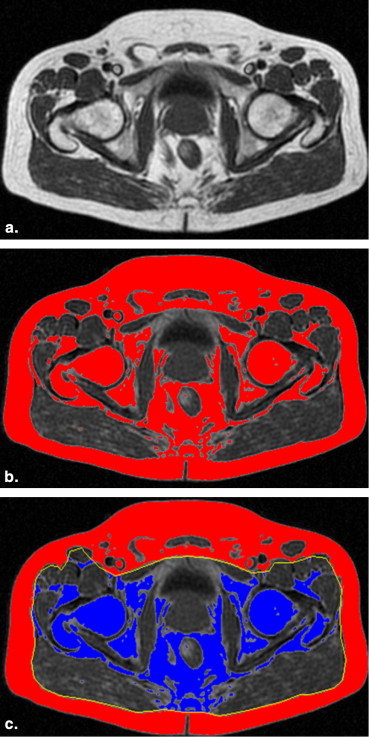
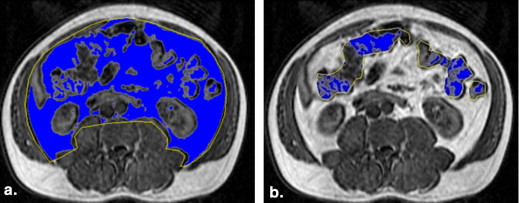
Thirty-eight consecutive male diabetic patients (group A) and 38 males (who matched for body mass index [BMI]) without metabolic syndrome (group B) underwent abdominal MRI with a three-dimensional spoiled gradient echo T1-weighted sequence. The amounts of intraperitoneal, retroperitoneal, and subcutaneous AT were calculated on a workstation, after manual anatomic segmentation and were correlated with 10 anthropometric measurements. Pearson product–moment correlation coefficients were used for correlation of AT volumes with anthropometric measurements, Wilcoxon test to compare AT measurements between automatic and manual technique used, and unpaired t test to compare volumes of AT compartments between group A and B.
Results
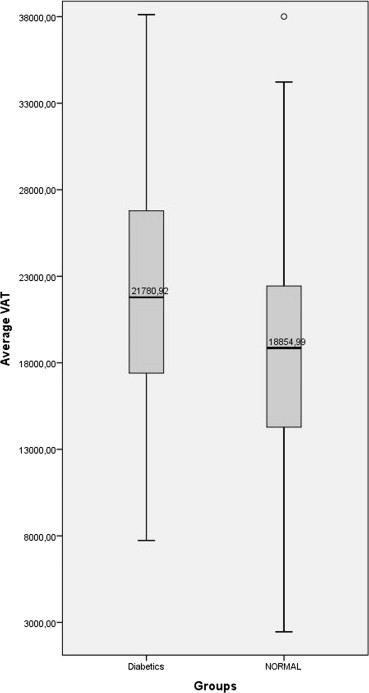
Diabetic patients exhibited larger amount of intraperitoneal and retroperitoneal AT than normal individuals at all levels ( t = 2.02, P < .05). Among anthropometric measurements, the waist circumference, BMI, and body fat percentage exhibited the best correlations with intraperitoneal and retroperitoneal AT (group A ( r ) = 0.88/0.78/0.0.69 and group B ( r ) = 0.91/0.87/0.81). The L2–L5 set of images was found to be the most representative of the amount of AT volumes.
Conclusions
Amount and distribution of AT can be accurately and easily assessed on MRI. Quantification of intraabdominal AT may promote the role of imaging in the study of metabolic syndrome.
Obesity has emerged as one of the most serious public health concerns in the 21st century in both developed and developing countries, because it is strongly related with the modern dietary habits and lifestyle. Increased body mass index (BMI) and especially increased visceral fat have been recognized as the major contributors to metabolic disturbances and the development of diseases including type 2 diabetes, cardiovascular disease, hypertension, and stroke. Quantification of obesity and adipose tissue (AT) distribution within the body is fundamental for the evaluation of patients with diabetes and metabolic syndrome. It is usually performed by simple anthropometric measurements, including BMI for rough estimation of total body fat, waist circumference (WC) for visceral AT (VAT), hip circumference for subcutaneous AT (SAT), and waist-to-hip ratio (WHR) . Although these measurements can be easily acquired, they are not precise, they may suffer from systematic errors , and they cannot accurately assess the most crucial AT compartment, that is, the VAT, proven to be closely related with the development of metabolic syndrome . Alternatively, computed tomography (CT) and magnetic resonance imaging (MRI) have been used for direct (in vivo) measurements of total body AT and of the major AT compartments, that is, visceral and subcutaneous AT . Various strategies have been proposed for AT assessment using imaging, including measurements of head-to-toes body fat, those of whole abdominal fat, or those of fat on a single-slice CT or MRI at different predetermined levels in the abdomen . However, there is no consensus on the most appropriate measurement methodology on imaging examinations.
The purpose of this study was to introduce a simple MRI protocol for the assessment of AT distribution in the body, to evaluate differences in AT distribution between diabetic patients and nondiabetic subjects on MRI, and to correlate common anthropometric measurements with MRI assessment of visceral and subcutaneous AT.
Materials and methods
Patients
Get Radiology Tree app to read full this article<
Anthropometric Measurements
Get Radiology Tree app to read full this article<
Magnetic Resonance Imaging
Get Radiology Tree app to read full this article<
Image Analysis
Get Radiology Tree app to read full this article<
Get Radiology Tree app to read full this article<
Get Radiology Tree app to read full this article<
Get Radiology Tree app to read full this article<
Statistics
Get Radiology Tree app to read full this article<
Get Radiology Tree app to read full this article<
Results
Get Radiology Tree app to read full this article<
Table 1
Anthropometric Measurements—Descriptive Statistics
Diabetics ( n = 38) Normal ( n = 38) Weight (kg) 88.68 ± 13.41 88.1 ± 15.7 Height (cm) 167 ± 5.6 171 ± 6.7 Body mass index (kg/m 2 ) 31.51 ± 4.45 30.02 ± 4.7 Waist circumference (cm) 107.89 ± 10.16 104.1 ± 12.3 Hips circumference (cm) 105.64 ± 7.42 105 ± 8.98 WHR 1.02 ± 0.05 0.98 ± 0.05 Femur (cm) 62.33 ± 7.89 64.04 ± 10.56 Waist-to-height ratio 0.64 ± 0.05 0.6 ± 0.06 Waist-to-thigh ratio 1.74 ± 0.17 1.67 ± 0.47 Arm span 173.9 ± 7.23 177.94 ± 7.34 Skin fold (cm) 15.16 ± 7.04 15.13 ± 12.0 Abdominal VAT (mm 2 ) 22229.03 ± 1379.96 18915.24 ± 1246.75 Intraperitoneal (mm 2 ) 13026.36 ± 1014.37 11598.82 ± 763.97 Retroperitoneal (mm 2 ) 8849.47 ± 635.39 7316.42 ± 532.57 Abdominal SAT (mm 2 ) 21148.07 ± 1462.16 20893.2 ± 1673.74 Abdominal SAT + VAT (mm 2 ) 43377.1 ± 2275.18 39808.45 ± 2347.78 Hip SAT (mm 2 ) 20666.37 ± 1288.67 19474.35 ± 1536.47
SAT, subcutaneous adipose tissue; VAT, visceral adipose tissue, WHR, waist-to-hip ratio.
Results are presented as mean ± standard deviation.
Get Radiology Tree app to read full this article<
Get Radiology Tree app to read full this article<
Get Radiology Tree app to read full this article<
Table 2
Pearson Correlations ( r ) between Anthropometric Measurements and Adipose Tissue
Waist Circumference BMI Hip Circumference WHR Body Fat (%) Gr. A Gr. B Gr. A Gr. B Gr. A Gr. B Gr. A Gr. B Gr. A Gr. B SAT average 0.708
( P <.001) 0.785
( P <.001) 0.692
( P <.001) 0.733
( P <.001) 0.856
( P <.001) 0.850
( P <.001) 0.138 0.333
( P <.05) 0.565
( P <.001) 0.644
( P <.001) VAT average 0.682
( P <.001) 0.672
( P <.001) 0.536
( P <.001) 0.658
( P <.001) 0.495
( P <.001) 0.424
( P <.001) 0.604
( P <.001) 0.736
( P <.001) 0.552
( P <.001) 0.662
( P <.001) Retroperitoneal AT average 0.596
( P <.001) 0.521
( P <.001) 0.478
( P <.001) 0.508
( P <.001) 0.423
( P <.001) 0.260 0.541
( P <.001) 0.673
( P <.001) 0.561
( P <.001) 0.544
( P <.001) Peritoneal AT average 0.653
( P <.001) 0.734
( P <.001) 0.507
( P <.001) 0.719
( P <.001) 0.479
( P <.001) 0.510
( P <.001) 0.570
( P <.001) 0.732
( P <.001) 0.485
( P <.001) 0.709
( P <.001) Total AT (SAT + VAT) 0.884
( P <.001) 0.917
( P <.001) 0.784
( P <.001) 0.872
( P <.001) 0.867
( P <.001) 0.831
( P <.001) 0.460
( P <.001) 0.628
( P <.001) 0.691
( P <.001) 0.814
( P <.001) SAT L2–L3 0.668
( P <.001) 0.770
( P <.001) 0.674
( P <.001) 0.698
( P <.001) 0.828
( P <.001) 0.822
( P <.001) 0.104 0.340
( P <.05) 0.566
( P <.001) 0.614
( P <.001) VAT L2–L3 0.729
( P <.001) 0.700
( P <.001) 0.651
( P <.001) 0.682
( P <.001) 0.553
( P <.001) 0.470
( P <.001) 0.612
( P <.001) 0.720
( P <.001) 0.604
( P <.001) 0.688
( P <.001) SAT + VAT L2–L3 0.882
( P <.001) 0.900
( P <.001) 0.837
( P <.001) 0.844
( P <.001) 0.874
( P <.001) 0.800
( P <.001) 0.447
( P <.001) 0.636
( P <.001) 0.721
( P <.001) 0.796
( P <.001) SAT L3–L4 0.681
( P <.001) 0.776
( P <.001) 0.671
( P <.001) 0.718
( P <.001) 0.842
( P <.001) 0.839
( P <.001) 0.108 0.329
( P <.05) 0.543
( P <.001) 0.637
( P <.001) VAT L3–L4 0.657
( P <.001) 0.658
( P <.001) 0.512
( P <.001) 0.642
( P <.001) 0.498
( P <.001) 0.422
( P <.001) 0.551
( P <.001) 0.711
( P <.001) 0.530
( P <.001) 0.666
( P <.001) SAT + VAT L3–L4 0.864
( P <.001) 0.906
( P <.001) 0.765
( P <.001) 0.856
( P <.001) 0.868
( P <.001) 0.828
( P <.001) 0.422
( P <.001) 0.612
( P <.001) 0.671
( P <.001) 0.814
( P <.001) SAT L4–L5 0.621
( P <.001) 0.643
( P <.001) 0.430
( P <.001) 0.611
( P <.001) 0.448
( P <.001) 0.427
( P <.05) 0.551
( P <.001) 0.709
( P <.001) 0.446
( P <.001) 0.612
( P <.001) VAT L4–L5 0.853
( P <.001) 0.928
( P <.001) 0.712
( P <.001) 0.899
( P <.001) 0.825
( P <.001) 0.884
( P <.001) 0.477
( P <.001) 0.634
( P <.001) 0.621
( P <.001) 0.821
( P <.001) SAT + VAT L4–L5 0.754
( P <.001) 0.790
( P <.001) 0.775
( P <.001) 0.838
( P <.001) 0.880
( P <.001) 0.876
( P <.001) 0.182 0.288 0.650
( P <.001) 0.782
( P <.001)
AT, adipose tissue; BMI, Body Mass Index; Gr., group; SAT, subcutaneous adipose tissue; VAT, visceral adipose tissue; WHR, waist-to-hip ratio.
Get Radiology Tree app to read full this article<
Get Radiology Tree app to read full this article<
Discussion
Get Radiology Tree app to read full this article<
Get Radiology Tree app to read full this article<
Get Radiology Tree app to read full this article<
Get Radiology Tree app to read full this article<
Get Radiology Tree app to read full this article<
Get Radiology Tree app to read full this article<
Get Radiology Tree app to read full this article<
Get Radiology Tree app to read full this article<
References
1. Wajchenberg B.L.: Subcutaneous and visceral adipose tissue: their relation to the metabolic syndrome. Endocr Rev 2000; 21: pp. 697-738.
2. Snijder M.B., van Dam R.M., Visser M., et. al.: What aspects of body fat are particularly hazardous and how do we measure them?. Int J Epidemiol 2006; 35: pp. 83-92.
3. Carr D.B., Utzschneider K.M., Hull R.L., et. al.: Intra-abdominal fat is a major determinant of the National Cholesterol Education Program Adult Treatment Panel III criteria for the metabolic syndrome. Diabetes 2004; 53: pp. 2087-2094.
4. Schwenzer N.F., Machann J., Schraml C., et. al.: Quantitative analysis of adipose tissue in single transverse slices for estimation of volumes of relevant fat tissue compartments: a study in a large cohort of subjects at risk for type 2 diabetes by MRI with comparison to anthropometric data. Invest Radiol 2010; 45: pp. 788-794.
5. Thomas E.L., Bell J.D.: Influence of undersampling on magnetic resonance imaging measurements of intra-abdominal adipose tissue. Int J Obes Relat Metab Disord 2003; 27: pp. 211-218.
6. Brennan D.D., Whelan P.F., Robinson K., et. al.: Rapid automated measurement of body fat distribution from whole-body MRI. AJR Am J Roentgenol 2005; 185: pp. 418-423.
7. Vogt F.M., Ruehm S., Hunold P., et. al.: Rapid total body fat measurement by magnetic resonance imaging: quantification and topography. Rofo 2007; 179: pp. 480-486.
8. Shen W., Punyanitya M., Wang Z., et. al.: Visceral adipose tissue: relations between single-slice areas and total volume. Am J Clin Nutr 2004; 80: pp. 271-278.
9. Lee S., Janssen I., Ross R.: Interindividual variation in abdominal subcutaneous and visceral adipose tissue: influence of measurement site. J Appl Physiol 2004; 97: pp. 948-954.
10. Wagenknecht L.E., Langefeld C.D., Scherzinger A.L., et. al.: Insulin sensitivity, insulin secretion, and abdominal fat: the Insulin Resistance Atherosclerosis Study (IRAS) Family Study. Diabetes 2003; 52: pp. 2490-2496.
11. Kuk J.L., Church T.S., Blair S.N., et. al.: Does measurement site for visceral and abdominal subcutaneous adipose tissue alter associations with the metabolic syndrome?. Diabetes Care 2006; 29: pp. 679-684.
12. Kruger D.F., Boucher J.L., Banerji M.A.: Utilizing current diagnostic criteria and treatment algorithms for managing type 2 diabetes mellitus. Postgrad Med 2011; 123: pp. 54-62.
13. Graham I., Atar D., Borch-Johnsen K., et. al.: European guidelines on cardiovascular disease prevention in clinical practice: executive summary. Atherosclerosis 2007; 194: pp. 1-45.
14. Bjorntorp P.: “Portal” adipose tissue as a generator of risk factors for cardiovascular disease and diabetes. Arteriosclerosis 1990; 10: pp. 493-496.
15. Buckley O., Ward E., Ryan A., et. al.: European obesity and the radiology department. What can we do to help?. Eur Radiol 2009; 19: pp. 298-309.
16. Tulloch-Reid M.K., Hanson R.L., Sebring N.G., et. al.: Both subcutaneous and visceral adipose tissue correlate highly with insulin resistance in African Americans. Obes Res 2004; 12: pp. 1352-1359.
17. Miles J.M., Jensen M.D.: Counterpoint: visceral adiposity is not causally related to insulin resistance. Diabetes Care 2005; 28: pp. 2326-2328.
18. Monzon J.R., Basile R., Heneghan S., et. al.: Lipolysis in adipocytes isolated from deep and superficial subcutaneous adipose tissue. Obes Res 2002; 10: pp. 266-269.
19. Machann J., Thamer C., Schnoedt B., et. al.: Standardized assessment of whole body adipose tissue topography by MRI. J Magn Reson Imaging 2005; 21: pp. 455-462.
20. Gomi T., Kawawa Y., Nagamoto M., et. al.: Measurement of visceral fat/subcutaneous fat ratio by 0.3 tesla MRI. Radiat Med 2005; 23: pp. 584-587.
21. Ellis K.J., Grund B., Visnegarwala F., et. al.: Visceral and subcutaneous adiposity measurements in adults: influence of measurement site. Obesity (Silver Spring) 2007; 15: pp. 1441-1447.
22. Demerath E.W., Shen W., Lee M., et. al.: Approximation of total visceral adipose tissue with a single magnetic resonance image. Am J Clin Nutr 2007; 85: pp. 362-368.
23. Ludescher B., Machann J., Eschweiler G.W., et. al.: Correlation of fat distribution in whole body MRI with generally used anthropometric data. Invest Radiol 2009; 44: pp. 712-719.
24. Muller H.P., Raudies F., Unrath A., et. al.: Quantification of human body fat tissue percentage by MRI. NMR Biomed 2011; 24: pp. 17-24.
25. Valsamakis G., Chetty R., Anwar A., et. al.: Association of simple anthropometric measures of obesity with visceral fat and the metabolic syndrome in male Caucasian and Indo-Asian subjects. Diabet Med 2004; 21: pp. 1339-1345.
26. Vega G.L., Adams-Huet B., Peshock R., et. al.: Influence of body fat content and distribution on variation in metabolic risk. J Clin Endocrinol Metab 2006; 91: pp. 4459-4466.
27. Kvist H., Chowdhury B., Grangard U., et. al.: Total and visceral adipose-tissue volumes derived from measurements with computed tomography in adult men and women: predictive equations. Am J Clin Nutr 1988; 48: pp. 1351-1361.
28. Wurslin C., Machann J., Rempp H., et. al.: Topography mapping of whole body adipose tissue using a fully automated and standardized procedure. J Magn Reson Imaging 2010; 31: pp. 430-439.
29. Positano V., Gastaldelli A., Sironi A.M., et. al.: An accurate and robust method for unsupervised assessment of abdominal fat by MRI. J Magn Reson Imaging 2004; 20: pp. 684-689.
30. Mantatzis M., Prassopoulos P.: Total body fat, visceral fat, subcutaneous fat, bone marrow fat? What is important to measure?. AJR Am J Roentgenol 2007; 189: pp. W386. author reply W385