
Rationale and Objectives
To evaluate the effect of a modified abdominal multislice computed tomography (CT) protocol for obese patients on image quality and radiation dose.
Materials and Methods
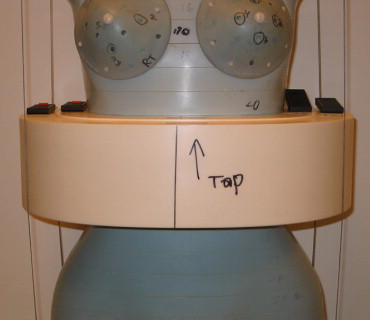
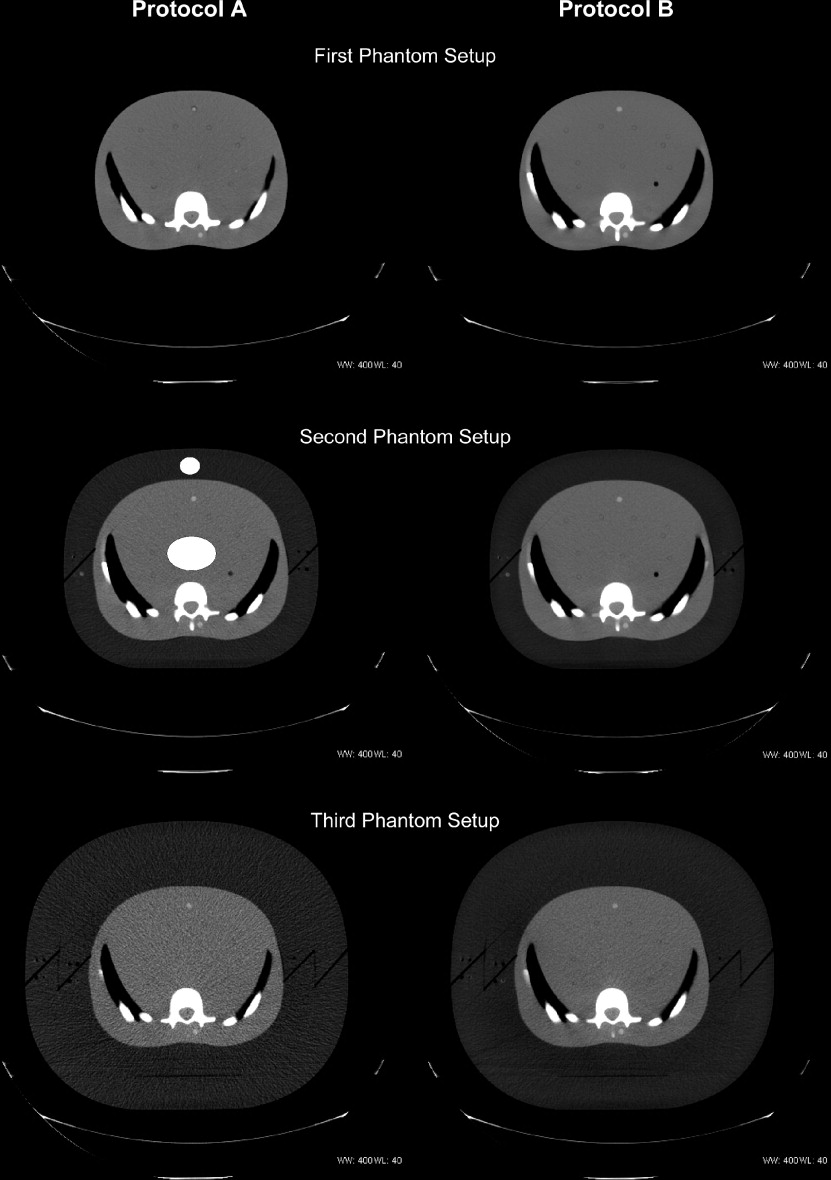
An adult female anthropomorphic phantom was used to simulate obese patients by adding one or two 4-cm circumferential layers of fat-equivalent material to the abdominal portion. The phantom was scanned with a subcutaneous fat thickness of 0, 4, and 8 cm using the following parameters (detector configuration/beam pitch/table feed per rotation/gantry rotation time/kV/mA): standard protocol A: 16 × 0.625 mm/1.75/17.5 mm/0.5 seconds/140/380, and modified protocol B: 16 × 1.25 mm/1.375/27.5 mm/1.0 seconds/140/380. Radiation doses to six abdominal organs and the skin, image noise values, and contrast-to-noise ratios (CNRs) were analyzed. Statistical analysis included analysis of variance, Wilcoxon rank sum, and Student’s t -test ( P < .05).
Results
Applying the modified protocol B with one or two fat rings, the image noise decreased significantly ( P < .05), and simultaneously, the CNR increased significantly compared with protocol A ( P < .05). Organ doses significantly increased, up to 54.7%, comparing modified protocol B with one fat ring to the routine protocol A with no fat rings ( P < .05). However, no significant change in organ dose was seen for protocol B with two fat rings compared with protocol A without fat rings (range −2.1% to 8.1%) ( P > .05).
Conclusions
Using a modified abdominal multislice CT protocol for obese patients with 8 cm or more of subcutaneous fat, image quality can be substantially improved without a significant increase in radiation dose to the abdominal organs.
Obesity is a growing, major public health problem in many countries around the world ( ). According to a recent article in the Journal of the American Medical Association , about one-third of adults in the United States—more than 90 million people—are obese (defined as a body mass index of 30 or higher) ( ). Furthermore, a significant increase in the prevalence of obesity in male adolescents was observed between 1999 and 2004 ( ). Obesity is associated with various medical conditions, including cardiovascular disease, type 2 diabetes mellitus, cholelithiasis, abdominal hernias, and different types of cancers (eg, breast and colon cancer) ( ).
The use of computed tomography (CT) as a diagnostic tool plays a major role in the work-up of obese patients with abdominal comorbidities or postoperative complication after bariatric surgery. However, insufficient image quality is frequently a concern with abdominal CT examination of these patients, owing to a greater absorption of the x-ray beam by the subcutaneous and visceral fat. Fewer incident photons contribute to image formation, which results in increased image noise. To obtain diagnostic-quality images, the radiologist needs to modify existing CT protocols when examining obese patients. One effective and practical approach to improve image quality in obese patients is to increase the x-ray tube output ( ). In a corpulent patient, the radiation dose to the abdominal organs is expected to be smaller than in a slim patient using the same CT protocol because the additional subcutaneous and visceral fat might serve as unintended radiation protection by attenuating more incident photons. To date, no reports, to the best of our knowledge, on image quality and radiation dose for abdominal multislice CT scan in obese patients have been published in the scientific literature.
Get Radiology Tree app to read full this article<
Materials and methods
Anthropomorphic Phantom
Get Radiology Tree app to read full this article<
Get Radiology Tree app to read full this article<
Get Radiology Tree app to read full this article<
CT Scanning
Get Radiology Tree app to read full this article<
Table 1
Multislice CT Scanning Parameters
Standard protocol A Modified protocol B Detector configuration 16 × 0.625 mm 16 × 1.25 mm Peak kilovoltage (kV) 140 140 Tube current (mA) 380 ⁎ 380 ⁎ Gantry rotation time (seconds) 0.5 1.0 Tube current-time product (mAs) 190 380 Beam pitch 1.750 1.375 Table feed per gantry rotation (mm) 17.5 27.5 Table speed (mm/second) 35 27.5 Reconstructed slice thickness (mm) 5 5 Estimated dose length product (mGy/cm) † 714.9 1853.7 Acquisition time (seconds) † 14.3 18.2
Get Radiology Tree app to read full this article<
Get Radiology Tree app to read full this article<
Get Radiology Tree app to read full this article<
Get Radiology Tree app to read full this article<
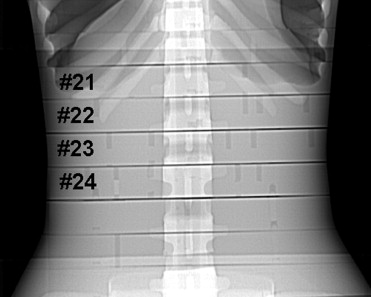
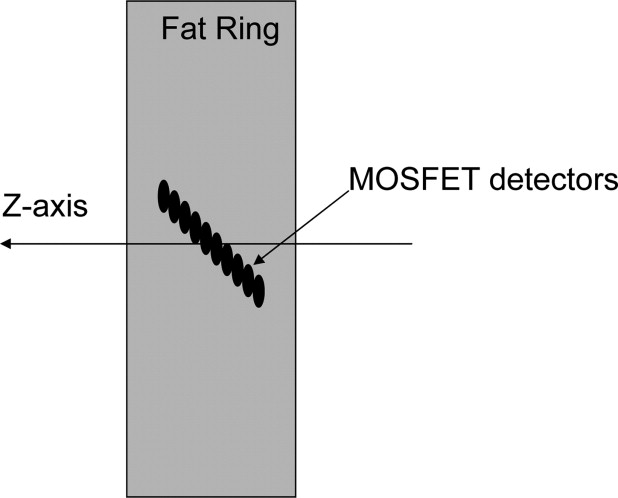
Detector Calibration Method
Get Radiology Tree app to read full this article<
Get Radiology Tree app to read full this article<
Radiation Dose Assessment and Statistical Analysis
Get Radiology Tree app to read full this article<
Get Radiology Tree app to read full this article<
Get Radiology Tree app to read full this article<
Get Radiology Tree app to read full this article<
Image Quality Assessment and Statistical Analysis
Get Radiology Tree app to read full this article<
Get Radiology Tree app to read full this article<
Results
Radiation Dose
Get Radiology Tree app to read full this article<
Table 2
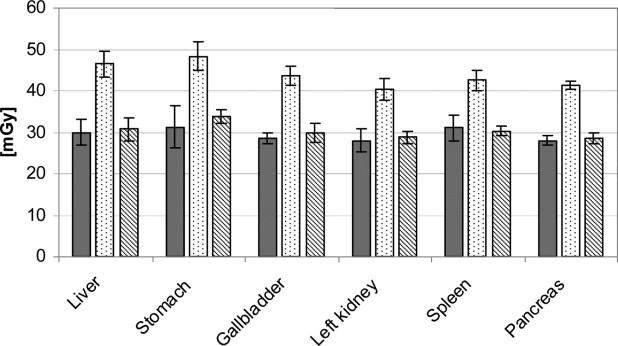
Mean Organ Dose, Mean Skin Dose, and Percent Differences Comparing Protocol A without Fat Ring with Protocol B Including 1 or 2 Fat Rings (4 or 8 cm Fat)
Liver Stomach Gallbladder Left kidney Spleen Pancreas Skin dose Prot A 0 cm 30.0 ± 3.2 31.3 ± 5.2 28.5 ± 1.2 28.0 ± 2.7 31.0 ± 3.1 28.0 ± 1.1 35.7 ± 4.7 Prot B 0 cm 68.2 ± 1.5 63.1 ± 2.0 67.9 ± 2.4 53.4 ± 1.3 59.7 ± 2.1 55.9 ± 1.5 86.0 ± 8.1 Prot A 4 cm 19.0 ± 1.2 22.1 ± 0.8 20.2 ± 0.7 18.3 ± 0.9 18.7 ± 0.9 17.8 ± 1.0 29.6 ± 1.2 Prot B 4 cm 46.4 ± 3.1 48.3 ± 3.4 43.6 ± 2.3 40.4 ± 2.7 42.5 ± 2.4 41.3 ± 1.0 72.0 ± 2.1 Prot A 8 cm 13.7 ± 1.5 15.0 ± 1.5 13.6 ± 0.7 12.3 ± 1.0 13.9 ± 0.9 12.4 ± 0.5 26.8 ± 3.0 Prot B 8 cm 30.7 ± 2.7 33.8 ± 1.6 29.8 ± 2.3 28.7 ± 1.6 30.3 ± 1.1 28.5 ± 1.4 55.2 ± 4.0 Prot B 4 cm vs. Prot A 0 cm ( P value) 54.7% (<.05) 54.6% (<.05) 53.0% (<.05) 44.3% (<.05) 37.0% (<.05) 47.5% (<.05) 101.7% (<.05) Prot B 8 cm vs. Prot A 0 cm ( P value) 2.3% (>.05) 8.1% (>.05) 4.7% (>.05) 2.4% (>.05) −2.1% (>.05) 1.8% (>.05) 54.6% (<.05)
Mean organ and skin dose ± standard deviation in mGy.
Prot A 0 cm : protocol A without a fat ring; Prot B 0 cm : protocol B without a fat ring; Prot A 4 cm : protocol A with one 4 cm thick fat ring; Prot B 4 cm : protocol B with one 4 cm thick fat ring; Prot A 8 cm : protocol A with two 4 cm thick fat rings; Prot B 8 cm : protocol B with two 4 cm thick fat rings.
Get Radiology Tree app to read full this article<
Get Radiology Tree app to read full this article<
Image Quality
Get Radiology Tree app to read full this article<
Table 3
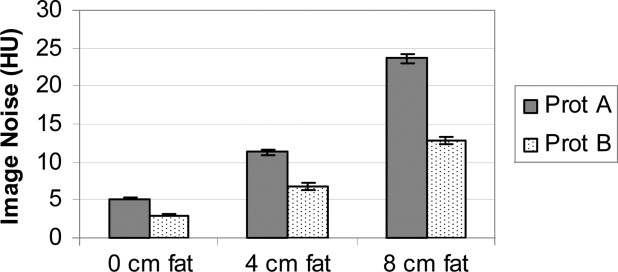
Mean Image Noise and Contrast-to-Noise Ratio
Image noise (Hounsfield Unites) CNR Prot A 0 cm 5.2 ± 0.2 Prot B 0 cm 3.0 ± 0.1 % change ( P value) −42.3% (<.05) Prot A 4 cm 11.3 ± 0.4 13.4 ± 0.6 Prot B 4 cm 6.8 ± 0.5 25.5 ± 1.2 % change ( P value) −39.8% (<.05) 65.7% (<.05) Prot A 8 cm 23.6 ± 0.6 5.1 ± 0.1 Prot B 8 cm 12.8 ± 0.4 12.3 ± 0.7 % change ( P value) −45.8% (<.05) 80.5% (<.05)
Mean image noise and contrast-to-noise ratio (CNR) ± standard deviation.
Prot A 0 cm : protocol A without a fat ring; Prot B 0 cm : protocol B without a fat ring; % change: percentage change; Prot A 4 cm : protocol A with one 4 cm thick fat ring; Prot B 4 cm : protocol B with one 4-cm-thick fat ring; Prot A 8 cm : protocol A with two 4 cm thick fat rings; Prot B 8 cm : protocol B with two 4 cm thick fat rings.
Get Radiology Tree app to read full this article<
Discussion
Get Radiology Tree app to read full this article<
Get Radiology Tree app to read full this article<
Get Radiology Tree app to read full this article<
Get Radiology Tree app to read full this article<
Get Radiology Tree app to read full this article<
Get Radiology Tree app to read full this article<
Get Radiology Tree app to read full this article<
References
1. Wang Y., Monteiro C., Popkin B.M.: Trends of obesity and underweight in older children and adolescents in the United States, Brazil, China, and Russia. Am J Clin Nutr 2002; 75: pp. 971-977.
2. Silventoinen K., Sans S., Tolonen H., et. al.: Trends in obesity and energy supply in the WHO MONICA Project. Int J Obes Relat Metab Disord 2004; 28: pp. 710-718.
3. Ogden C.L., Carroll M.D., Curtin L.R., et. al.: Prevalence of overweight and obesity in the United States, 1999–2004. JAMA 2006; 295: pp. 1549-1555.
4. Mun E.C., Blackburn G.L., Matthews J.B.: Current status of medical and surgical therapy for obesity. Gastroenterology 2001; 120: pp. 669-681.
5. Huda W.: Dose and image quality in CT. Pediatr Radiol 2002; 32: pp. 709-713.
6. Ende J.F., Huda W., Ros P.R., et. al.: Image mottle in abdominal CT. Invest Radiol 1999; 34: pp. 282-286.
7. Hendee W.R.: Interaction of x and gamma rays in the body.Hendee W.R.Medical radiation physics.1979.Year Book Medical Publishers, IncChicago:pp. 171-172.
8. Kalra M.K., Maher M.M., Toth T.L., et. al.: Comparison of Z-axis automatic tube current modulation technique with fixed tube current CT scanning of abdomen and pelvis. Radiology 2004; 232: pp. 347-353.
9. Kalra M.K., Maher M.M., Sahani D.V., et. al.: Low-dose CT of the abdomen: evaluation of image improvement with use of noise reduction filters pilot study. Radiology 2003; 228: pp. 251-256.
10. Wilting J.E., Zwartkruis A., van Leeuwen M.S., et. al.: A rational approach to dose reduction in CT: individualized scan protocols. Eur Radiol 2001; 11: pp. 2627-2632.
11. Nawfel R.D., Judy P.F., Silverman S.G., et. al.: Patient and personnel exposure during CT fluoroscopy-guided interventional procedures. Radiology 2000; 216: pp. 180-184.
12. Haaga J.R., Miraldi F., MacIntyre W., et. al.: The effect of mAs variation upon computed tomography image quality as evaluated by in vivo and in vitro studies. Radiology 1981; 138: pp. 449-454.
13. McCollough C.H., Bruesewitz M.R., Kofler J.M.: CT dose reduction and dose management tools: overview of available options. Radiographics 2006; 26: pp. 503-512.
14. Kalra M.K., Prasad S., Saini S., et. al.: Clinical comparison of standard-dose and 50% reduced-dose abdominal CT: effect on image quality. AJR Am J Roentgenol 2002; 179: pp. 1101-1106.
15. Donnelly L.F., Emery K.H., Brody A.S., et. al.: Minimizing radiation dose for pediatric body applications of single-detector helical CT: strategies at a large Children’s Hospital. AJR Am J Roentgenol 2001; 176: pp. 303-306.
16. Irie T., Inoue H.: Individual modulation of the tube current-seconds to achieve similar levels of image noise in contrast-enhanced abdominal CT. AJR Am J Roentgenol 2005; 184: pp. 1514-1518.
17. Haaga J.R.: Radiation dose management: weighing risk versus benefit. AJR Am J Roentgenol 2001; 177: pp. 289-291.
18. Kalra M.K., Maher M.M., Toth T.L., et. al.: Techniques and applications of automatic tube current modulation for CT. Radiology 2004; 233: pp. 649-657.
19. Kanehisa H., Miyatani M., Azuma K., et. al.: Influences of age and sex on abdominal muscle and subcutaneous fat thickness. Eur J Appl Physiol 2004; 91: pp. 534-537.
20. Snehalatha C., Ramachandran A., Satyavani K., et. al.: Computed axial tomographic scan measurement of abdominal fat distribution and its correlation with anthropometry and insulin secretion in healthy Asian Indians. Metabolism 1997; 46: pp. 1220-1224.
21. Yoshizumi T., Goodman P., Frush D.P., et. al.: Validation of CT organ dose assessment: MOSFET vs. TLD. AJR Am J Roentgenol 2007;