
Rationale and Objectives
Coronary artery calcium is a sensitive risk predictor of cardiac events. However, measurement of calcium foci is affected by partial-volume effects, which ultimately have an effect on accuracy and reproducibility of calcium scores. In this study, we describe the accuracy of quantification of calcium foci of known size and density using cork-dog heart phantoms.
Materials and Methods
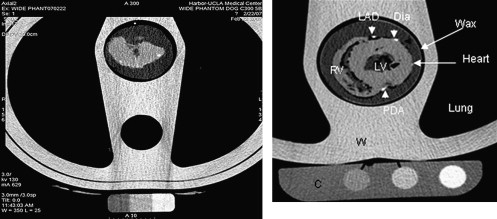
Five study phantoms were constructed from cork chests and dog hearts containing 135 calcium hydroxyapatite (CaHA) foci of known volume, mass, and concentration located in the coronary arteries or the myocardium. Hearts were separated into two groups: (1) three hearts containing large, high-density foci and (2) two hearts containing small, low-density foci. The phantoms were scanned using a standard coronary artery calcium (CAC) protocol and the volume and mean intensity of foci were measured.
Results
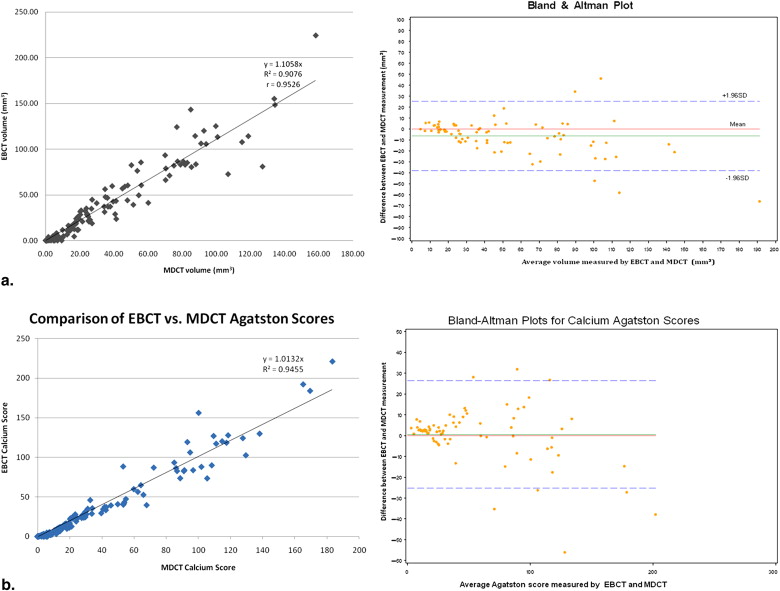
In group 1, the total volume of 87 CaHA foci measured was 4284 and 3779 mm 3 with electron beam computed tomography (EBCT); multidetector computed tomography (MDCT), respectively ( P < .001). Both were significantly larger than the true volume (2713.9 mm 3 , P < .001). In Group 2, the total volume of 57 CaHA foci measured was 592.6 and 702.9 mm 3 with EBT and MDCT, respectively ( P < .001). Both were significantly smaller than the true volume (1733.2 mm 3 , P < .001). We found that EBCT values for volume were approximately generally higher than MDCT values, but strongly correlated ( r = 0.95, P < .0001). Agatston scores were found to be nearly equivalent between EBCT and MDCT and were similarly strongly correlated ( r = 0.97, P < .0001).
Conclusions
Computed tomography images overestimate the volume of large, dense CaHA foci while underestimating the volume of smaller (<6.6 mm 3 ), less dense foci. This may have significant implications on CAC scoring and volume measurement. EBCT overestimated calcium more than MDCT, most likely from increased image noise.
Coronary artery calcium (CAC) measurement via electron-beam computed tomography (EBCT) and multidetector-row computed tomography (MDCT) is clinically useful as a noninvasive, non–exercise-dependent predictor of risk of cardiac events . CAC is consistently associated with atherosclerotic burden, independent of Framingham risk factors and information obtained via catheterization and angiography . Recent studies show that CAC measurement is a stronger predictor of coronary vascular disease (CVD) occurrence than carotid intima-media thickness . Additionally, worsening progression of CAC scores has been correlated with increased risk of first myocardial infarction .
Despite improvements in imaging technology, however, the accuracy of calcium foci quantification remains affected by constraints inherent to three-dimensional imaging modalities. Partial-volume effects (PVE) are phenomena that affect three-dimensional reconstructed image quality because of limits in spatial resolution and image sampling . PVE are better described in relation to modalities such as positron emission tomography and magnetic resonance imaging, which feature lower spatial resolution. However, PVE occur despite the high spatial resolution offered by computed tomography (CT) as an innate effect of pixel (and thus, voxel) edges that may not accurately match the contours of actual foci. As a result, in pixels partially occupied by calcium, intensity is not lost, but is instead dispersed across the whole area of a given pixel ( Fig 1 ), producing a lower intensity for the entire unit of volume. This effect can adversely affect quantification of CAC. For example, in the widely used Agatston calcium scoring method, points are assigned to calcified regions exceeding an arbitrary threshold for intensity measured in Hounsfield units (HU) . Thus, because of partial-volume effects, scores theoretically underestimate regions of small size and density because of decreased voxel intensity, while conversely overestimating regions of larger size and density. These phenomena can contribute to significant interscan variability as recently noted by Rutten et al, who found that the starting position of a given scan significantly alters the degree to which PVE affects an individual scan .
 Open full size image
Figure 1
Illustration of volume averaging effects on a circular mass of homogeneous density. When sampled in a 3 × 3 pixel grid, peripheral pixels demonstrate markedly reduced signal intensity.
Get Radiology Tree app to read full this article<
Get Radiology Tree app to read full this article<
Methods
Phantom Construction
Get Radiology Tree app to read full this article<
Get Radiology Tree app to read full this article<
CT Study Protocol
Get Radiology Tree app to read full this article<
Table 1
EBCT and MDCT Scanning Parameters
Parameter EBCT Imatron C-300 MDCT Lightspeed VCT64 Peak voltage (kVp) 130 140 Scanning time EBCT 100 ms Rotation time, MDCT 350 ms Temporal resolution 227ms Tube current (mA) 630 430 (220–670) ∗ Tube current-time product 63 mAs Varies ∗ Detector configuration 1 × 3 mm 4 × 2.5 mm Section thickness (mm) 3 2.5 Table increment (mm) 3 10 Reconstruction kernel Sharp Standard
EBCT, electron beam computed tomography; MDCT, multidetector computed tomography.
Get Radiology Tree app to read full this article<
Get Radiology Tree app to read full this article<
Get Radiology Tree app to read full this article<
Get Radiology Tree app to read full this article<
Measurements
Get Radiology Tree app to read full this article<
Statistical Analysis
Get Radiology Tree app to read full this article<
Results
Get Radiology Tree app to read full this article<
Table 2
Measured Volumes of Calcium Foci
Group 1 Group 2 Sum Volume (mm 3 ) Mean Volume (mm 3 ) Sum Volume (mm 3 ) Mean Volume (mm 3 ) Actual 2713.93 (28.93) 34.79 ± 25.52 1733.18 (15.41) 33.33 ± 34.90 MDCT 3779.11 (36.34) 48.45 ± 35.60 702.88 (3.63) 13.52 ± 23.80 EBCT 4284 (41.89) 54.92 ± 42.74 592.61 (1.61) 11.40 ± 23.64
EBCT, electron beam computed tomography; MDCT, multidetector computed tomography.
Sums are given with median in parentheses.
Get Radiology Tree app to read full this article<
Get Radiology Tree app to read full this article<
Get Radiology Tree app to read full this article<
Get Radiology Tree app to read full this article<
Discussion
Get Radiology Tree app to read full this article<
Get Radiology Tree app to read full this article<
Get Radiology Tree app to read full this article<
Conclusions
Get Radiology Tree app to read full this article<
References
1. Margolis J.R., Chen J.T., Kong Y., et. al.: The diagnostic and prognostic significance of coronary artery calcification. A report of 800 cases. Radiology 1980; 137: pp. 609-616.
2. Detrano R., Guerci A.D., Carr J.J., et. al.: Coronary calcium as a predictor of coronary events in four racial or ethnic groups. N Engl J Med 2008; 358: pp. 1336-1345.
3. Folsom A.R., Kronmal R.A., Detrano R.C., et. al.: Coronary artery calcification compared with carotid intima-media thickness in the prediction of cardiovascular disease incidence: the Multi-Ethnic Study of Atherosclerosis (MESA). Arch Intern Med 2008; 168: pp. 1333-1339.
4. Raggi P., Callister T.Q., Shaw L.J.: Progression of coronary artery calcium and risk of first myocardial infarction in patients receiving cholesterol-lowering therapy. Arterioscler Thromb Vasc Biol 2004; 24: pp. 1272-1277.
5. Soret M., Bacharach S.L., Buvat I.: Partial-volume effect in PET tumor imaging. J Nucl Med 2007; 48: pp. 932-945.
6. Yaghoubi S., Tang W., Wang S., et. al.: Offline assessment of atherosclerotic coronary calcium from electron beam tomograms. Am J Card Imaging 1995; 9: pp. 231-236.
7. McCollough C.H., Ulzheimer S., Halliburton S.S., et. al.: Coronary artery calcium: a multi-institutional, multimanufacturer international standard for quantification at cardiac CT. Radiology 2007; 243: pp. 527-538.
8. Rutten A., Isgum I., Prokop M.: Coronary calcification: effect of small variation of scan starting position on Agatston, volume, and mass scores. Radiology 2008; 246: pp. 90-98.
9. Chau A., Gopal A.S., Mao S.S., et. al.: Comparison of three generations of electron beam tomography on image noise and reproducibility, a phantom study. Invest Radiol 2006; 41: pp. 522-526.
10. Agatston A.S., Janowitz W.R., Hildner F.J., et. al.: Quantification of coronary artery calcium using ultrafast computed tomography. J Am Coll Cardiol 1990; 15: pp. 827-832.
11. Blaha M., Budoff M.J., Shaw L.J., et. al.: Absence of coronary artery calcification and all-cause mortality. JACC Cardiovascular Imaging 2009; 2: pp. 692-700.
12. Sarwar A., Shaw L.J., Shapiro M.D., et. al.: Diagnostic and prognostic value of absence of coronary artery calcification. JACC Cardiovascular Imaging 2009; 2: pp. 675-688.
13. Budoff M.J., McClelland R.L., Nasir K., et. al.: Cardiovascular events with absent or minimal coronary calcification: the Multi-Ethnic Study of Atherosclerosis (MESA). Am Heart J 2009; 158: pp. 554-561.
14. Budoff M.J., Shinbane J.S., Oudiz R.J., et. al.: Comparison of coronary artery calcium screening image quality between C-150 and e-speed electron beam scanners. Acad Radiol 2005; 12: pp. 309-312.
15. Budoff M.J., Katz R., Wong N.D., et. al.: Effect of scanner type on the reproducibility of extra-coronary measures of calcification: the multi-ethnic study of atherosclerosis. Acad Radiol 2007; 14: pp. 1043-1049.
16. Boedeker K.L., McNitt-Gray M.F., Rogers S.R., et. al.: Emphysema: effect of reconstruction algorithm on CT imaging measures. Radiology 2004; 232: pp. 295-301.
17. Nasir K., Budoff M.J., Post W.S., et. al.: Electron beam CT versus helical CT scans for assessing coronary calcification: current utility and future directions. Am Heart J 2003; 146: pp. 969-977.
18. Daniell A.L., Wong N.D., Friedman J.D., et. al.: Concordance of coronary artery calcium estimates between MDCT and electron beam tomography. AJR Am J Roentgenol 2005; 185: pp. 1542-1545.
19. Mao S.S., Pal R.S., McKay C.S., et. al.: Comparison of coronary artery calcium scores between electron beam computed tomography and 64-multidetector computed tomographic scanner. J Comput Assist Tomogr 2009; 33: pp. 175-178.
20. Lu B., Budoff M.J., Zhuang N., et. al.: Causes of interscan variability of coronary artery calcium measurements at electron beam CT. Acad Radiol 2002; 9: pp. 654-661.
21. Budoff M.J., Mao S., Lu B., et. al.: Ability of calibration phantom to reduce the interscan variability in electron beam computed tomography. J Comput Assist Tomogr 2002; 26: pp. 886-891.
22. Mao S.S., Child J., Carson S., et. al.: Sensitivity to detect small coronary artery calcium lesions with varying slice thickness. Invest Radiol 2003; 38: pp. 183-187.