
Rationale and Objectives
To determine the accuracy and reproducibility of a remote eye-tracking system for studies of observer gaze while displaying volumetric chest computed tomography (CT) images.
Materials and Methods
Four participants performed calibrations using three different gray-scale backgrounds (black, gray, and white). Each participant then observed a three-dimensional 10-point test pattern embedded in five Digital Imaging and Communications in Medicine (DICOM) datasets (test backgrounds): a full 190-section chest CT scan, 190 copies of a single chest CT section, and three 190-section datasets of homogeneous intensity (black, gray, and white).
Results
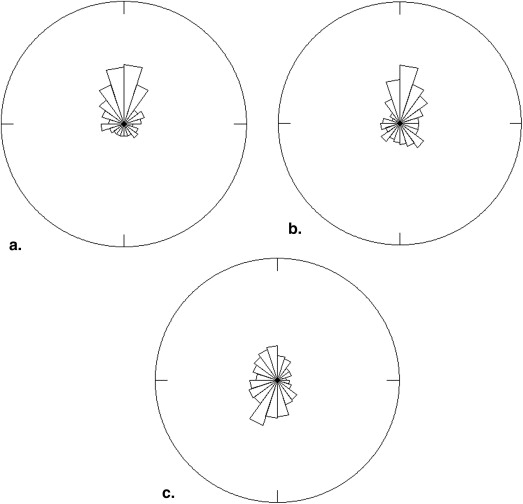
Significant variances between participants, calibration backgrounds, and test backgrounds were observed. The least mean systematic error (deviation of recorded gaze position from target) was obtained when the calibration background and test background were black (27 pixels). Systematic error increased when displaying a test background that deviated from the calibration background intensity. Hence, the largest mean systematic error occurred when calibrating to a black background and displaying a white background (67 pixels). For complex chest CT volumes the white calibration background performed best (38 pixels). An angular analysis of the systematic error was performed and demonstrated that the systemic error primarily affects the vertical position of the estimated gaze position.
Conclusion
Our findings indicate a potential source of systematic error during gaze recording in a dynamic environment and highlight the importance of configuring the calibration procedure according to the brightness of the display. We recommend that investigators develop routines for postcalibration accuracy measurement and report the effective accuracy for the display environment in which the data are collected.
Understanding the perceptual mechanisms involved in the interpretation of medical images is an important facet of the complex and interlinked cognitive process that determines if the readers succeed or fail to detect abnormalities in the images . Several theories regarding potential sources of detection and interpretation errors of human readers have been proposed, including the satisfaction of search error , in which the detection of lesions influences the likelihood of subsequent detections, and the global perception , in which an instant holistic understanding of the image occurs almost immediately after the appearance of an image.
Research using eye-tracking methods provides insight into the cognitive processes involved in the visual search of medical images. Most investigations using these methods have been focused on understanding the visual search patterns within two-dimensional images, such as when reading plain film mammograms or searching for pulmonary nodules on radiographs .
Get Radiology Tree app to read full this article<
Get Radiology Tree app to read full this article<
Methods
Get Radiology Tree app to read full this article<
Eye-tracking Apparatus
Get Radiology Tree app to read full this article<
Procedure
Get Radiology Tree app to read full this article<
Get Radiology Tree app to read full this article<
Get Radiology Tree app to read full this article<
Get Radiology Tree app to read full this article<
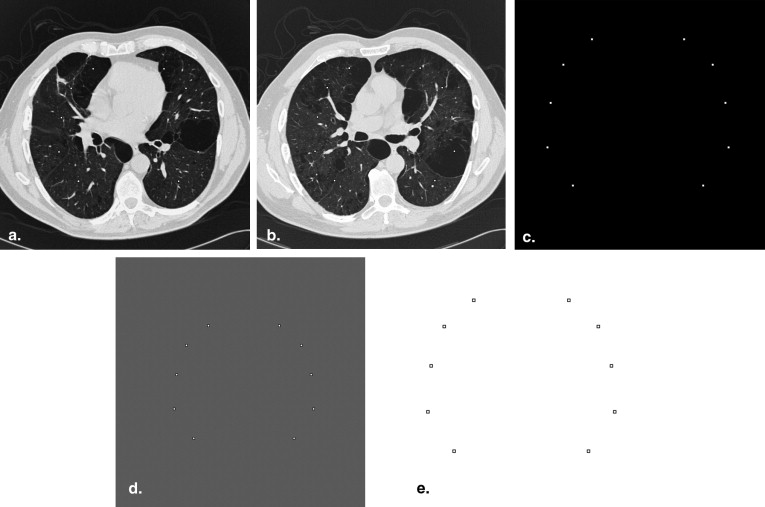
Table 1
Test Backgrounds
Background Description CT full Contiguous 1-mm thick chest CT sections from a 190-mm region centered within the lungs. CT static A single mid-thoracic CT section replicated 190 times. Black Solid black (−1000 HU) White Solid white (3000 HU) Gray mean Homogeneous background set to the mean voxel value encountered in six normal chest CT datasets (63 HU).
CT, computed tomography; HU, Hounsfield units.
CT volumes were displayed with a window width of 1600 HU and a window level of −500 HU on an 8-bit display.
Get Radiology Tree app to read full this article<
Get Radiology Tree app to read full this article<
Get Radiology Tree app to read full this article<
Analysis
Get Radiology Tree app to read full this article<
Get Radiology Tree app to read full this article<
rBijkl=μ+Pi+Tj+Sk+Cl+PTij+TSjk+PSik+PCil+TCjl+TCjl+SCkl+eijkl r
i
j
k
l
B
=
μ
+
P
i
+
T
j
+
S
k
+
C
l
+
P
T
i
j
+
T
S
j
k
+
P
S
i
k
+
P
C
i
l
+
T
C
j
l
+
T
C
j
l
+
S
C
k
l
+
e
i
j
k
l
where rBijkl r
i
j
k
l
B represents the observed magnitude of systematic error for i = 1,..,4 participants, j = 1,..,10 target locations, k = 1,…,7 over test background and l = 1, 2, 3 calibrations. Further, μ represents the average systematic error across all experimental conditions, P i represents the main effect of participant i , T j represents the main effect target j , S k represents the main effect of test background k , and C l represents the main effect of calibration l . The term PT ij represents the interaction effect between participant i , and target j , etc. The analysis of the magnitude of variability was performed similarly. The significance ( P values) of estimated effects and corresponding factors were computed using standard ANOVA based F-tests with appropriate degrees of freedom .
Get Radiology Tree app to read full this article<
Results
Get Radiology Tree app to read full this article<
Get Radiology Tree app to read full this article<
Table 2
Total Bias by Calibration and Test Backgrounds
Black Gray CT Static CT Full White Average Across All Five Backgrounds Black26.9 (22.1–31.8) 51.7 (40.7–62.7) 54.5 (44.8–64.2) 48.1 (39.9–56.1) 66.8 (56.7–76.8) 49.6 (45.2–52.3) Gray 34.5 (28.4–40.7)33.8 (25.7–42.0) 44.1 (31.8–56.7) 42.3 (30.4–54.2) 58.8 (47.4–70.2) 42.7 (35.1–42.3) White 45.7 (36.4–54.9) 44.5 (35.2–53.8) 34.3 (27.5–41.3) 37.9 (29.6–46.1)30.3 (24.0–36.7) 38.5 (36.2–42.4) Average 35.7 (31.6–39.9) 43.3 (37.8–48.9) 44.3 (38.6–50.1) 42.8 (37.3–48.1) 52.0 (45.9–58.0) 43.6 (40.3–44.3)
CT, computed tomography.
Rows indicate calibration condition; columns indicate test backgrounds. Best accuracy (bold) obtained when the calibration is matching the display luminance; worst accuracy (underline) occurs at greatest disparity between calibration and test background. Values within parentheses indicate the 95% confidence interval. All measurements are in screen pixels, each pixel measure ∼0.27 mm.
Get Radiology Tree app to read full this article<
Get Radiology Tree app to read full this article<
Get Radiology Tree app to read full this article<
Analysis of Variability
Get Radiology Tree app to read full this article<
Discussion
Get Radiology Tree app to read full this article<
Get Radiology Tree app to read full this article<
Get Radiology Tree app to read full this article<
Get Radiology Tree app to read full this article<
Get Radiology Tree app to read full this article<
Get Radiology Tree app to read full this article<
Get Radiology Tree app to read full this article<
Acknowledgments
Get Radiology Tree app to read full this article<
Supplementary data
Get Radiology Tree app to read full this article<
Video 1
Get Radiology Tree app to read full this article<
Get Radiology Tree app to read full this article<
References
1. Muhm J.R., Miller W.E., Fontana R.S., et. al.: Lung cancer detected during a screening program using four-month chest radiographs. Radiology 1983; 148: pp. 609-615.
2. Beam C.A., Conant E.F., Sickles E.A.: Correlation of radiologist rank as a measure of skill in screening and diagnostic interpretation of mammograms. Radiology 2006; 238: pp. 446-453.
3. Samuel S., Kundel H.L., Nodine C.F., et. al.: Mechanism of satisfaction of search: eye position recordings in the reading of chest radiographs. Radiology 1995; 194: pp. 895-902.
4. Berbaum K.S., Franken J.E.A., Dorfman D.D., et. al.: Role of faulty visual search in the satisfaction of search effect in chest radiography. Acad Radiol 1998; 5: pp. 9-19.
5. Ashman C.J., Yu J.S., Wolfman D.: Satisfaction of search in osteoradiology. AJR Am J Roentgenol 2000; 175: pp. 541-544.
6. Kundel H.L., Nodine C.F., Conant E.F., et. al.: Holistic component of image perception in mammogram interpretation: gaze-tracking study. Radiology 2007; 242: pp. 396-402.
7. Nodine C., Kundel H., Toto L., et. al.: Recording and analyzing eye-position data using a microcomputer workstation. Behav Res Methods 1992; 24: pp. 475-485.
8. Kundel H.L., Nodine C.F., Krupinski E.A., et. al.: Using gaze-tracking data and mixture distribution analysis to support a holistic model for the detection of cancers on mammograms. Acad Radiol 2008; 15: pp. 881-886.
9. Atkins M.S., Moise A., Rohling R.: An application of eyegaze tracking for designing radiologists’ workstations: insights for comparative visual search tasks. ACM Trans Appl Percept 2006; 3: pp. 136-151.
10. Beard D., Johnston R., Toki O., et. al.: A study of radiologists viewing multiple computed tomography examinations using an eyetracking device. J Digit Imaging 1990; 3: pp. 230-237.
11. Beard D.V., Pisano E.D., Denelsbeck K.M., et. al.: Eye movement during computed tomography interpretation: eyetracker results and image display-time implications. J Digit Imaging 1994; 7: pp. 189-192.
12. Mello-Thoms C., Britton C., Abrams G., et. al.: Head-mounted versus remote eye tracking of radiologists searching for breast cancer: a comparison. Acad Radiol 2006; 13: pp. 203-209.
13. Mello-Thoms C., Nodine C.F., Kundel H.L.: What attracts the eye to the location of missed and reported breast cancers? Book what attracts the eye to the location of missed and reported breast cancers?.2002.ACMNew York, NY 111–117
14. Nodine C.F., Kundel H.L.: Using eye movements to study visual search and to improve tumor detection. Radiographics 1987; 7: pp. 1241-1250.
15. Kundel H.L., Nodine C.F., Krupinski E.A.: Computer-displayed eye position as a visual aid to pulmonary nodule interpretation. Invest Radiol 1990; 25: pp. 890-896.
16. Kundel H.L., La Follette P.S.: Visual search patterns and experience with radiological images. Radiology 1972; 103: pp. 523-528.
17. Kundel H.L., Nodine C.F., Carmody D.: Visual scanning, pattern recognition and decision-making in pulmonary nodule detection. Invest Radiol 1978; 13: pp. 175-181.
18. Thomas E.L., Lansdown E.L.: Visual search patterns of radiologists in training. Radiology 1963; 81: pp. 288-292.
19. Krupinski E.A.: Visual scanning patterns of radiologists searching mammograms. Acad Radiol 1996; 3: pp. 137-144.
20. de Valk J.P., Eijkman E.G.: Analysis of eye fixations during the diagnostic interpretation of chest radiographs. Med Biol Eng Comput 1984; 22: pp. 353-360.
21. Andriole K.P., Wolfe J.M., Khorasani R., et. al.: Optimizing analysis, visualization, and navigation of large image data sets: one 5000-xection CT scan can ruin your whole day. Radiology 2011; 259: pp. 346-362.
22. Nodine C.F., Mello-Thoms C., Kundel H.L., et. al.: Time course of perception and decision making during mammographic interpretation. AJR Am J Roentgenol 2002; 179: pp. 917-923.
23. Krupinski E.: Searching for nodules: what features attract attention and influence detection?. Acad Radiol 2003; 10: pp. 861-868.
24. Hansen D.W., Ji Q.: In the eye of the beholder: a survey of models for eyes and gaze. IEEE Trans Pattern Anal Mach Intell 2010; 32: pp. 478-500.
25. Reeves P.: The response of the average pupil to various intensities of light. J Optical Soc Am 1920; 4: pp. 35-43.
26. Nakayama M., Yasuike I., Shimizu Y.: Pupil size changing by pattern brightness and pattern contents. J InstTelevision Eng Japan 1990; 44: pp. 288-293.
27. Pomplun MS, S. Pupil dilation as an indicator of cognitive workload in human-computer interaction. human-centred computing: cognitive, social, and ergonomic aspects. Proceedings of the 10th International Conference on Human-Computer Interaction, HCII 2003, Crete, Greece. 2003; 3:542–546.
28. Ramanauskas N., Daunys G., Dervinis D.: Investigation of calibration techniques in video based eye tracking system.Miesenberger K.Klaus J.Zagler W. et. al.Computers Helping People with Special Needs.2008.SpringerBerlin, Germany:pp. 1208-1215.
29. Montgomery D.C.: Design and Analysis of Experiments.4th ed.1997.John Wiley & Sons, IncNew York, NY
30. Zar J.H.: Biostatistical Analysis.4th ed.1999.Prentice HallUpper Saddle River, NJ