
Rational and Objectives
This study aims to evaluate the diagnostic utility of breast imaging using transmission ultrasound. We present readers’ accuracy in determining whether a breast lesion is a cyst versus a solid using transmission ultrasound as an adjunct to mammography.
Materials and Methods
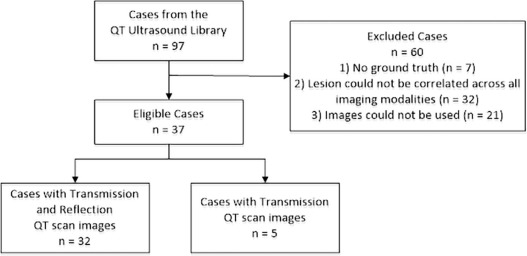
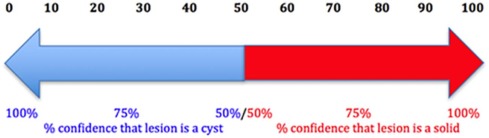
This retrospective multi-reader, multi-case receiver operating characteristic study included 37 lesions seen on mammography and transmission ultrasound. Cyst cases were confirmed as cysts using their appearance on handheld ultrasound. Solid cases were confirmed as solids with pathology results. Fourteen readers performed blinded, randomized reads with mammography + quantitative transmission scan images, assigning both a confidence score (0–100) and a binary classification of cyst or solid. A 95% percentile bootstrap confidence interval (CI) was computed for the readers’ mean receiver operating characteristic area, sensitivity, and specificity.
Results
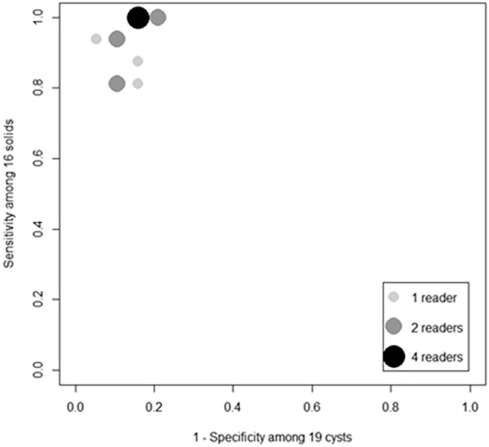
Using the readers’ binary classification of cyst or solid lesions, the mean sensitivity and specificity were 0.933 [95% CI: 0.837, 0.995] and 0.858 [95% CI: 0.701, 0.985], respectively. When the readers’ confidence scores were used to distinguish a cyst versus solid, the mean receiver operating characteristic area was 0.920 [95% CI: 0.827, 0.985].
Conclusions
Transmission ultrasound can provide an accurate assessment of a cyst versus a solid lesion in the breast. Prospective clinical trials will further delineate the role of transmission ultrasound as an adjunct to mammography to increase specificity in breast evaluation.
Introduction
-Ray mammography (XRM) has been used for over 40 years as the primary breast cancer screening modality in the United States. It is a technology that sees shadows and calcifications as a way of determining whether there is an abnormality in the breast. Over the many years of use, mammography has shown mixed results regarding imaging performance and accuracy of diagnosis. Issues of low sensitivity, particularly when used in the dense breast evaluation, and the use of ionizing radiation create significant concerns for physicians and patients. Although early reviews of digital breast tomosynthesis have shown improved sensitivity and decreased noncancer recall rates, digital breast tomosynthesis still involves ionizing radiation, is associated with uncomfortable breast compression, and images the breast in a compressed state, instead of its natural form. The specificity of mammography, even when combined with ultrasound, whether handheld or automated methods, results in many false-positives, leading to costly procedures and significant patient anxiety. More than 1.2 million false-positive biopsies are performed in the United States annually , and in another recent study $4 billion are spent annually on false-positive mammograms in the United States .
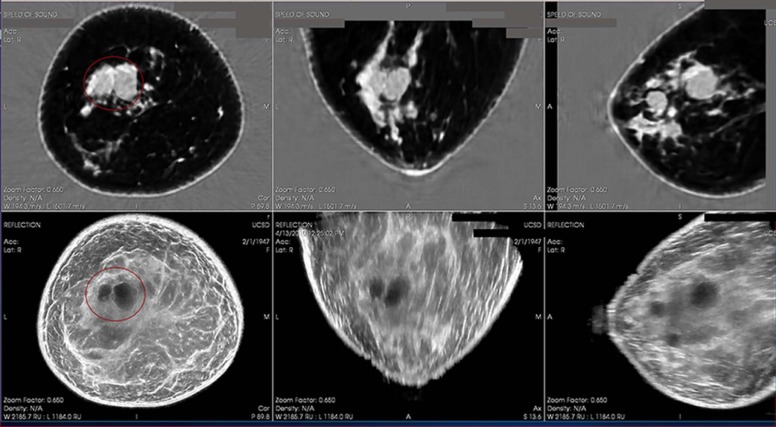
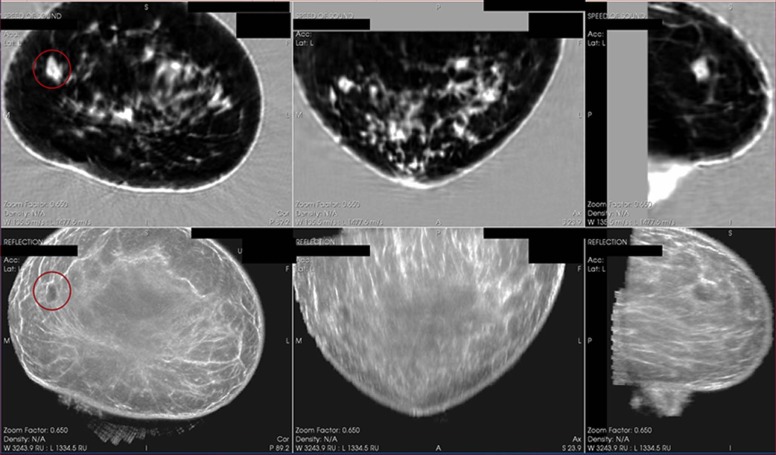
To improve specificity and decrease the large number of false-positive biopsies, transmission ultrasound has been developed by QT Ultrasound Labs . Performance features show improved spatial and contrast resolution . Transmission ultrasound images breast microanatomy and aims to provide tissue characterization with a unique combination of transmission and reflection B-mode ultrasound images . Figures 1 and 2 represent two cases, a cyst and a malignant solid, with transmission images (upper image with top three panels showing coronal, axial, and sagittal views) and reflection B-images (lower image showing top three panels showing coronal, axial, and sagittal views). Whether diagnosing early breast cancer, or confirming that a patient’s exam is normal, high sensitivity and specificity are both important performance measures for providing quality breast care.
Get Radiology Tree app to read full this article<
Current Standard of Care
Get Radiology Tree app to read full this article<
Transmission Ultrasound
Get Radiology Tree app to read full this article<
Get Radiology Tree app to read full this article<
Materials and Methods
Study Oversight
Get Radiology Tree app to read full this article<
Transmission Ultrasound Imaging
Get Radiology Tree app to read full this article<
Retrospective MRMC ROC Study Design and Execution
Get Radiology Tree app to read full this article<
Get Radiology Tree app to read full this article<
Get Radiology Tree app to read full this article<
Get Radiology Tree app to read full this article<
Get Radiology Tree app to read full this article<
Get Radiology Tree app to read full this article<
Table 1
Estimated Probability of a Cyst/Solid Lesion as a Function of the Speed of Sound Value From a Prior Internal Feasibility Study
Speed of Sound Value (m/s) Probability That the Lesion Is a Cyst (%) Probability That the Lesion Is a Solid (%) ≤1540 0.91–0.98 0.02–0.09 1541–1560 0.89–0.98 0.02–0.11 1561–1570 0.23–0.64 0.36–0.77 1571–1580 0.01–0.06 0.94–0.99 >1580 <0.01 >0.99
Probabilities are applicable to populations with a prevalence rate between 0.40 and 0.80.
Get Radiology Tree app to read full this article<
Get Radiology Tree app to read full this article<
Get Radiology Tree app to read full this article<
Statistical Analysis for the MRMC ROC Study
Get Radiology Tree app to read full this article<
Get Radiology Tree app to read full this article<
Results
Get Radiology Tree app to read full this article<
Get Radiology Tree app to read full this article<
Get Radiology Tree app to read full this article<
Discussion
Get Radiology Tree app to read full this article<
Get Radiology Tree app to read full this article<
Acknowledgment
Get Radiology Tree app to read full this article<
Get Radiology Tree app to read full this article<
References
1. The know error system for breast biopsies. Online: knowerror.com/biopsytypes/breast/ accessed May 18, 2017
2. Ong M.-S., Mandl K.D.: National expenditure for false-positive mammograms and breast cancer overdiagnoses estimated at $4 billion a year. Health Aff 2015; 34: pp. 576-583.
3. Andre M., Wiskin J., Borup D., et. al.: Quantitative volumetric breast imaging with 3D inverse scatter computed tomography. In: Engineering in Medicine and Biology Society (EMBC), 2012 Annual International Conference of the IEEE, 1110–11132012.
4. Lenox M.W., Wiskin J., Lewis M.A., et. al.: Imaging performance of quantitative transmission ultrasound. Int J Biomed Imaging 2015; 2015: pp. 8.
5. Wiskin J., Borup D.T., Johnson S.A., et. al.: Non-linear inverse scattering: high resolution quantitative breast tissue tomography. J Acoust Soc Am 2012; 131: pp. 3802-3813.
6. Klock J.C., Iuanow E.I., Malik B., et. al.: Anatomy-correlated breast imaging and visual grading analysis using quantitative transmission ultrasound. Int J Biomed Imaging 2016; http://dx.doi.org/10.1155/2016/7570406 Article ID 7570406
7. Malik B., Klock J.C., Wiskin J., et. al.: Objective breast tissue image classification using quantitative transmission ultrasound tomography. Nature Sci Rep 2016; 6: pp. 38857.
8. Gerson E.S., Berg W.A.: Screening breast sonography. Am J Roentgenol 2003; 180: pp. 1477-1478.
9. Daly C.P., Bailey J.E., Klein K.A., et. al.: Complicated breast cysts on sonography. Acad Radiol 2003; 15: pp. 610-617.
10. Rinaldi P., Ierardi C., Costantini M., et. al.: Cystic breast lesions: sonographic findings and clinical management. J Ultrasound Med 2010; 29: pp. 1617-1626.
11. Berg W.A., Sechtin A.G., Marques H., et. al.: Cystic breast masses and the ACRIN 6666 experience. Radiologic Clinics 2010; 48: pp. 931-987.
12. Harvey J.A., Nicholson B.T., LoRusso A.P., et. al.: Short-term follow-up of palpable breast lesions with benign imaging features: evaluation of 375 lesions in 320 women. Am J Roentgenol 2009; 193: pp. 1723-1730.
13. Berg W.A., Blume J.D., Cormack J.B., et. al.: Combined screening with ultrasound and mammography vs mammography alone in women at elevated risk of breast cancer. JAMA 2008; 299: pp. 2151-2163.
14. Brodersen J., Siersma V.D.: Long-term psychosocial consequences of false-positive screening mammography. Annals Fam Med 2013; 11: pp. 106-115.
15. Tosteson A.A., Fryback D.G., Hammond C.S., et. al.: Consequences of false-positive screening mammograms. JAMA Intern Med 2014; 174: pp. 954-961.
16. Obuchowski N.A.: Nonparametric analysis of clustered ROC curve data. Biometrics 1997; 53: pp. 567-578.