
Rationale and Objectives
To investigate the accuracy of dual-energy virtual monochromatic computed tomography (CT) numbers obtained by two typical hardware and software implementations: the single-source projection-based method and the dual-source image-based method.
Materials and Methods
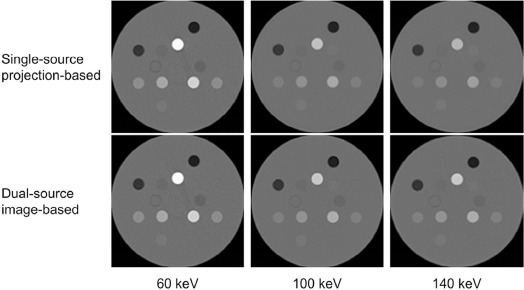
A phantom with different tissue equivalent inserts was scanned with both single-source and dual-source scanners. A fast kVp-switching feature was used on the single-source scanner, whereas a tin filter was used on the dual-source scanner. Virtual monochromatic CT images of the phantom at energy levels of 60, 100, and 140 keV were obtained by both projection-based (on the single-source scanner) and image-based (on the dual-source scanner) methods. The accuracy of virtual monochromatic CT numbers for all inserts was assessed by comparing measured values to their corresponding true values. Linear regression analysis was performed to evaluate the dependency of measured CT numbers on tissue attenuation, method, and their interaction.
Results
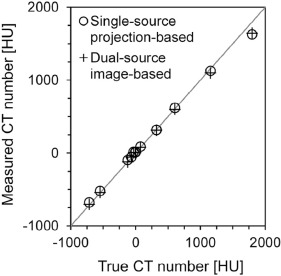
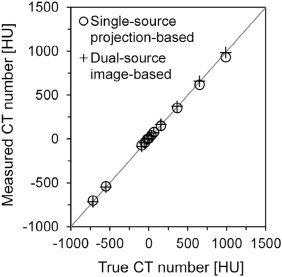
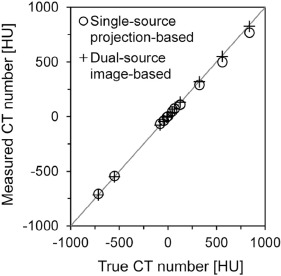
Root mean square values of systematic error over all inserts at 60, 100, and 140 keV were approximately 53, 21, and 29 Hounsfield unit (HU) with the single-source projection-based method, and 46, 7, and 6 HU with the dual-source image-based method, respectively. Linear regression analysis revealed that the interaction between the attenuation and the method had a statistically significant effect on the measured CT numbers at 100 and 140 keV.
Conclusions
There were attenuation-, method-, and energy level-dependent systematic errors in the measured virtual monochromatic CT numbers. CT number reproducibility was comparable between the two scanners, and CT numbers had better accuracy with the dual-source image-based method at 100 and 140 keV.
Introduction
Virtual monochromatic (or monoenergetic) computed tomography (CT), which was first described by Alvarez and Macovski in 1976 , became an established imaging technique with the introduction of modern dual-energy CT scanners that have the ability to simultaneously acquire a pair of conventional polychromatic x-ray CT data streams (eg, at tube voltages of 80 kVp and 140 kVp) . This technique allows energy-selective reconstruction of CT images at a wide range of “energy levels” from 40 keV to 140 keV or above. Depending on the energy-level selection, virtual monochromatic CT can reduce beam hardening artifacts (especially from dense materials) , improve iodine contrast for CT angiography , achieve better soft-tissue contrast in unenhanced scans , and provide accurate electron density information for radiotherapy treatment planning .
In their original work, Alvarez and Macovski reconstructed virtual monochromatic CT images from “energy-selective” projection data that were synthesized from a pair of original projection data sets, each acquired by polychromatic x-ray at a different energy spectrum. In this context, the term “energy-selective” means that the projection data were assumed to have been obtained by photons that had a certain monochromatic energy. In this method, the main framework for obtaining virtual monochromatic CT images is in the projection-space domain , and thus we refer to this method as the projection-based method. This method has become one of the two major streams in current virtual monochromatic CT technology .
Get Radiology Tree app to read full this article<
Get Radiology Tree app to read full this article<
Materials and Methods
Get Radiology Tree app to read full this article<
TABLE 1
Phantom Inserts, their Physical Characteristics, and True Monochromatic CT Numbers
True CT Number (HU) Sample No. Z eff ED 60 keV 100 keV 140 keV Category 1 7.86 0.28 –716.0 –717.2 –716.6 Lung tissue 2 7.84 0.45 –550.2 –551.5 –550.5 Lung tissue 3 6.40 0.92 –122.6 –89.9 –80.3 Soft tissue 4 7.24 0.96 –66.8 –50.0 –43.4 Soft tissue 5 8.11 0.99 –32.0 –17.5 –11.3 Soft tissue 6 7.42 1.00 0.0 0.0 0.0 Soft tissue 7 6.31 1.05 –6.3 33.2 44.5 Soft tissue 8 8.11 1.06 74.2 65.5 67.6 Soft tissue 9 10.90 1.10 321.9 155.1 127.0 Bone tissue 10 10.90 1.10 321.1 154.9 126.8 Bone tissue 11 11.39 1.28 604.9 365.3 324.1 Bone tissue 12 12.98 1.47 1154.8 651.2 560.2 Bone tissue 13 14.14 1.70 1796.7 987.7 839.1 Bone tissue
CT, computed tomography; ED, relative electron density (to water); HU, Hounsfield unit; Z eff, effective atomic number.
Get Radiology Tree app to read full this article<
Get Radiology Tree app to read full this article<
Get Radiology Tree app to read full this article<
Get Radiology Tree app to read full this article<
Ni(E)=(μ/ρ)i(E)⋅ρi−(μ/ρ)w(E)⋅ρw(μ/ρ)w(E)⋅ρw×1000, N
i
(
E
)
=
(
μ
/
ρ
)
i
(
E
)
·
ρ
i
−
(
μ
/
ρ
)
w
(
E
)
·
ρ
w
(
μ
/
ρ
)
w
(
E
)
·
ρ
w
×
1000
,
where N i ( E ) is the CT number in HU of the insert i at photon energy E , ( μ / ρ ) i ( E ) is the mass attenuation coefficient of the insert i at energy E , ( μ / ρ ) w ( E ) is the mass attenuation coefficient of water at energy E, ρ i is the mass density of the insert i supplied by the manufacturer, and ρ w is the density of water at room temperature. The mass attenuation coefficients of the inserts were determined using the mass attenuation coefficients for elements (photon cross sections database available at the website of National Institute of Standards and Technology, USA; https://www.nist.gov/pml/xcom-photon-cross-sections-database ) and elemental compositions of the inserts by simple additivity (ie, combining values for the elements according to their proportions by weight). Photon energies were selected to be 60, 100, and 140 keV, which correspond to the selection of the energy levels for the virtual monochromatic images.
Get Radiology Tree app to read full this article<
Get Radiology Tree app to read full this article<
Results
Get Radiology Tree app to read full this article<
Get Radiology Tree app to read full this article<
Get Radiology Tree app to read full this article<
Get Radiology Tree app to read full this article<
Get Radiology Tree app to read full this article<
TABLE 2
Systematic and Random Errors in Measured Virtual Monochromatic CT Numbers of the Phantom Inserts
Systematic Error (HU) Random Error (HU) Single-Source Scanner Dual-Source Scanner Single-Source Scanner Dual-Source Scanner SampleNo. 60keV 100keV 140 keV 60 keV 100 keV 140 keV 60 keV 100 keV 140 keV 120 kVp 60 keV 100 keV 140 keV 120 kVp 1 39.8 16.7 10.6 12.2 3.5 0.6 7.7 0.8 0.6 4.2 0.1 0.5 0.6 3.7 2 29.7 13.6 8.3 8.2 2.7 0.1 0.8 1.3 1.5 1.1 3.1 3.7 3.9 6.3 3 27.0 18.8 15.4 1.9 4.7 3.5 10.6 3.3 1.8 5.8 0.6 0.2 0.2 1.5 4 12.0 10.4 7.0 13.1 4.7 0.1 6.6 0.7 2.2 1.4 0.8 1.1 1.2 1.1 5 51.7 19.1 8.6 35.5 13.6 5.7 2.7 1.9 1.7 2.4 5.1 0.8 2.1 2.9 6 15.3 6.2 3.9 3.5 3.1 3.0 2.6 0.4 1.0 1.8 1.5 1.9 2.2 1.7 7 22.9 8.7 3.0 11.8 1.7 −2.7 4.3 2.2 1.5 1.7 3.0 1.0 0.8 2.3 8 14.1 10.6 5.6 6.0 5.2 1.0 9.0 4.9 4.1 6.8 2.8 0.5 0.3 0.4 9 −1.8 −5.3 −17.7 −8.4 11.8 5.3 2.4 2.8 4.0 7.3 3.1 3.2 3.9 6.5 10 −3.0 −3.6 −15.2 −7.6 11.8 5.2 15.8 1.4 2.4 1.3 2.7 2.5 3.2 7.5 11 16.5 −10.8 −32.5 −6.6 7.3 −5.0 5.2 2.8 1.9 4.2 3.0 1.9 1.2 3.3 12 −25.5 −32.1 −61.0 −55.2 5.4 −9.1 26.5 4.0 2.7 13.1 2.3 1.7 2.3 15.2 13 −168.3 −55.9 −71.2 −150.4 −3.5 −12.8 11.7 2.4 3.8 8.0 5.7 1.2 0.2 13.0 RMS All 52.8 21.2 29.1 46.1 7.1 5.5 10.6 2.6 2.5 5.7 3.0 1.8 2.1 6.7 Lung 35.1 15.3 9.5 10.4 3.1 0.4 5.5 1.1 1.1 3.1 2.2 2.6 2.8 5.2 Soft 27.4 13.3 8.3 16.5 6.7 3.2 6.7 2.7 2.3 4.0 2.8 1.0 1.4 1.9 Bone 120.3 45.6 66.3 113.3 4.6 11.1 20.5 3.3 3.3 7.9 4.4 1.4 1.6 10.1
CT, computed tomography; RMS, root mean square.
Get Radiology Tree app to read full this article<
Get Radiology Tree app to read full this article<
Get Radiology Tree app to read full this article<
Get Radiology Tree app to read full this article<
TABLE 3
Differences in Measured Virtual Monochromatic CT Numbers between the Two Methods
Difference (HU) Sample No. 60 keV 100 keV 140 keV 1 27.5 13.3 10.0 2 21.5 10.9 8.2 3 25.1 14.1 11.8 4 −1.1 5.7 6.9 5 16.1 5.5 2.9 6 11.9 3.1 1.0 7 11.1 7.0 5.7 8 8.1 5.4 4.6 9 6.6 −17.1 −23.0 10 4.7 −15.5 −20.3 11 23.1 −18.1 −27.5 12 29.7 −37.5 −51.9 13 −17.9 −52.3 −58.5 RMS All 18.1 20.8 25.2 Lung 24.7 12.1 9.2 Soft 14.3 7.6 6.5 Bone 19.0 31.6 39.5
CT, computed tomography; HU, Hounsfield unit; RMS, root mean square.
Get Radiology Tree app to read full this article<
Get Radiology Tree app to read full this article<
TABLE 4
Estimated Coefficients from a Linear Regression Model Fitted to Measured Virtual Monochromatic CT Numbers
Energy (keV) Variable Estimate SE t-value_P_ Value 60 keV Intercept 32.234 17.349 1.858 0.230 Attenuation 0.920 0.026 35.958 <0.0001 Method −14.806 10.972 −1.349 0.573 Attenuation × Method 0.009 0.016 0.578 1.000 100 keV Intercept 0.422 5.411 0.078 1.000 Attenuation 0.914 0.013 72.839 <0.0001 Method 2.622 3.422 0.766 1.000 Attenuation × Method 0.042 0.008 5.306 <0.0001 140 keV Intercept −14.627 7.395 −1.978 0.182 Attenuation 0.891 0.019 47.090 <0.0001 Method 7.342 4.677 1.570 0.392 Attenuation × Method 0.050 0.012 4.205 <0.0001
CT, computed tomography; SE, standard error.
Attenuation × Method stands for the interaction between the attenuation and the method.
Get Radiology Tree app to read full this article<
Discussion
Get Radiology Tree app to read full this article<
Get Radiology Tree app to read full this article<
Get Radiology Tree app to read full this article<
Get Radiology Tree app to read full this article<
Get Radiology Tree app to read full this article<
Get Radiology Tree app to read full this article<
Get Radiology Tree app to read full this article<
Acknowledgments
Get Radiology Tree app to read full this article<
Get Radiology Tree app to read full this article<
References
1. Alvarez R.E., Macovski A.: Energy-selective reconstructions in X-ray computerized tomography. Phys Med Biol 1976; 21: pp. 733-744.
2. Matsumoto K., Jinzaki M., Tanami Y., et. al.: Virtual monochromatic spectral imaging with fast kilovoltage switching: improved image quality as compared with that obtained with conventional 120-kVp CT. Radiology 2011; 259: pp. 257-262.
3. Yu L., Christner J.A., Leng S., et. al.: Virtual monochromatic imaging in dual-source dual-energy CT: radiation dose and image quality. Med Phys 2011; 38: pp. 6371-6379.
4. Pomerantz S.R., Kamalian S., Zhang D., et. al.: Virtual monochromatic reconstruction of dual-energy unenhanced head CT at 65–75 keV maximizes image quality compared with conventional polychromatic CT. Radiology 2013; 266: pp. 318-325.
5. Goodsitt M.M., Christodoulou E.G., Larson S.C.: Accuracies of the synthesized monochromatic CT numbers and effective atomic numbers obtained with a rapid kVp switching dual energy CT scanner. Med Phys 2011; 38: pp. 2222-2232.
6. Pessis E., Campagna R., Sverzut J.M., et. al.: Virtual monochromatic spectral imaging with fast kilovoltage switching: reduction of metal artifacts at CT. Radiographics 2013; 33: pp. 573-583.
7. Bamberg F., Dierks A., Nikolaou K., et. al.: Metal artifact reduction by dual energy computed tomography using monoenergetic extrapolation. Eur Radiol 2011; 21: pp. 1424-1429.
8. Yamada S., Ueguchi T., Shimosegawa E., et. al.: Feasibility of improved attenuation correction for SPECT reconstruction in the presence of dense materials using dual-energy virtual monochromatic CT: a phantom study. Open J Med Imaging 2015; 5: pp. 183-193.
9. Delesalle M.A., Pontana F., Duhamel A., et. al.: Spectral optimization of chest CT angiography with reduced iodine load: experience in 80 patients evaluated with dual-source, dual-energy CT. Radiology 2013; 267: pp. 256-266.
10. Leng S., Yu L., Fletcher J.G., et. al.: Maximizing iodine contrast-to-noise ratios in abdominal CT imaging through use of energy domain noise reduction and virtual monoenergetic dual-energy CT. Radiology 2015; 276: pp. 562-570.
11. Agrawal M.D., Oliveira G.R., Kalva S.P., et. al.: Prospective comparison of reduced-iodine-dose virtual monochromatic imaging dataset from dual-energy CT angiography with standard-iodine-dose single-energy CT angiography for abdominal aortic aneurysm. AJR Am J Roentgenol 2016; 207: pp. W125-W132.
12. Yagi M., Ueguchi T., Koizumi M., et. al.: Gemstone spectral imaging: determination of CT to ED conversion curves for radiotherapy treatment planning. J Appl Clin Med Phys 2013; 14: pp. 173-186.
13. Ogata T., Ueguchi T., Yagi M., et. al.: Feasibility and accuracy of relative electron density determined by virtual monochromatic CT value subtraction at two different energies using the gemstone spectral imaging. Radiat Oncol 2013; 8: pp. 3.
14. Landry G., Reniers B., Granton P.V., et. al.: Extracting atomic numbers and electron densities from a dual source dual energy CT scanner: experiments and a simulation model. Radiother Oncol 2011; 100: pp. 375-379.
15. Mileto A., Barina A., Marin D., et. al.: Virtual monochromatic images from dual-energy multidetector CT: variance in CT numbers from the same lesion between single-source projection-based and dual-source image-based implementations. Radiology 2016; 279: pp. 269-277.
16. Bazalova M., Carrier J.F., Beaulieu L., et. al.: Dual-energy CT-based material extraction for tissue segmentation in Monte Carlo dose calculations. Phys Med Biol 2008; 53: pp. 2439-2456.
17. Primak A.N., Ramirez Giraldo J.C., Liu X., et. al.: Improved dual-energy material discrimination for dual-source CT by means of additional spectral filtration. Med Phys 2009; 36: pp. 1359-1369.
18. Primak A.N., Giraldo J.C., Eusemann C.D., et. al.: Dual-source dual-energy CT with additional tin filtration: dose and image quality evaluation in phantoms and in vivo. AJR Am J Roentgenol 2010; 195: pp. 1164-1174.
19. Leschka S., Stolzmann P., Baumuller S., et. al.: Performance of dual-energy CT with tin filter technology for the discrimination of renal cysts and enhancing masses. Acad Radiol 2010; 17: pp. 526-534.
20. Kaufmann S., Sauter A., Spira D., et. al.: Tin-filter enhanced dual-energy-CT: image quality and accuracy of CT numbers in virtual noncontrast imaging. Acad Radiol 2013; 20: pp. 596-603.
21. Yamada S., Ueguchi T., Ogata T., et. al.: Radiotherapy treatment planning with contrast-enhanced computed tomography: feasibility of dual-energy virtual unenhanced imaging for improved dose calculations. Radiat Oncol 2014; 9: pp. 168.