
Rationale and Objectives
Despite improvements in the methods used in body composition analysis, some goals remain far from clinical practice. Among them, the most important is the quantification of intra-abdominal adipose tissue. Fat distribution is a key point in the assessment of cardiovascular and metabolic risk status. The aim of this study was to define the accuracy, reproducibility, and repeatability of ultrasonography in the evaluation of abdominal adiposity.
Materials and Methods
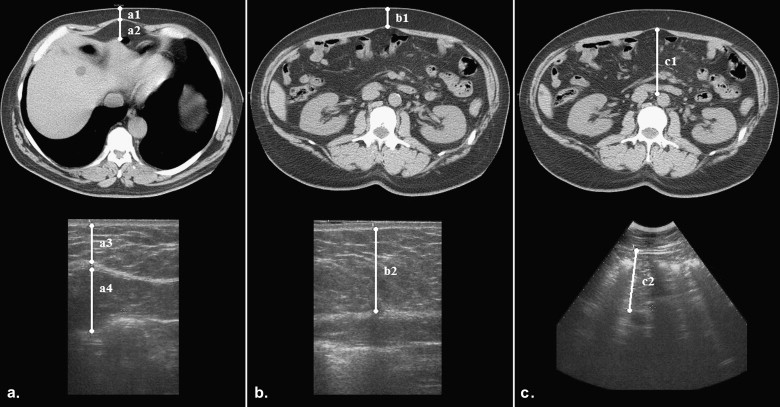
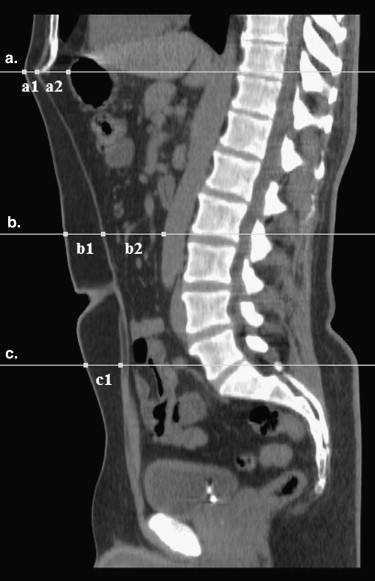
Twenty-six nonobese patients (group A) who underwent computed tomographic (CT) abdominal imaging and 29 obese patients (group B) were enrolled. Patients from both groups were independently evaluated using ultrasound by three radiologists; computed tomography–like conditions were reproduced, and six main parameters of subcutaneous and internal adiposity were measured (as well as three derived indexes) with both linear and convex probes. In group A, the same measurements were also obtained on CT images. Time spent for every ultrasound session was recorded. Results were analyzed using Lin’s concordance correlation (ρ), intraclass correlation, and linear regression analysis (and analysis of variance).
Results
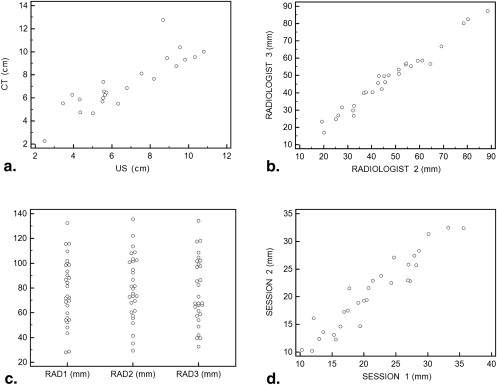
Three patients were excluded from group A after CT scans because of technical problems. Mesenteric fat thickness did not show significant correlations and reliability. Strong correlations between ultrasound and CT measurements were observed for all other visceral and subcutaneous parameters (ρ = 0.85–0.96). Intraobserver and interobserver agreement was excellent in both groups (repeatability: ρ = 0.83–0.99 for group A, ρ = 0.90–0.99 for group B; reproducibility: intraclass correlation coefficient = 0.90–0.99 for groups A and B). The mean time spent was 95 ± 21 seconds for group A (mean body mass index, 27.4 ± 2.4 kg/m 2 ) and 129 ± 33 seconds for group B (mean body mass index, 37.3 ± 11.9 kg/m 2 ).
Conclusions
Ultrasound is accurate, reproducible, and fast in the analysis of abdominal adiposity. It offers a regional, easy, and close-at-hand evaluation of subcutaneous and visceral fat compartments. This should be taken into consideration when clinical routine examinations are performed or to evaluate patients with specific metabolic diseases before and after treatment.
The study of body composition (BC) continues to hold a prominent role in scientific research, although attention has shifted predominantly to clinical applications. BC analysis, quantification, and description of the distribution of adipose tissue are integral in the study of obesity and many other physiologic, paraphysiologic, and pathologic conditions . Moreover, adipose tissue is considered the biggest “gland” of the human body, and its endocrine functions are increasingly discovered and understood .
Obesity is described as a major public health problem by the World Health Organization, which uses the term globesity to reflect a global epidemic impact of the disease . In fact, the worldwide prevalence of overweight in children and young people is approximately 10% (2%–3% for obesity), while 23% and 10% of the world’s adult population is overweight and obese, respectively . If attention is focused on industrialized countries (established market economies), the prevalence of overweight rises to 41.0% and 28.6% for men and women, respectively, and the prevalence of obesity is 19.1% and 22.2% . Cameron et al as well as many contributions in the literature have presented and discussed the burden of metabolic syndrome and diabetes, both problems related to fat .
Get Radiology Tree app to read full this article<
Get Radiology Tree app to read full this article<
Get Radiology Tree app to read full this article<
Get Radiology Tree app to read full this article<
Get Radiology Tree app to read full this article<
Get Radiology Tree app to read full this article<
Get Radiology Tree app to read full this article<
Materials and methods
Get Radiology Tree app to read full this article<
Get Radiology Tree app to read full this article<
Abdominal Adiposity Measures
Thickness measurements
Get Radiology Tree app to read full this article<
Get Radiology Tree app to read full this article<
Get Radiology Tree app to read full this article<
Get Radiology Tree app to read full this article<
Get Radiology Tree app to read full this article<
Get Radiology Tree app to read full this article<
Adiposity indexes
Get Radiology Tree app to read full this article<
Statistical Analysis
Get Radiology Tree app to read full this article<
Results
Get Radiology Tree app to read full this article<
Correlation Between Ultrasound and CT Imaging
Get Radiology Tree app to read full this article<
Table 1
CT and Ultrasound Measures in Groups A and B
Measure Group A Group B CT Imaging (cm) Ultrasound (cm) Ultrasound (cm) Minimum subcutaneous fat thickness 1.29 ± 0.72 1.15 ± 0.67 1.83 ± 0.77 Maximum preperitoneal fat thickness 1.73 ± 0.57 1.77 ± 0.59 1.92 ± 0.55 Maximum subcutaneous fat thickness A 2.49 ± 1.16 2.50 ± 1.00 3.45 ± 1.31 Maximum subcutaneous fat thickness B 2.90 ± 1.42 2.83 ± 1.45 4.60 ± 1.75 Intra-abdominal fat thickness 7.31 ± 2.53 7.40 ± 1.71 8.21 ± 2.75 Mesenteric fat thickness 0.52 ± 0.14 0.42 ± 0.15 0.49 ± 0.20 WFI 0.78 ± 0.45 0.70 ± 0.48 1.05 ± 0.61 MAR-A 0.36 ± 0.15 0.39 ± 0.16 0.48 ± 0.26 MAR-B 0.41 ± 0.17 0.43 ± 0.23 0.61 ± 0.29
Data are expressed as mean ± standard deviation.
CT, computed tomographic; MAR-A, maximum abdominal ratio A (maximum subcutaneous fat thickness A/intra-abdominal fat); MAR-B, maximum abdominal ratio B (maximum subcutaneous fat thickness B/intra-abdominal fat); WFI, wall fat index (minimum subcutaneous fat/maximum preperitoneal fat).
Table 2
Ultrasound Compared to CT Measurements and Indexes of Abdominal Adipose Thicknesses ( n = 23)
CT Measures Ultrasound Measures Radiologist 1 Radiologist 2 Radiologist 3 Radiologist Mean ρ 95% CI ρ 95% CI ρ 95% CI ρ 95% CI Minimum subcutaneous fat thickness 0.94 § 0.84 to 0.98 0.96 § 0.85 to 0.99 0.92 ‡ 0.77 to 0.97 0.94 § 0.89 to 0.97 Maximum preperitoneal fat thickness 0.92 § 0.78 to 0.97 0.83 † 0.44 to 0.96 0.81 † 0.47 to 0.94 0.87 § 0.76 to 0.93 Maximum subcutaneous fat thickness A 0.96 § 0.90 to 0.99 0.92 ‡ 0.70 to 0.98 0.99 ‡ 0.97 to 1.00 0.96 § 0.93 to 0.98 Maximum subcutaneous fat thickness B 0.98 § 0.94 to 0.99 0.96 § 0.85 to 0.99 0.89 ‡ 0.72 to 0.96 0.95 § 0.90 to 0.97 Intra-abdominal fat thickness 0.84 § 0.61 to 0.94 0.75 ∗ 0.28 to 0.93 0.93 ‡ 0.76 to 0.98 0.85 § 0.73 to 0.92 Mesenteric fat thickness 0.14 −0.06 to 0.33 0.07 −0.48 to 0.58 0.21 −0.33 to 0.64 0.18 −0.06 to 0.41 WFI 0.90 § 0.75 to 0.96 0.95 § 0.80 to 0.99 0.85 § 0.61 to 0.94 0.90 § 0.82 to 0.95 MAR-A 0.92 § 0.81 to 0.97 0.81 † 0.40 to 0.95 0.92 § 0.73 to 0.98 0.89 § 0.80 to 0.94 MAR-B 0.91 § 0.78 to 0.96 0.92 ‡ 0.72 to 0.98 0.84 ‡ 0.60 to 0.94 0.89 § 0.80 to 0.94
Lin’s concordance correlations were used to compare ultrasound and CT measures.
CI, confidence interval; CT, computed tomographic; MAR-A, maximum abdominal ratio A (maximum subcutaneous fat thickness A/intra-abdominal fat); MAR-B, maximum abdominal ratio B (maximum subcutaneous fat thickness B/intra-abdominal fat); WFI, wall fat index (minimum subcutaneous fat/maximum preperitoneal fat).
Get Radiology Tree app to read full this article<
Get Radiology Tree app to read full this article<
Get Radiology Tree app to read full this article<
Get Radiology Tree app to read full this article<
Get Radiology Tree app to read full this article<
Reproducibility
Get Radiology Tree app to read full this article<
Table 3
Repeatability and Reproducibility of Sonographic Measurements and Indexes of Abdominal Adipose Thicknesses in Group A ( n = 23)
Measure Raters Repeatability Reproducibility Radiologist 1 Radiologist 1 vs Radiologist 2 Radiologist 1 vs Radiologist 3 Radiologist 2 vs Radiologist 3 Total ρ 95% CI ρ 95% CI ρ 95% CI ρ 95% CI ICC 95% CI Minimum subcutaneous fat thickness 0.95 § 0.85 to 0.98 0.97 § 0.89 to 0.99 0.94 § 0.83 to 0.98 0.95 § 0.81 to 0.99 0.99 0.96 to 1.00 Maximum preperitoneal fat thickness 0.91 § 0.74 to 0.97 0.77 † 0.33 to 0.93 0.75 ∗ 0.38 to 0.91 0.76 ∗ 0.19 to 0.94 0.90 0.66 to 0.98 Maximum subcutaneous fat thickness A 0.94 § 0.85 to 0.98 0.92 § 0.78 to 0.97 0.95 § 0.86 to 0.98 0.93 § 0.74 to 0.98 0.98 0.93 to 0.99 Maximum subcutaneous fat thickness B 0.99 § 0.96 to 1.00 0.99 § 0.95 to 1.00 0.90 § 0.69 to 0.97 0.98 § 0.91 to 1.00 0.99 0.98 to 1.00 Intra-abdominal fat thickness 0.97 § 0.90 to 0.99 0.97 § 0.90 to 0.99 0.91 § 0.71 to 0.97 0.87 † 0.51 to 0.97 0.97 0.88 to 0.99 Mesenteric fat thickness 0.30 −0.21 to 0.67 0.17 −0.31 to 0.58 0.26 −0.11 to 0.57 0.47 −0.24 to 0.86 0.51 −0.28 to 0.88 WFI 0.90 § 0.73 to 0.97 0.95 § 0.85 to 0.99 0.84 ‡ 0.56 to 0.95 0.87 ‡ 0.66 to 0.96 0.97 0.92 to 0.99 MAR-A 0.83 ‡ 0.59 to 0.93 0.90 ‡ 0.69 to 0.97 0.92 § 0.78 to 0.98 0.82 † 0.40 to 0.96 0.96 0.88 to 0.99 MAR-B 0.97 § 0.91 to 0.99 0.98 § 0.93 to 0.99 0.85 ‡ 0.55 to 0.95 0.95 § 0.88 to 0.98 0.99 0.96 to 1.00
Lin’s concordance correlations were used to evaluate repeatability and reproducibility between two radiologists, while intraclass correlation was used to evaluate reproducibility for all three radiologists.
CI, confidence interval; ICC, intraclass correlation coefficient; MAR-A, maximum abdominal ratio A (maximum subcutaneous fat thickness A/intra-abdominal fat); MAR-B, maximum abdominal ratio B (maximum subcutaneous fat thickness B/intra-abdominal fat); WFI, wall fat index (minimum subcutaneous fat/maximum preperitoneal fat).
Get Radiology Tree app to read full this article<
Get Radiology Tree app to read full this article<
Get Radiology Tree app to read full this article<
Get Radiology Tree app to read full this article<
Table 4
Repeatability and Reproducibility of Ultrasound Measurements and Indexes of Abdominal Adipose Thicknesses in Group B ( n = 29)
Measure Raters Repeatability Reproducibility Radiologist 1 Radiologist 1 vs Radiologist 2 Radiologist 1 vs Radiologist 3 Radiologist 2 vs Radiologist 3 Total ρ 95% CI ρ 95% CI ρ 95% CI ρ 95% CI ICC 95% CI Minimum subcutaneous fat thickness 0.93 ‡ 0.83 to 0.97 0.78 ∗ 0.45 to 0.93 0.76 ∗ 0.40 to 0.92 0.86 ‡ 0.71 to 0.94 0.92 0.81 to 0.97 Maximum preperitoneal fat thickness 0.92 ‡ 0.82 to 0.97 0.77 ∗ 0.42 to 0.92 0.91 ‡ 0.73 to 0.97 0.80 ‡ 0.56 to 0.91 0.94 0.84 to 0.98 Maximum subcutaneous fat thickness A 0.95 ‡ 0.89 to 0.98 0.96 ‡ 0.87 to 0.98 0.97 ‡ 0.93 to 0.99 0.95 ‡ 0.88 to 0.98 0.99 0.97 to 1.00 Maximum subcutaneous fat thickness B 0.99 ‡ 0.97 to 1.00 0.98 ‡ 0.95 to 0.99 0.98 ‡ 0.95 to 0.99 0.98 ‡ 0.95 to 0.99 0.99 0.98 to 1.00 Intra-abdominal fat thickness 0.98 ‡ 0.94 to 0.99 0.91 ‡ 0.76 to 0.97 0.93 ‡ 0.80 to 0.98 0.93 ‡ 0.84 to 0.97 0.97 0.93 to 0.99 Mesenteric fat thickness 0.51 ∗ 0.18 to 0.74 0.21 −0.27 to 0.60 0.12 −0.39 to 0.58 0.42 ∗ 0.15 to 0.66 0.53 −0.11 to 0.84 WFI 0.90 ‡ 0.76 to 0.95 0.72 ∗ 0.31 to 0.90 0.80 † 0.51 to 0.93 0.75 † 0.50 to 0.88 0.90 0.75 to 0.97 MAR-A 0.98 ‡ 0.95 to 0.99 0.96 ‡ 0.88 to 0.99 0.95 ‡ 0.86 to 0.98 0.93 ‡ 0.85 to 0.97 0.98 0.95 to 0.99 MAR-B 0.95 ‡ 0.91 to 0.97 0.87 ‡ 0.66 to 0.96 0.87 ‡ 0.75 to 0.93 0.77 ‡ 0.59 to 0.88 0.93 0.83 to 0.98
Lin’s concordance correlations were used to evaluate repeatability and reproducibility between two radiologists, while intraclass correlation was used to evaluate reproducibility for all three radiologists.
CI, confidence interval; ICC, intraclass correlation coefficient; MAR-A, maximum abdominal ratio A (maximum subcutaneous fat thickness A/intra-abdominal fat); MAR-B, maximum abdominal ratio B (maximum subcutaneous fat thickness B/intra-abdominal fat); WFI, wall fat index (minimum subcutaneous fat/maximum preperitoneal fat).
Get Radiology Tree app to read full this article<
Get Radiology Tree app to read full this article<
Get Radiology Tree app to read full this article<
Get Radiology Tree app to read full this article<
Get Radiology Tree app to read full this article<
Get Radiology Tree app to read full this article<
Repeatability
Get Radiology Tree app to read full this article<
Discussion
Get Radiology Tree app to read full this article<
Get Radiology Tree app to read full this article<
Get Radiology Tree app to read full this article<
Get Radiology Tree app to read full this article<
Get Radiology Tree app to read full this article<
Get Radiology Tree app to read full this article<
Get Radiology Tree app to read full this article<
Get Radiology Tree app to read full this article<
Get Radiology Tree app to read full this article<
Get Radiology Tree app to read full this article<
Get Radiology Tree app to read full this article<
Get Radiology Tree app to read full this article<
Conclusions
Get Radiology Tree app to read full this article<
References
1. Heymsfield S.B., Baumgartner R.M., Allison D.B., et. al.: Evaluation of total and regional adiposity.Bray G.A.Bouchard C.Handbook of Obesity: Etiology and Pathophysiology.2005.Taylor & Francis e-LibraryNew Orleans, LA:pp. 33-79.
2. Poulos S.P., Hausman D.B., Hausman G.J.: The development and endocrine functions of adipose tissue. Mol Cell Endocrinol 2010; 323: pp. 20-34.
3. Galic S., Oakhill J.S., Steinberg G.R.: Adipose tissue as an endocrine organ. Mol Cell Endocrinol 2010; 316: pp. 129-139.
4. Quak S.H., Furnes R., Lavine J., et. al., Obesity Working Group: Obesity in children and adolescents. J Pediatr Gastroenterol Nutr 2008; 47: pp. 254-259.
5. Kelly T., Yang W., Chen C.S., et. al.: Global burden of obesity in 2005 and projections to 2030. Int J Obes (Lond) 2008; 32: pp. 1431-1437.
6. Cameron A.J., Shaw J.E., Zimmet P.Z.: The metabolic syndrome: prevalence in worldwide populations. Endocrinol Metab Clin North Am 2004; 33: pp. 351-375.
7. Wild S., Roglic G., Green A., et. al.: Global prevalence of diabetes: estimates for the year 2000 and projections for 2030. Diabetes Care 2004; 27: pp. 1047-1053.
8. Després J.P., Lemieux S., Lamarche B., et. al.: The insulin resistance-dyslipidemic syndrome: contribution of visceral obesity and therapeutic implications. Int J Obes Relat Metab Disord 1995; 19: pp. S76-86.
9. Wajchenberg B.L.: Subcutaneous and visceral adipose tissue: their relation to the metabolic syndrome. Endocr Rev 2000; 21: pp. 697-738.
10. Fox C.S., Massaro J.M., Hoffmann U., et. al.: Abdominal visceral and subcutaneous adipose tissue compartments: association with metabolic risk factors in the Framingham Heart Study. Circulation 2007; 116: pp. 39-48.
11. Porter S.A., Massaro J.M., Hoffmann U., et. al.: Abdominal subcutaneous adipose tissue: a protective fat depot?. Diabetes Care 2009; 32: pp. 1068-1075.
12. Taksali S.E., Caprio S., Dziura J., et. al.: High visceral and low abdominal subcutaneous fat stores in the obese adolescent: a determinant of an adverse metabolic phenotype. Diabetes 2008; 57: pp. 367-371.
13. Shulman G.I.: Cellular mechanisms of insulin resistance. J Clin Invest 2000; 106: pp. 171-176.
14. Ravussin E., Smith S.R.: Increased fat intake, impaired fat oxidation, and failure of fat cell proliferation result in ectopic fat storage, insulin resistance, and type 2 diabetes mellitus. Ann N Y Acad Sci 2002; 967: pp. 363-378.
15. Vlachos I.S., Hatziioannou A., Perelas A., et. al.: Sonographic assessment of regional adiposity. AJR Am J Roentgenol 2007; 189: pp. 1545-1553.
16. Rothman K.J.: BMI-related errors in the measurements of obesity. Int J Obes (Lond) 2008; 32: pp. S56-S59.
17. Wei M., Gaskill S.P., Haffner S.M., et. al.: Waist circumference as the best predictor of noninsulin dependent diabetes mellitus (NIDDM) compared to body mass index, waist/hip ratio and other anthropometric measurements in Mexican Americans—a 7-year prospective study. Obes Res 1997; 5: pp. 16-23.
18. Bonora E., Micciolo R., Ghiatas A.A., et. al.: Is it possible to derive a reliable estimate of human visceral and subcutaneous abdominal adipose tissue from simple anthropometric measurements?. Metabolism 1995; 44: pp. 1617-1625.
19. Völgyi E., Tylavsky F.A., Lyytikäinen A., et. al.: Assessing body composition with DXA and bioimpedance: effects of obesity, physical activity, and age. Obesity (Silver Spring) 2008; 16: pp. 700-705.
20. Andreoli A., Scalzo G., Masala S., et. al.: Body composition assessment by dual-energy X-ray absorptiometry (DXA). Radiol Med 2009; 114: pp. 286-300.
21. Salamone L.M., Fuerst T., Visser M., et. al.: Measurement of fat mass using DEXA: a validation study in elderly adults. J Appl Physiol 2000; 89: pp. 345-352.
22. Clasey J.L., Bouchard C., Teates C.D., et. al.: The use of anthropometric and dual-energy X-ray absorptiometry (DXA) measures to estimate total abdominal and abdominal visceral fat in men and women. Obes Res 1999; 7: pp. 256-264.
23. Snijder M.B., Visser M., Dekker J.M., et. al.: The prediction of visceral fat by dual-energy X-ray absorptiometry in the elderly: a comparison with computed tomography and anthropometry. Int J Obes Relat Metab Disord 2002; 26: pp. 984-993.
24. Rössner S., Bo W.J., Hiltbrandt E., et. al.: Adipose tissue determinations in cadavers: a comparison between cross-sectional planimetry and computed tomography. Int J Obes 1990; 14: pp. 893-902.
25. Sobol W., Rossner S., Hinson B., et. al.: Evaluation of a new magnetic resonance imaging method for quantitating adipose tissue areas. Int J Obes 1991; 15: pp. 589-599.
26. Lönn L., Starck G., Alpsten M., et. al.: Determination of tissue volumes. A comparison between CT and MR imaging. Acta Radiol 1999; 40: pp. 314-321.
27. Armellini F., Zamboni M., Rigo L., et. al.: The contribution of sonography to the measurement of intra-abdominal fat. J Clin Ultrasound 1990; 18: pp. 563-567.
28. Armellini F., Zamboni M., Robbi R., et. al.: Total and intra-abdominal fat measurements by ultrasound and computerized tomography. Int J Obes Relat Metab Disord 1993; 17: pp. 209-214.
29. Suzuki R., Watanabe S., Hirai Y., et. al.: Abdominal wall fat index, estimated by ultrasonography, for assessment of the ratio of visceral fat to subcutaneous fat in the abdomen. Am J Med 1993; 95: pp. 309-314.
30. Liu K.H., Chan Y.L., Chan W.B., et. al.: Sonographic measurement of mesenteric fat thickness is a good correlate with cardiovascular risk factors: comparison with subcutaneous and preperitoneal fat thickness, magnetic resonance imaging and anthropometric indexes. Int J Obes Relat Metab Disord 2003; 27: pp. 1267-1273.
31. Liu K.H., Chan Y.L., Chan J.C., et. al.: Association of carotid intima-media thickness with mesenteric, preperitoneal and subcutaneous fat thickness. Atherosclerosis 2005; 179: pp. 299-304.
32. Tornaghi G., Raiteri R., Pozzato C., et. al.: Anthropometric or ultrasonic measurements in assessment of visceral fat? A comparative study. Int J Obes Relat Metab Disord 1994; 18: pp. 771-775.
33. Stolk R.P., Wink O., Zelissen P.M., et. al.: Validity and reproducibility of ultrasonography for the measurement of intra-abdominal adipose tissue. Int J Obes Relat Metab Disord 2001; 25: pp. 1346-1351.
34. Kim S.K., Kim H.J., Hur K.Y., et. al.: Visceral fat thickness measured by ultrasonography can estimate not only visceral obesity but also risks of cardiovascular and metabolic diseases. Am J Clin Nutr 2004; 79: pp. 593-599.
35. Abe T., Kawakami Y., Sugita M., et. al.: Use of B-mode ultrasound for visceral fat mass evaluation: comparisons with magnetic resonance imaging. Appl Human Sci 1995; 14: pp. 133-139.
36. Ribeiro-Filho F.F., Faria A.N., Azjen S., et. al.: Methods of estimation of visceral fat: advantages of ultrasonography. Obes Res 2003; 11: pp. 1488-1494.
37. Ribeiro-Filho F.F., Faria A.N., Kohlmann O., et. al.: Ultrasonography for the evaluation of visceral fat and cardiovascular risk. Hypertension 2001; 38: pp. 713-717.
38. Leite C.C., Wajchenberg B.L., Radominski R., et. al.: Intra-abdominal thickness by ultrasonography to predict risk factors for cardiovascular disease and its correlation with anthropometric measurements. Metabolism 2002; 51: pp. 1034-1040.
39. Hirooka M., Kumagi T., Kurose K., et. al.: A technique for the measurement of visceral fat by ultrasonography: comparison of measurements by ultrasonography and computed tomography. Intern Med 2005; 44: pp. 794-799.
40. Gradmark A.M., Rydh A., Renström F., et. al.: Computed tomography-based validation of abdominal adiposity measurements from ultrasonography, dual-energy x-ray absorptiometry and anthropometry. Br J Nutr 2010; 104: pp. 582-588.
41. De Lucia Rolfe E., Sleigh A., Finucane F.M., et. al.: Ultrasound measurements of visceral and subcutaneous abdominal thickness to predict abdominal adiposity among older men and women. Obesity (Silver Spring) 2010; 18: pp. 625-631.
42. Meriño-Ibarra E., Artieda M., Cenarro A., et. al.: Ultrasonography for the evaluation of visceral fat and the metabolic syndrome. Metabolism 2005; 54: pp. 1230-1235.
43. Stolk R.P., Meijer R., Mali W.P., et. al.: Secondary Manifestations of Arterial Disease Study Group. Ultrasound measurements of intraabdominal fat estimate the metabolic syndrome better than do measurements of waist circumference. Am J Clin Nutr 2003; 77: pp. 857-860.
44. Lin L.I.: A concordance correlation coefficient to evaluate reproducibility. Biometrics 1989; 45: pp. 255-268.
45. Shrout P.E., Fleiss J.L.: Intraclass correlations: uses in assessing rater reliability. Psychol Bull 1979; 86: pp. 420-428.
46. World Health Organization: Obesity: Preventing and Managing the Global Epidemic of Obesity. Report of the WHO Consultation of Obesity.1997.World Health OrganizationGeneva, Switzerland
47. Vague J.: La differénciation sexuelle, facteur determinant des formes de l’obésité. Presse Med 1947; 55: pp. 339.
48. Kissebah A.H., Krakover G.R.: Regional adiposity and morbidity. Physiol Rev 1994; 74: pp. 761-811.
49. Casassus P., Fontbonne A., Thibult N., et. al.: Upper-body fat distribution: a hyperinsulinemia-independent predictor of coronary heart disease mortality. The Paris Prospective Study. Arterioscler Thromb 1992; 12: pp. 1387-1392.
50. Bonora E., Brangani C., Pichiri I.: Obesità addominale e diabete. G Ital Cardiol 2008; 9: pp. S40-S53.
51. Poirier P.: Adiposity and cardiovascular disease: are we using the right definition of obesity?. Eur Heart J 2007; 28: pp. 2047-2048.
52. De Lorenzo A., Deurenberg P., Pietrantuono M., et. al.: How fat is obese?. Acta Diabetol 2003; 40: pp. S254-S257.
53. Machann J., Thamer C., Stefan N., et. al.: Follow-up whole-body assessment of adipose tissue compartments during a lifestyle intervention in a large cohort at increased risk for type 2 diabetes. Radiology 2010; 257: pp. 353-363.