
Background
Adipose tissues (AT) are highly metabolically active complex endocrine organs and are classified into white (WAT) and brown AT (BAT) with proinflammatory and anti-inflammatory characteristics. The current study investigated the accuracy of computed tomography (CT) to quantitatively detect BAT and WAT based on Hounsfield unit (HU) threshold compared to standardized uptake values (SUVs) of corresponding AT with the use of positron emission tomography (PET).
Methods
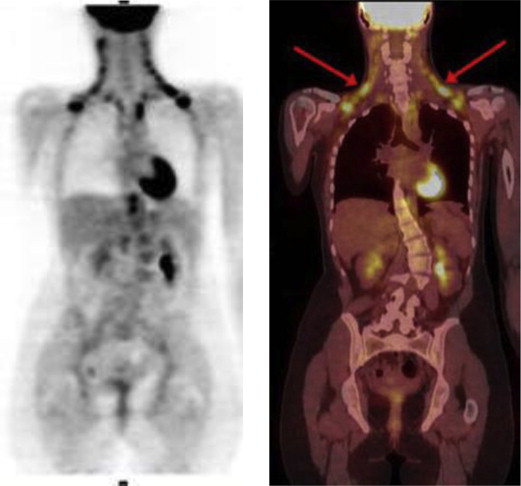
One hundred twenty-four patients who underwent whole-body 18 F-fluorodeoxyglucose ( 18 F-FDG) PET/CT were studied. The SUVs and HUs of regions of BAT and WAT were measured and compared in these scans. The receiver operator characteristic (ROC) analysis was used to detect the HU threshold values for the detection of BAT and WAT.
Results
The CT HU of BAT, with high 18 F-FDG uptake, was significantly higher compared to WAT (−67.1 ± 8.2 [−10 to −87] versus −93.5 ± 10.1 [−88 to −190], P = .0006). Generalized linear-regression models revealed that mean CT HU of BAT was 26.4 HU higher than that of WAT ( P = .001). A strong agreement between CT HU and PET SUV in measuring metabolically active AT ( r 2 = 0.81, P = .0001) was observed. The ROC curve showed that the optimal cutoff value of CT HU to detect BAT was HU ≥−87 with sensitivity of 83.3% and specificity of 100%, and the negative CT HU below −87 is highly specific for WAT.
Conclusion
In our study, CT can accurately and quantitatively detect BAT and WAT based on CT HU threshold, which is −10 to −87 for BAT and −88 to −190 for WAT.
Increased regional fat distribution plays an important part in the development of an unfavorable metabolic and cardiovascular risk profile . Adipose tissues (AT) are inclusive of two distinct types: white (WAT) and brown AT (BAT). AT is a highly metabolically active complex endocrine organ that generates various molecules with profound local and systemic effects . The most predominant portion of AT is by far WAT, which functions to store energy in the form of triglyceride-containing intracellular droplets as well as to secrete a host of hormones and cytokines (adipokines) that regulate overall energy balance by affecting the function of other tissues including the brain, muscle, and liver . The main function of BAT is to burn fat to generate heat . Despite their similar qualitative properties, WAT and BAT are now recognized as having distinct proinflammatory and anti-inflammatory functions, respectively .
Multiple studies reveal that fluorodeoxyglucose (FDG) positron emission tomography (PET) can accurately measure BAT and WAT . Furthermore, the feasibility of computed tomography (CT) to assess BAT based on Hounsfield units (HU) has been documented . This study investigated the accuracy of CT to a quantitatively detect BAT and WAT based on HU threshold compared to standardized uptake values (SUVs) of corresponding AT with PET.
Methods
Get Radiology Tree app to read full this article<
PET/CT Scan
Get Radiology Tree app to read full this article<
BAT and WAT Image Analysis
Get Radiology Tree app to read full this article<
Get Radiology Tree app to read full this article<
Statistical Analysis
Get Radiology Tree app to read full this article<
Results
Get Radiology Tree app to read full this article<
Table 1
Positron Emission Tomography Standardized Uptake Value (SUV) and Computed Tomography (CT) Hounsfield Unit (HU) Values for Brown Adipose Tissue (BAT) versus White Adipose Tissue (WAT)
Variable BAT WAT_P_ Value 18 F-Fluorodeoxyglucose uptake (SUV max ) 6.6 ± 2.8 0.9 ± 0.5 .0001 CT HU −67.1 ± 8.2 (−10 to −87) −98.5 ± 10.1 (−88 to −190) .0006
Get Radiology Tree app to read full this article<
Get Radiology Tree app to read full this article<
Table 2
Relation of Computed Tomography Hounsfield Unit (HU) Values to Brown Adipose Tissue with High Standardized Uptake Value (SUV)
Model White Adipose Tissue (Low SUV) Brown Adipose Tissue (High SUV) HU 0 (Reference) 26.4 (95% confidence interval 14.5–38.3), P = .001
Generalized linear regression models adjusted for age, gender, body mass index, and conventional risk factors.
Get Radiology Tree app to read full this article<
Get Radiology Tree app to read full this article<
Table 3
Area Under the Receiver Operating Characteristic Curve (AUC) to Detect Brown Adipose Tissue with High Standardized Uptake Value (SUV) Based on Computed Tomography Hounsfield Unit Values
Variable AUC (±SE) 95% Confidence Interval_P_ Value Criterion Specificity Sensitivity Brown Adipose Tissue (High SUV) 0.97 (0.03) 0.69-1.0 .0001 −87 100% 83.3%
Get Radiology Tree app to read full this article<
Discussion
Get Radiology Tree app to read full this article<
Get Radiology Tree app to read full this article<
Get Radiology Tree app to read full this article<
Clinical Implications
Get Radiology Tree app to read full this article<
Limitations
Get Radiology Tree app to read full this article<
Conclusions
Get Radiology Tree app to read full this article<
Acknowledgments
Get Radiology Tree app to read full this article<
References
1. Young P., Arch J.R., Ashwell M.: Brown adipose tissue in the parametrial fat pad of the mouse. FEBS Lett 1984; 167: pp. 10-14.
2. Tiraby C., Langin D.: Conversion from white to brown adipocytes: a strategy for the control of fat mass?. Trends Endocrinol Metab 2003; 14: pp. 439-441.
3. Tilg H., Moschen A.R.: Adipocytokines: mediators linking adipose tissue, inflammation and immunity. Nat Rev Immunol 2006; 6: pp. 772-783.
4. Gesta S., Tseng Y.H., Kahn C.R.: Developmental origin of fat: tracking obesity to its source. Cell 2007; 131: pp. 242-256.
5. Cannon B., Nedergaard J.: Brown adipose tissue: function and physiological significance. Physiol Rev 2004; 84: pp. 277-359.
6. Farmer S.R.: Molecular determinants of brown adipocyte formation and function. Genes Dev 2008; 22: pp. 1269-1275.
7. Cannon B., Hedin A., Nedergaard J.: Exclusive occurrence of thermogenin antigen in brown adipose tissue. FEBS Lett 1982; 150: pp. 129-132.
8. Jeong J.W., Jeong M.H., Yun K.H., et. al.: Echocardiographic epicardial fat thickness and coronary artery disease. Circ J 2007; 71: pp. 536-539.
9. Maurovich-Horvat P., Massaro J., Fox C.S., et. al.: Comparison of anthropometric, area- and volume-based assessment of abdominal subcutaneous and visceral adipose tissue volumes using multi-detector computed tomography. Int J Obes (Lond) 2007; 31: pp. 500-506.
10. Iacobellis G., Barbaro G.: The double role of epicardial adipose tissue as pro- and anti-inflammatory organ. Horm Metab Res 2008; 40: pp. 442-445.
11. Almind K., Manieri M., Sivitz W.I., et. al.: Ectopic brown adipose tissue in muscle provides a mechanism for differences in risk of metabolic syndrome in mice. Proc Natl Acad Sci USA 2007; 104: pp. 2366-2371.
12. Virtanen K.A., Lidell M.E., Orava J., et. al.: Functional brown adipose tissue in healthy adults. N Engl J Med 2009; 360: pp. 1518-1525.
13. van Marken Lichtenbelt W.D., Vanhommerig J.W., Smulders N.M., et. al.: Cold-activated brown adipose tissue in healthy men. N Engl J Med 2009; 360: pp. 1500-1508.
14. Baba S., Jacene H.A., Engles J.M., et. al.: Hounsfield units of brown adipose tissue increase with activation: preclinical and clinical studies. J Nucl Med 2010; 51: pp. 246-250.
15. Hu H.H., Chung S.A., Nayak K.S., et. al.: Differential computed tomographic attenuation of metabolically active and inactive adipose tissues: preliminary findings. J Comput Assist Tomogr 2011; 35: pp. 65-71.
16. Himms-Hagen J.: Brown adipose tissue thermogenesis: interdisciplinary studies. FASEB J 1990; 4: pp. 2890-2898.
17. Ricquier D., Bouillaud F.: Mitochondrial uncoupling proteins: from mitochondria to the regulation of energy balance. J Physiol 2000; 529: pp. 3-10.
18. Kershaw E.E., Flier J.S.: Adipose tissue as an endocrine organ. J Clin Endocrinol Metab 2004; 89: pp. 2548-2556.
19. Kopecky J., Clarke G., Enerback S., et. al.: Expression of the mitochondrial uncoupling protein gene from the aP2 gene promoter prevents genetic obesity. J Clin Investig 1995; 96: pp. 2914-2923.
20. Crandall D.L., Hausman G.J., Kral J.G.: A review of the microcirculation of adipose tissue: anatomic, metabolic, and angiogenic perspectives. Microcirculation 1997; 4: pp. 211-232.
21. Pilgrim C.: DNA synthesis and differentiation in developing white adipose tissue. Dev Biol 1971; 26: pp. 69-76.
22. Poissonnet C.M., Burdi A.R., Bookstein F.L.: Growth and development of human adipose tissue during early gestation. Early Hum Dev 1983; 8: pp. 1-11.
23. Rakow L., Beneke G., Brauchle I.: [Comparative morphological and chemical studies on murine white and brown adipose tissue in 2 types of obesity]. Beitrage Pathol 1971; 144: pp. 184-200.
24. Saito M., Okamatsu-Ogura Y., Matsushita M., et. al.: High incidence of metabolically active brown adipose tissue in healthy adult humans: effects of cold exposure and adiposity. Diabetes 2009; 58: pp. 1526-1531.