
Rationale and Objectives
Acoustic noise both in terms of its magnitude and frequency during magnetic resonance imaging (MRI) scan is influenced by imaging parameters and pulse sequences. It varies because of many different factors such as structure, materials, and magnetic field strength. The purpose of our study is to evaluate the characteristics of acoustic noise independent of MRI scan protocol by measuring a gradient-pulse-to-acoustic-noise transfer function (GPAN-TF) at various MRI scanners.
Materials and Methods
We measured sound pressure levels in the frequency domain in a 0.4-T, seven 1.5-T, and three 3.0-T clinical MRI systems when applying a simple narrower trapezoidal gradient pulse. We calculated a GPAN-TF [μPa/(mT/m)] in each gradient coil (ie, X, Y, and Z-axis) by the deconvolution process.
Results
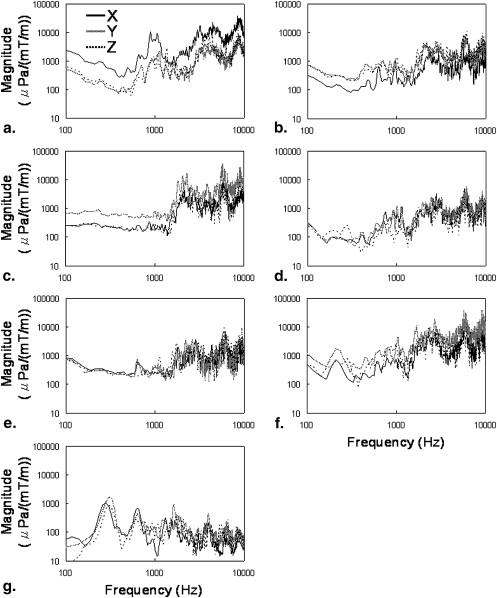
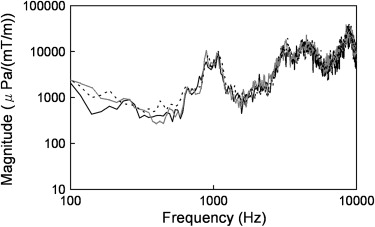
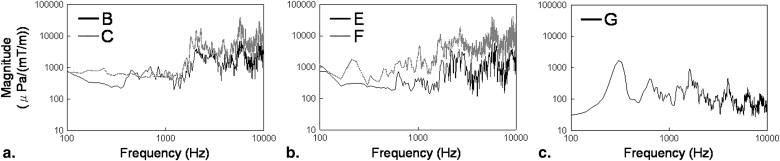
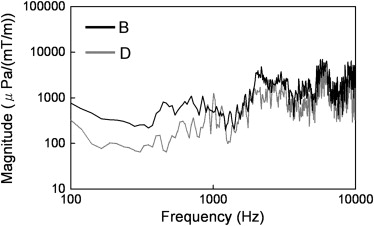
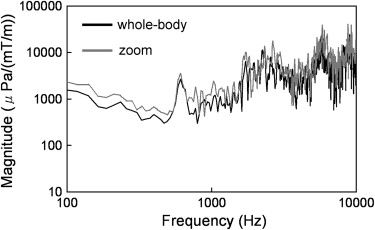
GPAN-TF at a high-frequency range (1000–10,000 Hz) was larger than that at low frequency for all MRI ( P <0.01) scanners except for a low static field machine. For high frequency (>1000 Hz), the 3.0-T MRI scanner had a larger GPAN-TF than that of 0.4-T and 1.5-T ( P < .01). MR scanner with a vacuum chamber reduced GPAN-TF at a lower frequency ( P < .01), but this effect decreased at higher frequency.
Conclusion
GPAN-TF analysis makes it possible to obtain more detailed information on acoustic noise properties among MRI scanners.
Acoustic noise during magnetic resonance imaging (MRI) is primarily caused by Lorenz forces induced in the scanner as electric currents are switched in the gradient coils within the static magnetic field. The noise can not only cause anxiety, stress, and annoyance, but temporary or permanent shift in the threshold of hearing as well . There are also studies that this sound affects the results of functional MRI . In addition, the noise interferes with verbal communication and pediatric imaging.
In recent years, various acoustic noise control systems have been developed and put into practice . For example, the gradient coil is positioned inside a vacuum chamber to reduce the acoustic noise . On the other hand, fast imaging techniques have a higher dB/dt, and MRI scanners with a high static magnetic field have proliferated. Therefore, acoustic noise during MRI has become a greater concern in clinical practice .
Get Radiology Tree app to read full this article<
Get Radiology Tree app to read full this article<
Get Radiology Tree app to read full this article<
Materials and methods
Equipment
Get Radiology Tree app to read full this article<
Table 1
MRI Equipment Specifications
MR System A B C D E F G Type Philips Gyroscan INTERA GE SIGNA EXCITE HD GE SIGNA EXCITE HDx HITACHI APERTO Eterna Number of MRI scanners 3 1 1 1 1 2 1 Static field Strength (T) 1.5 1.5 3 1.5 1.5 3 0.4 Vacuum chamber − − − + − − − Twin gradient (14) − − − − − + − Characteristic of trapezoidal input waveform Gradient pulse amplitude (mT/m) 4, 8, 12, 16, 20 22 22 22 22 22 22 Rise and fall times (msec) 0.2 0.3 0.3 0.3 0.3 0.3 0.4 Gradient pulse on time (msec) 1.0 1.1 1.1 1.1 1.1 1.1 3.0 The dimensions of the examination room Width (mm) 4690 6400 6490 6600 5400 5800 5040 5020 4710 4200 Depth (mm) 7090 3950 3400 8250 8400 7600 7490 7200 7190 5750 Height (mm) 2520 2530 2520 2800 3270 3350 2730 2900 2740 2700
MR images A–F have superconducting magnet and shielded gradient coil. Only imager G is a permanent magnet open system.
Get Radiology Tree app to read full this article<
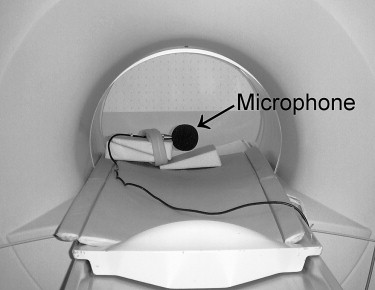
Setup
Get Radiology Tree app to read full this article<
Get Radiology Tree app to read full this article<
Data Acquisition
Get Radiology Tree app to read full this article<
Get Radiology Tree app to read full this article<
Determination of GPAN-TF
Get Radiology Tree app to read full this article<
an(t)=∫∞0h(τ)gp(t−τ)dτ, a
n
(
t
)
=
∫
0
∞
h
(
τ
)
g
p
(
t
−
τ
)
d
τ
,
where, h (τ) is transfer function. Because convolution in the time domain becomes multiplication in the frequency domain, we take the Fourier transform of Equation 1 .
AN(f)=H(f)×GP(f), A
N
(
f
)
=
H
(
f
)
×
G
P
(
f
)
,
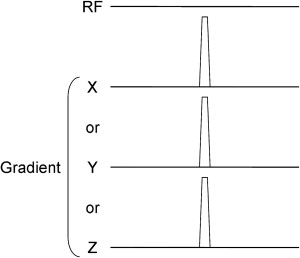
where H ( f ) is the frequency response function (ie, GPAN-TF), which is not dependent on the input and represents acoustic noise transfer property of the system. AN ( f ) is the gradient-induced acoustic noise measured by ISLM as previously mentioned. On the other hand, we assumed that the input pulse is approximately a simple narrow trapezoidal waveform as shown in Figure 2 , then we obtain the Fourier transform of the gradient pulse, that is GP ( f ). Thus, we calculated the GPAN-TF (= AN ( f )/ GP ( f )), then compared among the MRI scanners as follows ( Table 1 ).
Get Radiology Tree app to read full this article<
Results
Get Radiology Tree app to read full this article<
Get Radiology Tree app to read full this article<
Get Radiology Tree app to read full this article<
Get Radiology Tree app to read full this article<
Get Radiology Tree app to read full this article<
Get Radiology Tree app to read full this article<
Get Radiology Tree app to read full this article<
Get Radiology Tree app to read full this article<
Get Radiology Tree app to read full this article<
Get Radiology Tree app to read full this article<
Discussion
Get Radiology Tree app to read full this article<
Get Radiology Tree app to read full this article<
Get Radiology Tree app to read full this article<
Get Radiology Tree app to read full this article<
Get Radiology Tree app to read full this article<
Get Radiology Tree app to read full this article<
Get Radiology Tree app to read full this article<
References
1. McJury M., Shellock F.: Auditory noise associated with MR procedures: a review. J Magn Reson Imaging 2000; 12: pp. 37-45.
2. Zhang N.Y., Zhu X.H., Chen W.: Influence of gradient acoustic noise on fMRI response in the human visual cortex. Magn Reson Med 2005; 54: pp. 258-263.
3. Edelstein W., Kidane T., Taracila V., et. al.: Active-passive gradient shielding for MRI acoustic noise reduction. Magn Reson Med 2005; 53: pp. 1013-1017.
4. Edelstein W., Hedeen R., Mallozzi R., et. al.: Making MRI quieter. Magn Reson Imaging 2002; 20: pp. 155-163.
5. Goldman A., Gossman W., Friedlander P.C.: Reduction of sound levels with antinoise in MR imaging. Radiology 1989; 173: pp. 549-550.
6. Katsunuma A., Takamori H., Sakakura Y., et. al.: Quiet MRI with novel acoustic noise reduction. MAGMA 2002; 13: pp. 139-144.
7. Shellock F.G., Crues J.V.: MR procedures: Biologic effects, safety, and patient care. Radiology 2004; 232: pp. 635-652.
8. Tomasi D., Ernst T.: Echo planar imaging at 4 Tesla with minimum acoustic noise. J Magn Reson Imaging 2003; 18: pp. 128-130.
9. Miyati T., Banno T., Fujita H., et. al.: Acoustic noise analysis in echo planar imaging: multicenter trial and comparison with other pulse sequences. IEEE Trans Med Imaging 1999; 18: pp. 733-736.
10. Price D., De Wilde J., Papadaki A., et. al.: Investigation of acoustic noise on 15 MRI scanners from 0.2 T to 3 T. J Magn Reson Imaging 2001; 13: pp. 288-293.
11. Hedeen R., Edelstein W.: Characterization and prediction of gradient acoustic noise in MR imagers. Magn Reson Med 1997; 37: pp. 7-10.
12. More S., Lim T., Li M., et. al.: Acoustic noise characteristics of a 4 Tesla MRI scanner. J Magn Reson Imaging 2006; 23: pp. 388-397.
13. National Electrical Manufacturers Association: Acoustic noise measurement procedure for diagnostic magnetic resonance imaging devices. NEMA Standards Publication MS-4 2006;
14. Harvey P.: The modular (twin) gradient coil–high resolution, high contrast, diffusion weighted EPI at 1.0 Tesla. MAGMA 1999; 8: pp. 43-47.