
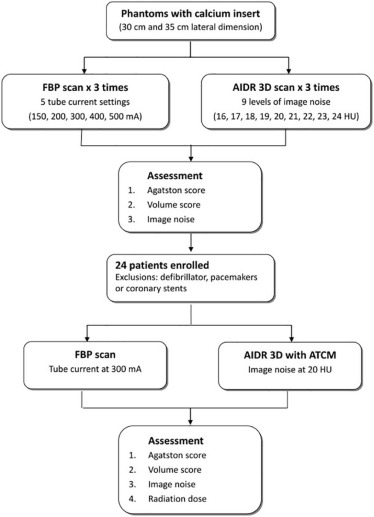
Rationale and Objectives
We aimed to evaluate integrated adaptive iterative dose reduction 3D (AIDR 3D) algorithm in automatic tube current modulation (ATCM) for the quantification of coronary artery calcium score (CACS) and cardiac risk stratification.
Materials and Methods
A thoracic phantom with calcium inserts of known densities was scanned with filtered back projection (FBP) and AIDR 3D algorithms in small- and medium-sized phantoms. Twenty-four patients underwent two consecutive scans of CACS with FBP and AIDR 3D algorithms. The absolute Agatston score, Agatston score risk, volume score, and Agatston score percentile-based risk were compared, and concordance coefficients and agreement plots were made.
Results
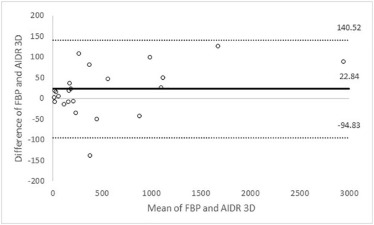
Agatston and volume scores were significantly different between the phantom sizes ( P < .01). There were no significant differences in the Agatston scores between FBP and AIDR 3D for the medium phantoms ( P = .25). In the patients, there were no significant differences in Agatston and volume scores between FBP and AIDR 3D ( P = .06 and P = .09, respectively). The correlation coefficients of Agatston and volume scores with AIDR 3D were excellent compared to those of FBP. There were no significant differences in Agatston score risk and Agatston score percentile-based risk between FBP and AIDR 3D ( P = .74 and P = 1, respectively). There was mean dose reduction of 57.8% ± 18.6% for AIDR 3D.
Conclusion
The absolute Agatston score differed between FBP and AIDR 3D reconstructions. However, the cardiac risk categorizations of the two methods were comparable. An integrated AIDR 3D algorithm with automatic tube current modulation enables radiation dose savings at a consistent noise level without sacrificing CACS.
Introduction
To date, coronary artery disease (CAD) is a major cause of death and disability worldwide . An early and accurate diagnosis of CAD should prompt aggressive treatment and lead to the prevention of heart attacks and unfavorable outcomes . Because the extent of coronary artery calcium (CAC), which is a pathognomonic hallmark of CAD, is strongly correlated with the degree of atherosclerosis, CAC scanning has emerged to assess the risk for CAD by using the CAC score (CACS) . CAC scanning serves as a noninvasive and convenient diagnostic tool and provides excellent diagnostic value for detecting calcified plaque in patients with CAD, particularly in the intermediate-risk cohort . However, CAC scanning can be associated with higher radiation exposure using the filtered back projection (FBP) reconstruction method, which can result in an effective dose range of 1.2–2.0 mSv . Based on the principle of “as low as reasonably achievable,” radiation exposure should be kept at an acceptable minimum through the optimization of the CAC scanning without losing imaging quality.
Currently, several approaches to reduce radiation exposure have been developed, including the tube current and voltage reduction, the prospective scanning with electrocardiogram modulation, and new reconstruction methods . However, tube current and voltage reductions will lead to increased image noise, which is a reliable index for image quality. Because it is image quality that constrains the dose, maintaining a reasonable image noise level for CAC scanning across different patient sizes is important. The consensus report by McCollough et al. established an image noise target on the basis of three different patient sizes that are categorized by the lateral chest width on computed tomography (CT) .
Get Radiology Tree app to read full this article<
Get Radiology Tree app to read full this article<
Materials and Methods
Get Radiology Tree app to read full this article<
Get Radiology Tree app to read full this article<
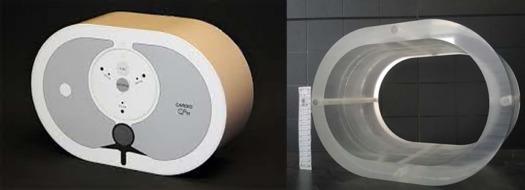
Cardiac Phantom
Get Radiology Tree app to read full this article<
Get Radiology Tree app to read full this article<
Patient Cohort
Get Radiology Tree app to read full this article<
CT Protocol
Get Radiology Tree app to read full this article<
Get Radiology Tree app to read full this article<
Image Reconstruction
Get Radiology Tree app to read full this article<
Quantitative Analysis
Get Radiology Tree app to read full this article<
Get Radiology Tree app to read full this article<
Radiation Dose Estimation
Get Radiology Tree app to read full this article<
Statistical Analysis
Get Radiology Tree app to read full this article<
Results
Cardiac Phantom
Get Radiology Tree app to read full this article<
TABLE 1
Agatston Score, Volume Score, and Image Noise for Phantom
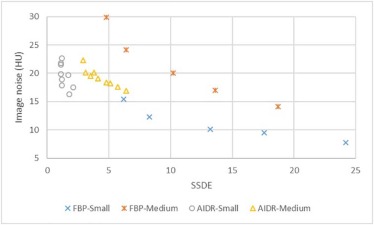
Size Parameter Reconstruction Algorithm FBP (mA) AIDR 3D (SD) 150 200 300 400 500 24 23 22 21 20 19 18 17 16 Small Agatston score \* 765 761 761 761 754 783 789 794 795 781 781 764 771 766 Volume score \* 657 646 653 661 662 693 709 715 705 694 688 689 707 686 Image noise (HU) \* 15.4 12.3 10.1 9.5 7.8 21.8 21.5 19.9 22.7 18.9 17.9 19.7 16.3 17.5 Medium Agatston score † 728 719 717 717 716 715 722 714 718 713 717 710 712 708 Volume score \* 703 681 675 676 680 654 656 643 646 636 662 646 645 639 Image noise (HU) † 29.9 24.1 20.0 17.0 14.1 22.3 20.1 19.5 20.1 19.1 18.4 18.2 17.6 16.9
Abbreviations: AIDR 3D, adaptive iterative dose reduction 3D; FBP, filtered back projection; HU, Hounsfield unit; SD, standard deviation of noise.
Get Radiology Tree app to read full this article<
Get Radiology Tree app to read full this article<
Get Radiology Tree app to read full this article<
Get Radiology Tree app to read full this article<
TABLE 2
Radiation Dose for Phantom
Size Parameter Reconstruction Algorithm FBP (mA) AIDR 3D (SD) 150 200 300 400 500 24 23 22 21 20 19 18 17 16 Small CTDI vol (mGy) 4.1 5.5 8.8 11.7 16.1 0.7 0.7 0.7 0.8 0.8 1.0 1.1 1.2 1.4 SSDE (mGy) 6.2 8.3 13.2 17.6 24.2 1.1 1.1 1.1 1.2 1.2 1.2 1.7 1.8 2.1 Medium CTDI vol (mGy) 4.1 5.5 8.8 11.7 16.1 2.5 2.7 3.0 3.3 3.5 4.1 4.4 4.9 5.5 SSDE (mGy) 4.8 6.4 10.2 13.6 18.7 2.9 3.1 3.5 3.8 4.1 4.8 5.1 5.7 6.4
Abbreviations: AIDR 3D, adaptive iterative dose reduction 3D; CTDI vol , volume CT dose index; FBP, filtered back projection; SD, standard deviation of noise; SSDE, size-specific dose estimate.
Get Radiology Tree app to read full this article<
Patient Cohort
Get Radiology Tree app to read full this article<
TABLE 3
Patient Characteristics
Patients (n = 24) Sex (M:F) 21:3 Age (y) 66 ± 10 Heart rate (bpm) 63 ± 9 Chest dimension (cm) 34.3 ± 2.3 Body mass index (kg/m 2 ) 26.2 ± 2.9
Data presented as mean and standard deviation.
TABLE 4
Agatston Score, Volume Score, Agatston Score Risk Category, Agatston Score Percentile-based Risk Category, Image Noise, and Radiation Dose for Patients
Reconstruction Algorithm FBP AIDR 3D_P_ Value Agatston score 258 (139, 896) 226 (138, 993) .06 Volume score 271 (123, 796) 268 (117, 783) .09 Agatston score risk category (0/1/2/3/4) 4 (0/3/2/9/10) 4 (0/4/1/9/10) .92 Agatston score percentile-based risk category (1/2/3/4/5/6) 6 (0/0/2/5/7/10) 6 (0/0/2/5/7/10) 1 Image noise (HU) 16.5 ± 4.1 16.9 ± 1.9 .63 SSDE (mGy) 13.9 ± 1.2 5.7 ± 2.2 <.01 Effective dose (mSV) 2.1 ± 0.3 0.9 ± 0.4 <.01
Abbreviations: AIDR 3D, adaptive iterative dose reduction 3D; FBP, filtered back projection; HU, Hounsfield unit; SSDE, size-specific dose estimate.
Agatston and volume scores presented as median and interquartile range in parenthesis. Agatston score risk and Agatston score percentile-based risk categories presented as mode and frequency of each category in parenthesis. Image noise, SSDE, and effective dose presented as mean and standard deviation.

Get Radiology Tree app to read full this article<
Get Radiology Tree app to read full this article<
Discussion
Get Radiology Tree app to read full this article<
Get Radiology Tree app to read full this article<
Get Radiology Tree app to read full this article<
Get Radiology Tree app to read full this article<
Get Radiology Tree app to read full this article<
Get Radiology Tree app to read full this article<
Get Radiology Tree app to read full this article<
Acknowledgments
Get Radiology Tree app to read full this article<
Get Radiology Tree app to read full this article<
Get Radiology Tree app to read full this article<
Get Radiology Tree app to read full this article<
References
1. Thom T., Haase N., Rosamond W., et. al.: Heart Disease and Stroke Statistics—2006 update: a report from the American Heart Association Statistics Committee and Stroke Statistics Subcommittee. Circulation 2006; 113: pp. e85-e151.
2. Hecht H.S.: Coronary artery calcium: utilization for primary prevention of CHD. Curr Cardiol Rep 2011; 13: pp. 465-474.
3. Sung J.H., Yeboah J., Lee J.E., et. al.: Diagnostic value of coronary artery calcium score for cardiovascular disease in African Americans: the Jackson Heart Study. Br J Med Med Res 2016; 11:
4. Polonsky T.S., McClelland R.L., Jorgensen N.W., et. al.: Coronary artery calcium score and risk classification for coronary heart disease prediction. JAMA 2010; 303: pp. 1610-1616.
5. McClelland R.L., Jorgensen N.W., Budoff M., et. al.: 10-Year coronary heart disease risk prediction using coronary artery calcium and traditional risk factors: derivation in the MESA (Multi-Ethnic Study of Atherosclerosis) with validation in the HNR (Heinz Nixdorf Recall) Study and the DHS (Dallas Heart Study). J Am Coll Cardiol 2015; 66: pp. 1643-1653.
6. Fujimoto N., Iseki K., Tokuyama K., et. al.: Significance of coronary artery calcification score (CACS) for the detection of coronary artery disease (CAD) in chronic dialysis patients. Clin Chim Acta 2006; 367: pp. 98-102.
7. Detrano R., Guerci A.D., Carr J.J., et. al.: Coronary calcium as a predictor of coronary events in four racial or ethnic groups. N Engl J Med 2008; 358: pp. 1336-1345.
8. Hecht H.S.: Coronary artery calcium scanning: past, present, and future. JACC Cardiovasc Imaging 2015; 8: pp. 579-596.
9. Matsuura N., Urashima M., Fukumoto W., et. al.: Radiation dose reduction at coronary artery calcium scoring by using a low tube current technique and hybrid iterative reconstruction. J Comput Assist Tomogr 2015; 39: pp. 119-124.
10. van der Bijl N., de Bruin P.W., Geleijns J., et. al.: Assessment of coronary artery calcium by using volumetric 320-row multi-detector computed tomography: comparison of 0.5 mm with 3.0 mm slice reconstructions. Int J Cardiovasc Imaging 2010; 4: pp. 473-482.
11. Dey D., Nakazato R., Pimentel R., et. al.: Low radiation coronary calcium scoring by dual-source CT with tube current optimization based on patient body size. J Cardiovasc Comput Tomogr 2012; 6: pp. 113-120.
12. Funabashi N., Irie R., Aiba M., et. al.: Adaptive-Iterative-Dose-Reduction 3D with multisector-reconstruction method in 320-slice CT may maintain accurate measurement of the Agatston-calcium score of severe calcification even at higher pulsating-beats and low tube-current in vitro. Int J Cardiol 2013; 168: pp. 601-603.
13. Takayanagi T., Sano T., Kondo T., et. al.: [Clinical usefulness of low tube current scanning with full reconstruction and automatic patient motion correction (APMC) reconstruction in a prospective ECG-gated coronary CT angiography using 320-row area detector CT]. Nihon Hoshasen Gijutsu Gakkai Zasshi 2015; 71: pp. 237-245.
14. Itatani R., Oda S., Utsunomiya D., et. al.: Reduction in radiation and contrast medium dose via optimization of low-kilovoltage CT protocols using a hybrid iterative reconstruction algorithm at 256-slice body CT: phantom study and clinical correlation. Clin Radiol 2013; 68: pp. e128-e135.
15. McCollough C.H., Ulzheimer S., Halliburton S.S., et. al.: Coronary artery calcium: a multi-institutional, multimanufacturer international standard for quantification at cardiac CT. Radiology 2007; 243: pp. 527-538.
16. Thibault J.B., Sauer K.D., Bouman C.A., et. al.: A three-dimensional statistical approach to improved image quality for multislice helical CT. Med Phys 2007; 34: pp. 4526-4544.
17. Renker M., Geyer L.L., Krazinski A.W., et. al.: Iterative image reconstruction: a realistic dose-saving method in cardiac CT imaging?. Expert Rev Cardiovasc Ther 2013; 11: pp. 403-409.
18. Naoum C., Blanke P., Leipsic J.: Iterative reconstruction in cardiac CT. J Cardiovasc Comput Tomogr 2015; 9: pp. 255-263.
19. Blobel J., Mews J., Schuijf J.D., et. al.: Determining the radiation dose reduction potential for coronary calcium scanning with computed tomography: an anthropomorphic phantom study comparing filtered backprojection and the adaptive iterative dose reduction algorithm for image reconstruction. Invest Radiol 2013; 48: pp. 857-862.
20. Qian Z., Joshi P.H., Shaukat A.F., et. al.: Relationship between chest lateral width, tube current, image noise, and radiation exposure associated with coronary artery calcium scanning on 320-detector row CT. J Cardiovasc Comput Tomogr 2011; 5: pp. 231-239.
21. Rumberger J.A., Brundage B.H., Rader D.J., et. al.: Electron beam computed tomographic coronary calcium scanning: a review and guidelines for use in asymptomatic persons. Mayo Clin Proc 1999; 3: pp. 243-252.
22. McClelland R.L., Chung H., Detrano R., et. al.: Distribution of coronary artery calcium by race, gender, and age: results from the Multi-Ethnic Study of Atherosclerosis (MESA). Circulation 2006; 113: pp. 30-37.
23. Noferini L., Fulcheri C., Taddeucci A., et. al.: Considerations on the practical application of the size-specific dose estimation (SSDE) method of AAPM Report 204. Radiol Phys Technol 2014; 7: pp. 296-302.
24. Groen J.M., Greuter M.J., Schmidt B., et. al.: The influence of heart rate, slice thickness, and calcification density on calcium scores using 64-slice multidetector computed tomography: a systematic phantom study. Invest Radiol 2007; 42: pp. 848-855.
25. Horiguchi J., Matsuura N., Yamamoto H., et. al.: Coronary artery calcium scoring on low-dose prospective electrocardiographically-triggered 64-slice CT. Acad Radiol 2009; 16: pp. 187-193.
26. Jensen C.J., Jochims M., Eberle H.C., et. al.: Coronary artery calcium score: influence of the reconstruction interval on cardiac risk stratification in asymptomatic patients using dual-source computed tomography. Rofo 2011; 183: pp. 233-237.
27. Detrano R.C., Anderson M., Nelson J., et. al.: Coronary calcium measurements: effect of CT scanner type and calcium measure on rescan reproducibility—MESA study. Radiology 2005; 236: pp. 477-484.
28. Mahnken A.H., Wildberger J.E., Sinha A.M., et. al.: Variation of the coronary calcium score depending on image reconstruction interval and scoring algorithm. Invest Radiol 2002; 37: pp. 496-502.
29. Greenland P., Alpert J.S., Beller G.A., et. al.: 2010 ACCF/AHA guideline for assessment of cardiovascular risk in asymptomatic adults: a report of the American College of Cardiology Foundation/American Heart Association Task Force on Practice Guidelines. J Am Coll Cardiol 2011; 25: pp. e50-e103.
30. Schindler A., Vliegenthart R., Schoepf U.J., et. al.: Iterative image reconstruction techniques for CT coronary artery calcium quantification: comparison with traditional filtered back projection in vitro and in vivo. Radiology 2014; 270: pp. 387-393.
31. Tatsugami F., Higaki T., Fukumoto W., et. al.: Radiation dose reduction for coronary artery calcium scoring at 320-detector CT with adaptive iterative dose reduction 3D. Int J Cardiovasc Imaging 2015; 31: pp. 1045-1052.
32. Kim K.P., Einstein A.J., Berrington de Gonzalez A.: Coronary artery calcification screening: estimated radiation dose and cancer risk. Arch Intern Med 2009; 169: pp. 1188-1194.