
Rationale and Objectives
To evaluate thin-section computed tomography (CT) images of the lung reconstructed using adaptive statistical iterative reconstruction (ASIR) on standard- and reduced-dose CT.
Materials and Methods
Eleven cadaveric lungs were scanned by multidetector-row CT with two different tube currents (standard dose, 400 mA; reduced dose, 10 mA). The degree of ASIR was classified into six different levels: 0% (non-ASIR), 20%, 40%, 60%, 80%, and 100% (maximum-ASIR). The ASIR (20%, 60%, and 100%) images were compared with the ASIR (0%) images and assessed visually by three independent observers for image quality using a 7-point scale. The evaluation items included abnormal CT findings, normal lung structures, and subjective visual noise. The median scores assigned by the three observers were analyzed statistically. Quantitative noise was calculated by measuring the standard deviation in a circular region of interest on each selected image of ASIR (0%–100%).
Results
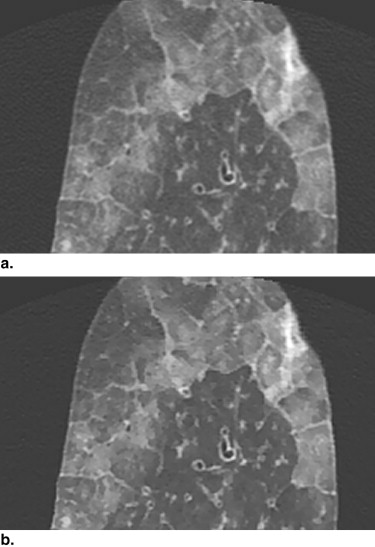
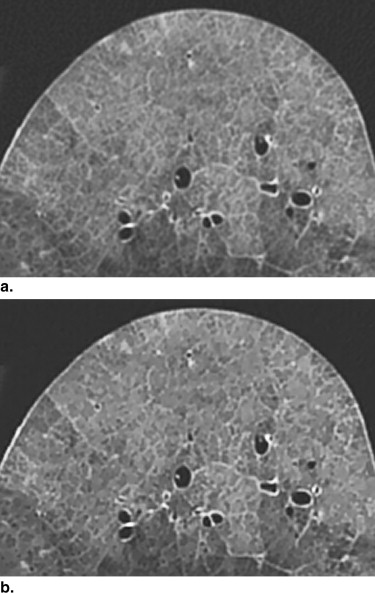
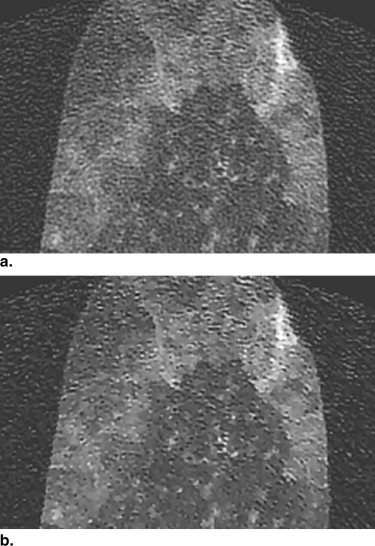
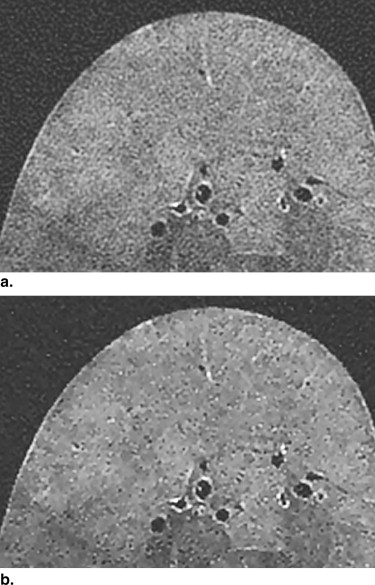
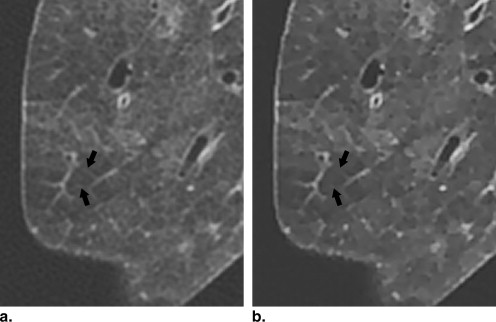
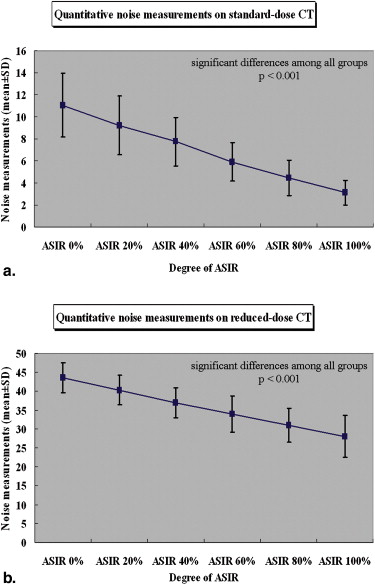
On standard-dose CT, the overall image quality significantly improved with increasing degree of ASIR ( P ≤ .009, Wilcoxon signed-ranks test with Bonferroni correction). As ASIR increased, however, intralobular reticular opacities and peripheral vessels tended to be obscure. On reduced-dose CT, the overall image quality of ASIR (100%) was significantly better than that of ASIR (20%) ( P ≤ .009). As ASIR increased, however, intralobular reticular opacities tended to be obscure. Using ASIR significantly reduced subjective and quantitative image noise on both standard- and reduced-dose CT ( P < .001, Bonferroni/Dunn’s method).
Conclusion
ASIR improves the image quality by decreasing image noise. Maximum-ASIR may be needed for improving image quality on highly reduced-dose CT. However, excessive ASIR may obscure subtle shadows.
Multidetector row computed tomography (MDCT), which is now incorporated into daily clinical practice, is a valuable tool for the evaluation of lung disease . It enables simultaneous reconstruction of thin and thick slices from the same raw data acquired from a single series, as well as the rapid scanning of a large longitudinal volume with high z-axis resolution . MDCT equipped with more rapid gantry rotation and more detector arrays has resulted in enhanced image quality by improving temporal resolution. The most recent development in the next generation of MDCT scanners is the introduction of garnet detectors. Garnet gemstone scintillators are configured to emit fluorescence when irradiated with x-rays, and have a primary decay time of only 30 nanoseconds, which is 100 times faster than that of conventional scintillator material. Such scintillators have afterglow levels that are only 25% of those of conventional scintillator materials. The most advantageous feature of MDCT with garnet detectors is its vastly improved spatial resolution, which allows smaller items or features to be distinguished in a transverse CT image and enables high image quality to be obtained even for lower radiation exposure .
Although improvements in temporal or spatial resolution will enhance CT image quality, the choice of reconstruction algorithm also affects image quality. MDCT with garnet detectors can employ adaptive statistical iterative reconstruction (ASIR). Iterative reconstruction, which is already used for image reconstruction in positron emission tomography and single photon emission CT, is a reconstruction algorithm whereby image data are corrected with an assortment of models . ASIR is a newly developed reconstruction algorithm for CT based on the iterative reconstruction algorithm. ASIR was developed in which only one corrective model is used to address image noise. This technique is used to solve one of the primary problems of dose reduction for CT with the conventional filtered back-projection algorithm. By partially correcting for the fluctuations in projection measurement because of limited photon statistics, ASIR algorithm enables a time-efficient reduction in the pixel variance that is statistically unlikely to be representative of anatomic features, with essentially no tradeoff in spatial resolution . It is expected that ASIR will provide higher CT image quality with lower noise, and will enable reconstruction of precise and clear images from reduced-dose raw data . It is thought that the use of ASIR will further improve image quality; however, to the best of our knowledge, no previous study has evaluated image quality of MDCT of the lung using ASIR. The aim of the present study was to evaluate thin-section CT images reconstructed using ASIR on standard- and reduced-dose CT, and to compare ASIR and non-ASIR images.
Materials and methods
Cadaveric Lungs and Imaging
Get Radiology Tree app to read full this article<
Get Radiology Tree app to read full this article<
Subjective Image Analysis
Get Radiology Tree app to read full this article<
Get Radiology Tree app to read full this article<
Objective Image Analysis
Get Radiology Tree app to read full this article<
Statistical Analysis
Get Radiology Tree app to read full this article<
Results
Image Quality for Abnormal Findings on Standard- and Reduced-dose CT Images
Get Radiology Tree app to read full this article<
Table 1
The Statistical Results of Image Quality for Overall Abnormal CT Findings and GGO on Standard- and Reduced-dose CT Images
Abnormal CT Findings Score Value Standard-dose (400 mA) Overall GGO Degree of ASIR (%) Mean ± SD (a) ASIR (20%) 4.02 ± 0.07 4.05 ± 0.13 (b) ASIR (60%) 4.88 ± 0.65 4.95 ± 0.23 (c) ASIR (100%) 5.61 ± 1.23 6.00 ± 0.43 Differences between two groups † P value (c) - (b) .009 ∗ .001 ∗ (c) - (a) <.001 ∗ .001 ∗ (b) - (a) .001 ∗ .009 ∗ Reduced-dose (10 mA) Overall GGO Degree of ASIR (%) Mean ± SD (a) ASIR (20%) 4.14 ± 0.26 4.19 ± 0.32 (b) ASIR (60%) 4.65 ± 0.84 5.33 ± 0.38 (c) ASIR (100%) 4.77 ± 0.69 5.33 ± 0.74 Differences between two groups † P value (c) - (b) .047 >.999 (c) - (a) .009 ∗ .012 ∗ (b) - (a) .028 .011 ∗
CT, computed tomography; ASIR, adaptive statistical iterative reconstruction; GGO, ground-glass opacity.
Get Radiology Tree app to read full this article<
Get Radiology Tree app to read full this article<
Get Radiology Tree app to read full this article<
Get Radiology Tree app to read full this article<
Get Radiology Tree app to read full this article<
Image Quality for Normal Findings on Standard- and Reduced-dose CT images
Get Radiology Tree app to read full this article<
Table 2
The Statistical Results of Image Quality for Normal Findings on Standard- and Reduced-dose CT Images
Normal Findings Score value Standard-dose (400 mA) Overall Bronchi Central V Bronchiole Peripheral V Visual Noise Degree of ASIR (%) Mean ± SD (a) ASIR (20%) 4.07 ± 0.26 4.00 ± 0.00 4.00 ± 0.00 4.09 ± 0.30 4.09 ± 0.30 4.18 ± 0.40 (b) ASIR (60%) 4.85 ± 0.95 4.54 ± 0.52 4.63 ± 0.50 5.63 ± 0.67 3.73 ± 0.78 5.73 ± 0.46 (c) ASIR (100%) 5.33 ± 1.73 5.55 ± 0.68 5.45 ± 0.82 6.45 ± 0.82 2.36 ± 0.80 6.82 ± 0.40 Differences between two groups † P value (c) and (b) .006 ∗ .015 ∗ .049 .016 ∗ .009 ∗ .014 ∗ (c) and (a) <.001 ∗ .009 ∗ .012 ∗ .006 ∗ .008 ∗ .006 ∗ (b) and (a) <.001 ∗ .142 .091 .009 ∗ .207 .007 ∗ Reduced-dose (10 mA) Overall Bronchi Central V Bronchiole Peripheral V Visual Noise Degree of ASIR (%) Mean ± SD (a) ASIR (20%) 4.00 ± 0.00 4.00 ± 0.00 4.00 ± 0.00 4.00 ± 0.00 4.00 ± 0.00 4.00 ± 0.00 (b) ASIR (60%) 4.84 ± 0.73 4.55 ± 0.52 4.45 ± 0.52 5.00 ± 0.77 4.63 ± 0.80 5.55 ± 0.52 (c) ASIR (100%) 5.07 ± 1.21 4.73 ± 0.78 4.64 ± 0.67 5.09 ± 0.94 4.18 ± 1.25 6.73 ± 0.46 Differences between two groups † P value (c) and (b) .158 .463 .361 .753 .262 .016 ∗ (c) and (a) <.001 ∗ .093 .115 .014 ∗ .610 .005 ∗ (b) and (a) <.001 ∗ .142 .224 .012 ∗ .049 .007 ∗
ASIR, adaptive statistical iterative reconstruction; central V, central vessels; peripheral V, peripheral vessels.
Get Radiology Tree app to read full this article<
Get Radiology Tree app to read full this article<
Get Radiology Tree app to read full this article<
Get Radiology Tree app to read full this article<
Quantitative Noise Measurements
Get Radiology Tree app to read full this article<
Get Radiology Tree app to read full this article<
Discussion
Get Radiology Tree app to read full this article<
Get Radiology Tree app to read full this article<
Get Radiology Tree app to read full this article<
Get Radiology Tree app to read full this article<
Get Radiology Tree app to read full this article<
Get Radiology Tree app to read full this article<
Get Radiology Tree app to read full this article<
References
1. Fischbach F., Knollmann F., Griesshaber V., et. al.: Detection of pulmonary nodules by multislice computed tomography: improved detection rate with reduced slice thickness. Eur Radiol 2003; 13: pp. 2378-2383.
2. Brillet P.Y., Fetita C.I., Saragaglia A., et. al.: Investigation of airways using MDCT for visual and quantitative assessment in COPD patients. Int J Chron Obstruct Pulmon Dis 2008; 3: pp. 97-107.
3. Rydberg J., Buckwalter K.A., Caldemeyer K.S., et. al.: Multisection CT: scanning techniques and clinical applications. Radiographics 2000; 20: pp. 1787-1806.
4. Hu H.: Multi-slice helical CT: scan and reconstruction. Med Phys 1999; 26: pp. 5-18.
5. Yanagawa M., Tomiyama N., Osamu H., et. al.: Multidetector CT of the lung: image quality with garnet-based detectors. Radiology 2010; 255: pp. 944-954.
6. Pretorius P.H., King M.A., Pan T.S., et. al.: Reducing the influence of the partial volume effect on SPECT activity quantitation with 3D modelling of spatial resolution in iterative reconstruction. Phys Med Biol 1998; 43: pp. 407-420.
7. Wells R.G., King M.A., Simkin P.H., et. al.: Comparing filtered backprojection and ordered-subsets expectation maximization for small-lesion detection and localization in 67Ga SPECT. J Nucl Med 2000; 41: pp. 1391-1399.
8. Knesaurek K., Machac J., Vallabhajosula S., et. al.: A new iterative reconstruction technique for attenuation correction in high-resolution positron emission tomography. Eur J Nucl Med 1996; 23: pp. 656-661.
9. Riddell C., Carson R.E., Carrasquillo J.A., et. al.: Noise reduction in oncology FDG PET images by iterative reconstruction: a quantitative assessment. J Nucl Med 2001; 42: pp. 1316-1323.
10. Thibault J.B., Sauer K.D., Bouman C.A., et. al.: A three-dimensional statistical approach to improved image quality for multislice helical CT. Med Phys 2007; 34: pp. 4526-4544.
11. Zhang Y., Fessier J., Hsieh J.: Fast variance image predictions for quadratically regularized statistical image reconstruction in fan-beam tomography. IEEE Nuclear Science Symp Conf 2005; 4: pp. 4.
12. Marin D., Nelson R.C., Schindera S.T., et. al.: Low-tube-voltage, high-tube-current multidetector abdominal CT: improved image quality and decreased radiation dose with adaptive statistical iterative reconstruction algorithm—initial clinical experience. Radiology 2010; 254: pp. 145-153.
13. Markarian B., Dailey E.T.: Preparation of inflated lung specimens.Groskin S.A.Heitzman’s The lung: radiologic-pathologic correlations.1993.MosbySt Louis:pp. 4-12.
14. Austin J.H.M., Müller N.L., Friedman P.J., et. al.: Glossary of terms for CT of the lung: recommendations of the Nomenclature Committee of the Fleischner Society. Radiology 1996; 200: pp. 327-331.
15. Boehm T., Willmann J.K., Hilfiker P.R., et. al.: Thin-section CT of the lung: dose electrocardiographic triggering influence diagnosis?. Radiology 2003; 229: pp. 483-491.
16. Goldman L.W.: Principles of CT: radiation dose and image quality. J Nucl Med Technol 2007; 35: pp. 213-225.
17. Murata K., Khan A., Rojas K.A., et. al.: Optimization of computed tomography technique to demonstrate the fine structure of the lung. Invest Radiol 1988; 23: pp. 170-175.
18. Mayo J.R., Webb W.R., Gould R., et. al.: High-resolution CT of the lungs: an optimal approach. Radiology 1987; 163: pp. 507-510.
19. Zwirewich C.V., Terriff B., Müller N.L.: High-spatial-frequency (bone) algorithm improves quality of standard CT of the thorax. AJR Am J Roentgenol 1989; 153: pp. 1169-1173.
20. Haaga J.R., Miraldi F., MacIntyre W., et. al.: The effect of mAs variation upon computed tomography image quality as evaluated by in vivo and in vitro studies. Radiology 1981; 138: pp. 449-454.
21. Hara A.K., Paden R.G., Silva A.C., et. al.: Iterative reconstruction technique for reducing body radiation dose at CT: feasibility study. AJR Am J Roentgenol 2009; 193: pp. 764-771.
22. Yanagawa M., Tomiyama N., Sumikawa H., et. al.: Thin-section CT of lung without ECG gating: 64-detector row CT can markedly reduce cardiac motion artifact which can simulate lung lesions. Eur J Radiol 2009; 69: pp. 102-107.