
Rationale and Objectives
A new computed tomography (CT) detector with integrated electric components and shorter conducting pathways has recently been introduced to decrease system inherent electronic noise. The purpose of this study was to assess the potential benefit of such integrated circuit detector (ICD) in head CT by comparing objective and subjective image quality in low-dose examinations with a conventional detector design.
Materials and Methods
Using a conventional detector, reduced-dose noncontrast head CT (255 mAs; effective dose, 1.7 mSv) was performed in 25 consecutive patients. Following transition to ICD, 25 consecutive patients were scanned using identical imaging parameters. Images in both groups were reconstructed with iterative reconstruction (IR) and filtered back projection (FBP) and assessed in terms of quantitative and qualitative image quality.
Results
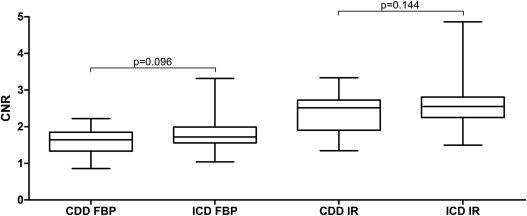
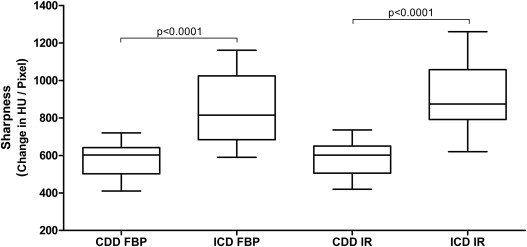
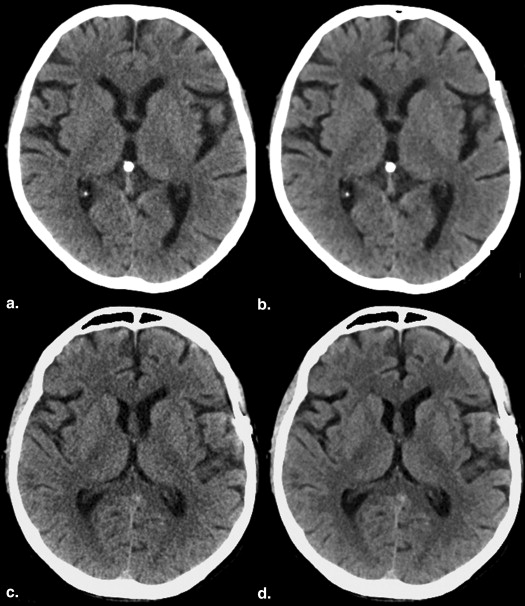
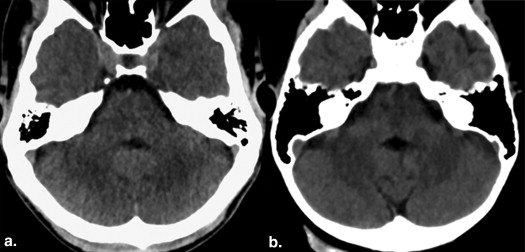
Acquisition of head CT using ICD increased signal-to-noise ratio of gray and white matter by 14% (10.0 ± 1.6 vs. 11.4 ± 2.5; P = .02) and 17% (8.2 ± 0.8 vs. 9.6 ± 1.5; P = .000). The associated improvement in contrast-to-noise ratio was 12% (2.0 ± 0.5 vs. 2.2 ± 0.6; P = .121). In addition, there was a 51% increase in objective image sharpness (582 ± 85 vs. 884.5 ± 191; change in HU/Pixel; P < .000). Compared to standard acquisitions, subjective grading of noise and overall image quality scores were significantly improved with ICD (2.1 ± 0.3 vs. 1.6 ± 0.3; P < .000; 2.0 ± 0.5 vs. 1.6 ± 0.3; P = .001). Moreover, streak artifacts in the posterior fossa were substantially reduced (2.3 ± 0.7 vs. 1.7 ± 0.5; P = .004).
Conclusions
At the same radiation level, acquisition of head CT with ICD achieves superior objective and subjective image quality and provides potential for significant dose reduction.
Although technical evolution of computed tomography (CT) has primarily been oriented by improvement of speed, volume coverage, and image quality, a continued rise in study numbers and heighted public awareness of radiation-associated cancer risks have eventually brought about a paradigm shift and initiated a recent quest for significant reduction of radiation dose .
Given the close correlation between signal-to-noise ratio (SNR) and dose, most attempts at dose reduction are essentially tradeoffs between image quality and patient exposure. Dose reduction with preserved image quality is a huge technical challenge and necessitates improvement of detector technology and reconstruction algorithms. In fact, more than a decade ago, transition from xenon gas to solid scintillator material detectors resulted in about 20% increase in dose efficiency . A more recent milestone in the realm of dose reduction is the reintroduction of alternative reconstruction algorithms, so-called iterative reconstruction (IR) variants. To a certain extent, the latter allow decoupling of spatial resolution and image noise and are currently challenging the old dose/image quality dogma in many clinical applications .
Get Radiology Tree app to read full this article<
Get Radiology Tree app to read full this article<
Material and methods
Patient Groups
Get Radiology Tree app to read full this article<
Get Radiology Tree app to read full this article<
CT Data Acquisition
Get Radiology Tree app to read full this article<
CT Data Reconstruction
Get Radiology Tree app to read full this article<
Get Radiology Tree app to read full this article<
Get Radiology Tree app to read full this article<
Quantitative Image Analysis
Get Radiology Tree app to read full this article<
SNR=mean HU of tissue in ROISD of HU in ROI SNR
=
mean HU of tissue in ROI
SD of HU in ROI
CNR=mean GM HU–mean WM HU[(SD GM HU)×2+(SD WM HU)×2]×12 CNR
=
mean GM HU
–
mean WM HU
[
(
SD GM HU
)
×
2
+
(
SD WM HU
)
×
2
]
×
1
2
Get Radiology Tree app to read full this article<
Get Radiology Tree app to read full this article<
Qualitative Image Analysis
Get Radiology Tree app to read full this article<
Get Radiology Tree app to read full this article<
Dose Measurements
Get Radiology Tree app to read full this article<
Statistical Analysis
Get Radiology Tree app to read full this article<
Get Radiology Tree app to read full this article<
Get Radiology Tree app to read full this article<
Get Radiology Tree app to read full this article<
Results
Get Radiology Tree app to read full this article<
Quantitative Analysis
Get Radiology Tree app to read full this article<
Table 1
Comparison of Tissue SNR Between CDD and ICD
CDD ICD FBP IR FBP IR WM 6.6 ± 0.5 9.8 ± 1.0 7.9 ± 1.3; P < .000 11.3 ± 1.9; P = .002 GM 8.0 ± 1.1 11.9 ± 2.2 9.3 ± 1.8; P = .009 13.5 ± 3.2; P = .053 CSF 1.0 ± 0.2 1.4 ± 0.3 1.1 ± 0.3; P = .044 1.6 ± 0.5; P = .417
CDD, conventional distributed detector; CSF, cerebrospinal fluid; FBP, filtered back projection; GM, gray matter; ICD, integrated circuit detector; IR, iterative reconstruction; SNR, signal-to-noise ratio; WM, white matter.
Mean and standard deviation of SNR in acquisitions with CDD and ICD. Data are shown for reconstructions using FBP or IR. P values refer to the difference between ICD and standard detector, while comparing identical reconstruction algorithms.
Get Radiology Tree app to read full this article<
Get Radiology Tree app to read full this article<
Get Radiology Tree app to read full this article<
Qualitative Analysis
Get Radiology Tree app to read full this article<
Table 2
Comparison of Subjective Image Quality Between CDD and ICD
CDD ICD FBP IR FBP IR Noise 2.7 (3) 1.4 (1) 2.2 (2); P = .000 1.1 (1); P = .025 GM/WM 2.4 (2.5) 1.3 (1) 2.1 (2); P = .035 1.1 (1); P = .044 SA 2.4 (2) 2.2 (2) 1.8 (2); P = .008 1.6 (2); P = .003 DA 2.6 (3) 1.5 (1) 2.2 (2); P = .015 1.1 (1); P = .022
CDD, conventional distributed detector; CSF, cerebrospinal fluid; FBP, filtered back projection; GM, gray matter; ICD, integrated circuit detector; IR, iterative reconstruction; SNR, signal-to-noise ratio; WM, white matter.
Mean and median (brackets) image quality scores in acquisitions with CDD and ICD. Data are shown for reconstructions using FBP or IR. Image quality grading is provided for noise, GM–WM differentiation, streak artifacts involving the posterior fossa (SA) and overall diagnostic acceptability (DA). P values refer to the difference between ICD and standard detector, while comparing identical reconstruction algorithms.
Get Radiology Tree app to read full this article<
Get Radiology Tree app to read full this article<
Discussion
Get Radiology Tree app to read full this article<
Get Radiology Tree app to read full this article<
Get Radiology Tree app to read full this article<
Get Radiology Tree app to read full this article<
Get Radiology Tree app to read full this article<
Get Radiology Tree app to read full this article<
Get Radiology Tree app to read full this article<
Get Radiology Tree app to read full this article<
References
1. Brenner D.J.: Slowing the increase in the population dose resulting from CT scans. Radiation Research 2010; 174: pp. 809-815.
2. Brenner D.J., Hall E.J.: Computed tomography—an increasing source of radiation exposure. The New England Journal of Medicine 2007; 357: pp. 2277-2284.
3. Fuchs T., Kachelriess M., Kalender W.A.: Direct comparison of a xenon and a solid-state CT detector system: measurements under working conditions. IEEE Transactions on Medical Imaging 2000; 19: pp. 941-948.
4. Baumueller S., Winklehner A., Karlo C., et. al.: Low-dose CT of the lung: potential value of iterative reconstructions. European Radiology 2012; 22: pp. 2597-2606.
5. Gosling O., Loader R., Venables P., et. al.: A comparison of radiation doses between state-of-the-art multislice CT coronary angiography with iterative reconstruction, multislice CT coronary angiography with standard filtered back-projection and invasive diagnostic coronary angiography. Heart 2010; 96: pp. 922-926.
6. Kilic K., Erbas G., Guryildirim M., et. al.: Lowering the dose in head CT using adaptive statistical iterative reconstruction. AJNR American Journal of Neuroradiology 2011; 32: pp. 1578-1582.
7. Korn A., Fenchel M., Bender B., et. al.: Iterative reconstruction in head CT: image quality of routine and low-dose protocols in comparison with standard filtered back-projection. AJNR American Journal of Neuroradiology 2012; 33: pp. 218-224.
8. Rapalino O., Kamalian S., Kamalian S., et. al.: Cranial CT with adaptive statistical iterative reconstruction: improved image quality with concomitant radiation dose reduction. AJNR American Journal of Neuroradiology 2012; 33: pp. 609-615.
9. Sagara Y., Hara A.K., Pavlicek W., et. al.: Comparison of low-dose CT with adaptive statistical iterative reconstruction and routine-dose CT with filtered back projection in 53 patients. AJR American Journal of Roentgenology 2010; 195: pp. 713-719.
10. Vorona G.A., Zuccoli G., Sutcavage T., et. al.: The use of adaptive statistical iterative reconstruction in pediatric head CT: a feasibility study. AJNR American Journal of Neuroradiology 2013; 34: pp. 205-211.
11. Shrimpton P.C., Hillier M.C., Lewis M.A., et. al.: National survey of doses from CT in the UK: 2003. The British Journal of Radiology 2006; 79: pp. 968-980.
12. Massoumzadeh P., Don S., Hildebolt C.F., et. al.: Validation of CT dose-reduction simulation. Medical Physics 2009; 36: pp. 174-189.
13. Hsieh J., Gurmen O.E., King K.F.: Investigation of a solid-state detector for advanced computed tomography. IEEE Transactions on Medical Imaging 2000; 19: pp. 930-940.
14. Liu Y., Leng S., Michalak G.J., et. al.: Reducing image noise in computed tomography (CT) colonography: effect of an integrated circuit CT detector. Journal of Computer Assisted Tomography 2014;
15. Morsbach F., Bickelhaupt S., Ratzer S., et. al.: Integrated circuit detector technology in abdominal CT: added value in obese patients. AJR American Journal of Roentgenology 2014; 202: pp. 368-374.
16. Duan X., Wang J., Leng S., et. al.: Electronic noise in CT detectors: impact on image noise and artifacts. AJR American Journal of Roentgenology 2013; 201: pp. W626-W632.
17. Morsbach F., Desbiolles L., Plass A., et. al.: Stenosis quantification in coronary CT angiography: impact of an integrated circuit detector with iterative reconstruction. Investigative Radiology 2013; 48: pp. 32-40.
18. Ulzheimer S.F.J.: The Stellar Detector.2013.White Paper Siemens Healthcare
19. Korn A., Bender B., Fenchel M., et. al.: Sinogram affirmed iterative reconstruction in head CT: improvement of objective and subjective image quality with concomitant radiation dose reduction. European Journal of Radiology 2013; 82: pp. 1431-1435.
20. Ozdoba C., Slotboom J., Schroth G., et. al.: Dose reduction in standard head CT: first results from a new scanner using iterative reconstruction and a new detector type in comparison with two previous generations of multi-slice CT. Clinical Neuroradiology 2014; 24: pp. 23-28.