
Rationale and Objectives
This study aimed to determine the potential degree of radiation dose reduction achievable using Advanced Modeled Iterative Reconstruction (ADMIRE) in abdominal computed tomography (CT) while maintaining image quality. Moreover, this study compared differences in image noise reduction of this iterative algorithm with radiation dose reduction.
Methods
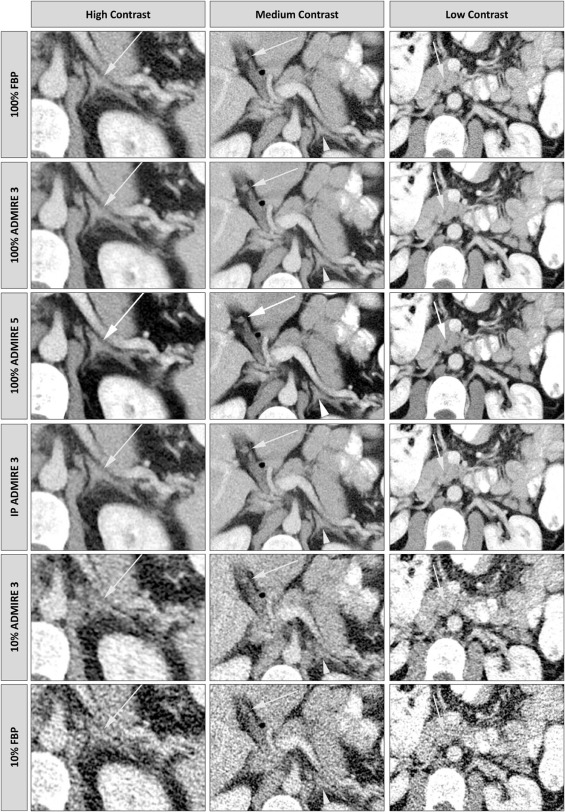
Eleven consecutive patients scheduled for abdominal CT were scanned according to our institute’s standard protocol (100 kV, 289 reference mAs). Using a proprietary reconstruction software, CT images of these patients were reconstructed as either full-dose weighted filtered back projections or with simulated radiation dose reductions down to 10% of the full-dose level and ADMIRE at either strength 3 or strength 5. Images were marked with arrows pointing on anatomic structures of the abdomen, differing in their contrast to the surrounding tissue. Structures were grouped into high-, medium-, and low-contrast subgroups. In addition, the intrinsic noise of these structures was measured. That followed, image pairs were presented to observers, with five readers assessing image quality using two-alternative-forced-choice comparisons. In total, 3000 comparisons were performed that way.
Results
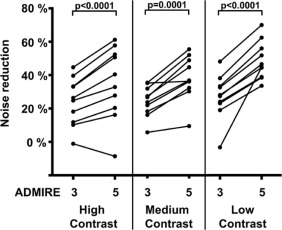
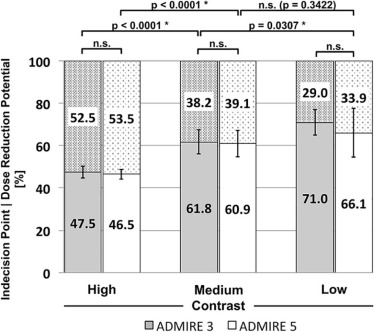
Both ADMIRE 3 and 5 decreased noise of the anatomic structures significantly compared to the filtered back projection, with an additional significant difference between ADMIRE 3 and 5. Radiation dose reduction potential for ADMIRE ranged from 29.0% to 53.5%, with no significant differences between ADMIRE 3 and 5 within the contrast subgroups.The potential levels of radiation dose reduction for ADMIRE 3 differed significantly between high-, medium-, and low-contrast structures, whereas for ADMIRE 5, there was only a significant difference between the high- and the medium-contrast subgroups.
Conclusion
Although ADMIRE 5 permits significantly higher noise reduction potential than ADMIRE 3, it does not facilitate higher levels of radiation dose reduction. ADMIRE nonetheless holds remarkable potential for radiation dose reduction, which features a certain dependency on the contrast of the structure of interest. Applying ADMIRE with a strength of 3 in abdominal CT may permit radiation dose reduction of about 30%.
Background
Computed tomography (CT) of the abdomen is an indispensable tool for clinical diagnosis.Nonetheless, radiation dose exposure raises several widely known concerns. Hence, according to the as-low-as-reasonably-achievable principle, radiation dose should be reduced while preserving diagnostic image quality.
As radiation dose reduction in CT examinations leads to increased image noise (given all other parameters constant) and thus impaired diagnostic image quality, one very promising technique for radiation dose reduction is the implementation of iterative reconstruction (IR) algorithms for noise reduction. In contrast to traditional weighted filtered back projection (FBP), IR algorithms can be considered as feedback mechanisms, with a simulator of the CT physics in the feedback loop. The feed forward loop updates the reconstruction image, based on deviations between the measured and the simulated scans . One of the most recent commercially available IR algorithms is the Advanced Modeled Iterative Reconstruction (ADMIRE; Siemens Healthineers, Forchheim, Germany), which uses IR from the raw data domain in combination with noise reduction in the image space in a hybrid manner. It applies statistical modeling in the raw data domain, followed by back projection, application of statistical model in the image domain (regularization), and forward projection. The resulting pseudo raw data are compared to the measured data and iteratively reinserted into the loop afterward . Compared to its predecessor SAFIRE (Sinogram-affirmed Iterative Reconstruction), the analysis incorporates not only nearest neighbor data but also a larger neighborhood at an anatomically reasonable length scale with respect to clinical applications . The ADMIRE strength setting primarily controls the level of noise reduction the algorithm aims at and therefore an increase in ADMIRE strength should allow higher radiation dose reduction potential.
Get Radiology Tree app to read full this article<
Methods
Patient Examination
Get Radiology Tree app to read full this article<
Get Radiology Tree app to read full this article<
Image Reconstruction
Get Radiology Tree app to read full this article<
Get Radiology Tree app to read full this article<
Get Radiology Tree app to read full this article<
Get Radiology Tree app to read full this article<
Statistical Analysis
Get Radiology Tree app to read full this article<
Get Radiology Tree app to read full this article<
Get Radiology Tree app to read full this article<
Get Radiology Tree app to read full this article<
Get Radiology Tree app to read full this article<
Results
Scan Parameters
Get Radiology Tree app to read full this article<
Inter- and Intraobserver Agreement
Get Radiology Tree app to read full this article<
Classification of the Anatomic Structures
Get Radiology Tree app to read full this article<
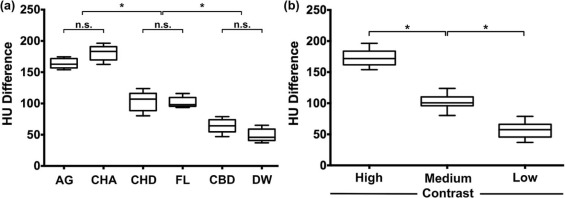
TABLE 1
HU Comparison of Different Anatomic Structures—Statistical Analysis
P Values AG CHA CHD LF CBD DW AG 0.2329 <.0001 <.0001 <.0001 <.0001 CHA <.0001 <.0001 <.0001 <.0001 CHD >.9999 .0002 <.0001 LF .0004 <.0001 CBD .3301
AG, adrenal gland; CBD, common bile duct; CHA, common hepatic artery; CHD, common hepatic duct; DW, duodenal wall; HU, Hounsfield unit; LF, falciform ligament.
P values derived from a Tukey’s multiple comparison test in conjunction with an analysis of variance for the contrast of different anatomic structures. Also see Figure 1a . An additional comparison between grouped high-, medium-, and low-contrast structures revealed only significant differences (all P values < .0001; see Fig 1b ).
Get Radiology Tree app to read full this article<
Noise Analysis
Get Radiology Tree app to read full this article<
Get Radiology Tree app to read full this article<
Calculation and Comparison of the Indecision Points
Get Radiology Tree app to read full this article<

TABLE 2
Indecision Points of ADMIRE 3 and 5 for High-, Medium- and Low-contrast Structures
ADMIRE 3 ADMIRE 5 IP 95% CI_R_ 2 IP 95% CI_R_ 2 High contrast 47.5 44.6–50.3 0.987 46.5 44.2–48.9 0.992 Medium contrast 61.8 56.1–67.6 0.954 60.9 54.7–67.0 0.950 Low contrast 71.0 64.9–77.2 0.961 66.1 54.6–77.7 0.885
CI, confidence interval.
A numerical presentation of Figure 4 , depicting indecision points (IPs) of ADMIRE 3 and ADMIRE 5 reconstructions for high-, medium-, and low-contrast structures along with their 95% confidence intervals. R 2 values are given in addition to goodness-of-fit quantification.
Get Radiology Tree app to read full this article<
Get Radiology Tree app to read full this article<
Get Radiology Tree app to read full this article<
Get Radiology Tree app to read full this article<
Discussion
Get Radiology Tree app to read full this article<
Get Radiology Tree app to read full this article<
Get Radiology Tree app to read full this article<
Get Radiology Tree app to read full this article<
Get Radiology Tree app to read full this article<
Get Radiology Tree app to read full this article<
Get Radiology Tree app to read full this article<
Get Radiology Tree app to read full this article<
Get Radiology Tree app to read full this article<
Get Radiology Tree app to read full this article<
Get Radiology Tree app to read full this article<
Get Radiology Tree app to read full this article<
Get Radiology Tree app to read full this article<
Conclusion
Get Radiology Tree app to read full this article<
References
1. Nuyts J., De Man B., Fessler J.A., et. al.: Modelling the physics in the iterative reconstruction for transmission computed tomography. Phys Med Biol 2013; 58: pp. R63-R96.
2. Schaller F., Sedlmair M., Raupach R., et. al.: Noise reduction in abdominal computed tomography applying iterative reconstruction (ADMIRE). Acad Radiol 2016; 23: pp. 1230-1238.
3. Kramer M., Ellmann S., Allmendinger T., et. al.: Computed tomography angiography of carotid arteries and vertebrobasilar system: a simulation study for radiation dose reduction. Medicine (Baltimore) 2015; 94: pp. e1058.
4. Landis J.R., Koch G.G.: The measurement of observer agreement for categorical data. Biometrics 1977; 33: pp. 159-174.
5. Scholtz J.-E., Wichmann J.L., Hüsers K., et. al.: Automated tube voltage adaptation in combination with advanced modeled iterative reconstruction in thoracoabdominal third-generation 192-slice dual-source computed tomography: effects on image quality and radiation dose. Acad Radiol 2015; 22: pp. 1081-1087.
6. Ramirez-Giraldo J.C., Primak A.N., Grant K., et. al.: Innovations radiation dose optimization technologies in multidetector computed tomography: a review. Med Phys Int J 2014; 2: pp. 420-430.
7. Ghetti C., Palleri F., Serreli G., et. al.: Physical characterization of a new CT iterative reconstruction method operating in sinogram space. J Appl Clin Med Phys 2013; 14: pp. 4347.
8. Ellmann S., Kammerer F., Brand M., et. al.: A novel pairwise comparison-based method to determine radiation dose reduction potentials of iterative reconstruction algorithms, exemplified through circle of Willis computed tomography angiography. Invest Radiol 2016; 51: pp. 331-339.
9. Ehman E.C., Yu L., Manduca A., et. al.: Methods for clinical evaluation of noise reduction techniques in abdominopelvic CT. Radiographics 2014; 34: pp. 849-862.
10. Nakamoto A., Kim T., Hori M., et. al.: Clinical evaluation of image quality and radiation dose reduction in upper abdominal computed tomography using model-based iterative reconstruction; comparison with filtered back projection and adaptive statistical iterative reconstruction. Eur J Radiol 2015; 84: pp. 1715-1723.
11. Kim S.H., Yoon J.-H., Lee J.H., et. al.: Low-dose CT for patients with clinically suspected acute appendicitis: optimal strength of sinogram affirmed iterative reconstruction for image quality and diagnostic performance. Acta Radiol 2015; 56: pp. 899-907.
12. Kalra M.K., Woisetschläger M., Dahlström N., et. al.: Radiation dose reduction with sinogram affirmed iterative reconstruction technique for abdominal computed tomography. J Comput Assist Tomogr 2012; 36: pp. 339-346.
13. Primak A.N., McCollough C.H., Bruesewitz M.R., et. al.: Relationship between noise, dose, and pitch in cardiac multi-detector row CT. Radiographics 2006; 26: pp. 1785-1794.
14. Goldman L.W.: Principles of CT: radiation dose and image quality. J Nucl Med Technol 2007; 35: pp. 213-225.
15. Lubner M.G., Pickhardt P.J., Tang J., et. al.: Reduced image noise at low-dose multidetector CT of the abdomen with prior image constrained compressed sensing algorithm. Radiology 2011; 260: pp. 248-256.
16. Zarb F., Rainford L., McEntee M.F.: Developing optimized CT scan protocols: phantom measurements of image quality. Radiography 2011; 17: pp. 109-114.
17. Kramer M., Ellmann S., Allmendinger T., et. al.: Computed tomography angiography of carotid arteries and vertebrobasilar system: a simulation study for radiation dose reduction. Medicine (Baltimore) 2015; 94: pp. e1058.
18. Solomon J., Mileto A., Ramirez Giraldo J.C., et. al.: Diagnostic performance of an advanced modeled iterative reconstruction algorithm for multidetector CT scanner: potential for radiation dose reduction in a multireader study 1. Radiology 2015; 275: pp. 735-745.
19. Friedman S.N., Fung G.S.K., Siewerdsen J.H., et. al.: A simple approach to measure computed tomography (CT) modulation transfer function (MTF) and noise-power spectrum (NPS) using the American College of Radiology (ACR) accreditation phantom. Med Phys 2013; 40: pp. 51907.
20. Kanal K.M., Butler P.F., Sengupta D., et. al.: U.S. diagnostic reference levels and achievable doses for 10 adult CT examinations. Radiology 2017; 284: pp. 120-133.
21. Massoumzadeh P., Don S., Hildebolt C.F., et. al.: Validation of CT dose-reduction simulation. Med Phys 2008; 36: pp. 174-189.