
Rationale and objectives
The purpose of this study was to demonstrate the use of a phantom to standardize low-dose chest computed tomographic (CT) protocols in children with cystic fibrosis.
Materials and Methods
Spiral chest CT scans of a Plexiglas phantom simulating airway sizes (internal diameter, 1.1–16.4 mm; wall thickness, 0.4–4.6 mm) in children with cystic fibrosis were obtained using two multidetector CT (MDCT) scanners (GE VCT and Siemens Sensation 64). Quantitative airway measurements from both scanners were compared with micro-CT airway measurements over a range of doses (0.2–1.8 mSv) to evaluate bias and variance of measurements. The effective doses for CT protocols were estimated using the ImPACT CT Patient Dosimetry Calculator.
Results
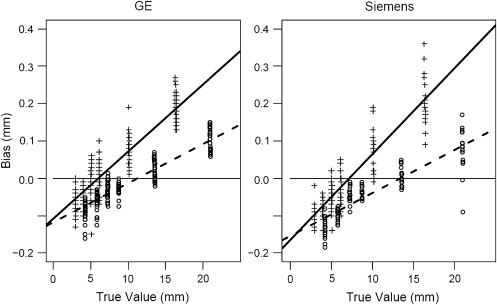
Both MDCT scanners were able to accurately measure airway sizes down to 3 mm internal diameter and 1.3 mm airway wall thickness, with errors of <3.5%. ImPACT estimates of effective dose were different for the MDCT scanners for a given peak tube voltage and product of tube current and exposure time. Accuracy and precision were not found to be associated with dose parameters for either machine. Bias in all measurements was strongly associated with airway diameter ( P values < .00001), but the magnitude of bias was small (mean, 0.07 mm; maximum, 0.21 mm). Differences between machines in error components were on the order of a few micrometers.
Conclusions
The use of a standard airway phantom confirms that different MDCT scanners have similar results within dose ranges planned for potential future clinical trials. Standardized protocols can be developed that adjust for differences in radiation exposure for different MDCT scanners.
To limit the risks of radiation exposure during chest computed tomographic (CT) imaging in children with cystic fibrosis (CF), low-dose spiral and high-resolution chest CT protocols have been developed for both expert reader scoring and quantitative CT measurements, including regional air trapping and airway measurements . These protocols provide comprehensive assessment of lung disease at substantially lower effective doses . Both the radiation exposure and image quality of different CT scanners may be different, even when parameters such as peak tube voltage (kVp), the product of tube current (mA) and exposure time (sec[s]), collimation, and pitch are held constant. Hence, a single protocol may not be appropriate for sites using different CT scanners during multicenter trials. Effective dose estimates for different CT scanners are available or can be measured at each site. These estimates or measurements can be used to establish protocols that provide similar radiation exposure for subjects studied using different CT scanners. To evaluate the quantitative measurements produced by such protocols, a standardized airway phantom was developed that could be tested at different sites. This phantom can be used to compare simulated airway measurements over a range of tube voltage, current-time product, collimation, and pitch settings obtained using low-dose protocol settings for each CT scanner and can also be used to correct for the measurement bias for each of these scanners. The purpose of this study was to demonstrate the use of a phantom to standardize low-dose chest CT protocols in children with CF using different multidetector CT (MDCT) scanners and different CT dose parameters.
Materials and methods
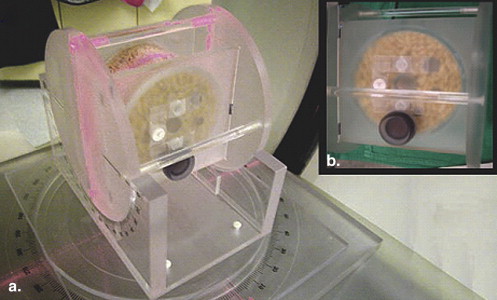
A Plexiglas airway phantom was manufactured by Phantom Laboratory, Inc (Salem, NY), modeled after the Plexiglas phantom developed by Reinhardt et al ( Fig 1 ). The phantom models tracheobronchial airway sizes in children and adolescents with CF that are seen with inspiratory chest CT imaging. The airway phantom consists of eight Plexiglas tubes that are encased in a larger Plexiglas cylinder ( Fig 1 ). The sizes of the tubes simulate tracheal, bronchial, and bronchiolar airway sizes encountered in children and adolescents with CF during full-inflation chest CT scans. These airway sizes were developed from our quantitative CT airway measurements evaluating tracheal and first-generation to fifth-generation bronchial and bronchiolar airways obtained in children with CF ages 6 to 18 years (unpublished data) using quantitative CT airway analysis software . The airway sizes specified for the manufacturer were 16, 10, 6, 5, 4, 3, 2, and 1 mm internal (luminal) diameters, and the specified wall thicknesses (WTs) were 4.5, 3.5, 2.7, 2.3, 1.8, 1.3, 0.8, and 0.4 mm, simulating quantitative airway measurements from previously encountered airways in CF children ( Supplement Table 1 ). The airspace surrounding the tubes within the larger Plexiglas cylinder was filled with dry puffed-rice cereal, simulating lung parenchyma on full-inflation inspiratory chest CT scans. This corresponded to a density of approximately −885 Hounsfield units (HU), similar to the lung density we have found in children with CF during full-inflation inspiratory CT scans (median density, −873 ± 20.3 HU).
Get Radiology Tree app to read full this article<
Get Radiology Tree app to read full this article<
Get Radiology Tree app to read full this article<
Get Radiology Tree app to read full this article<
Table 1
Comparison of CT Dosimetry (ImPACT CT Patient Dosimetry Calculator) by MDCT Scanner Manufacturer
TED/7.5 cm (mSv) Peak Tube Voltage (kVp) Tube Current (mA) Current-Time Product (mAs) ∗ GE † Siemens ‡ Ratio (GE/Siemens) 1 120 200 100 1.80 1.40 1.29 2 120 160 80 1.44 3 100 200 100 1.00 0.75 1.33 4 100 150 75 0.75 5 100 80 40 0.42 0.30 1.40 6 100 60 30 0.30 7 80 140 70 0.40 0.26 1.54 8 80 90 45 0.26 9 100 40 20 0.21 0.15 1.40 10 100 30 15 0.15
CT, computed tomographic; MDCT, multidetector computed tomographic; TED/7.5 cm, total effective dose for a phantom scan length of 7.5 cm.
Get Radiology Tree app to read full this article<
Get Radiology Tree app to read full this article<
Get Radiology Tree app to read full this article<
Get Radiology Tree app to read full this article<
Results
Get Radiology Tree app to read full this article<
Total Effective Dose
Get Radiology Tree app to read full this article<
Airway Measurement Accuracy
Get Radiology Tree app to read full this article<
Get Radiology Tree app to read full this article<
Get Radiology Tree app to read full this article<
Radiation dose had no effect on the bias or the SD of the measurement error for either MDCT scanner in unadjusted or adjusted analyses
Get Radiology Tree app to read full this article<
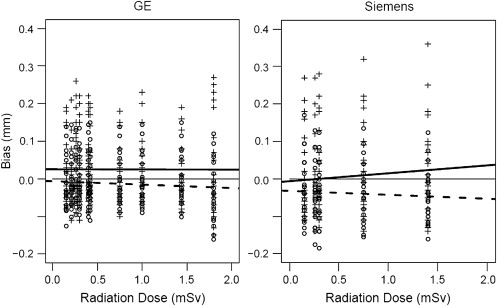
Table 2
Measurement Error Components by Scanner and Tube Size ∗
Siemens ‡ GE § Actual Lengths (Micro-CT † ) ID (mm) OD (mm) WT (mm) ID (mm) OD (mm) WT (mm) Tube ID (mm) OD (mm) WT (mm) Bias SD Bias SD Bias SD Bias SD Bias SD Bias SD 1 16.39 25.52 4.57 0.211 0.066 0.077 0.056 −0.067 0.021 0.168 0.117 0.082 0.118 −0.043 0.019 Difference 1.3% 0.3% −1.5% 1.0% 0.3% −0.9% 2 10.14 16.96 3.41 0.068 0.058 0.006 0.025 −0.031 0.020 0.070 0.034 0.023 0.027 −0.024 0.015 Difference 0.7% 0.0% −0.9% 0.7% 0.1% −0.7% 3 6.16 11.35 2.60 −0.018 0.049 −0.039 0.015 −0.011 0.023 0.010 0.041 −0.027 0.013 −0.018 0.017 Difference −0.3% −0.3% −0.4% 0.2% −0.2% −0.7% 4 5.04 9.51 2.24 −0.047 0.037 −0.045 0.020 0.001 0.017 −0.011 0.039 −0.031 0.022 −0.010 0.014 Difference −0.9% −0.5% 0.1% −0.2% −0.3% −0.4% 5 3.98 7.66 1.85 −0.082 0.028 −0.096 0.016 −0.007 0.018 −0.037 0.022 −0.054 0.023 −0.009 0.010 Difference −2.0% −1.3% −0.4% −0.9% −0.7% −0.5% 6 2.98 5.54 1.28 −0.099 0.028 −0.133 0.025 −0.017 0.007 −0.064 0.031 −0.084 0.023 −0.010 0.014 Difference −3.3% −2.4% −1.4% −2.1% −1.5% −0.8%
CT, computed tomography; ID, internal diameter; OD, outer diameter; SD, standard deviation; WT, wall thickness.
Get Radiology Tree app to read full this article<
Get Radiology Tree app to read full this article<
Get Radiology Tree app to read full this article<
Get Radiology Tree app to read full this article<
Get Radiology Tree app to read full this article<
Get Radiology Tree app to read full this article<
Get Radiology Tree app to read full this article<
Discussion
Get Radiology Tree app to read full this article<
Get Radiology Tree app to read full this article<
Get Radiology Tree app to read full this article<
Get Radiology Tree app to read full this article<
Get Radiology Tree app to read full this article<
Get Radiology Tree app to read full this article<
Limitations
Get Radiology Tree app to read full this article<
Get Radiology Tree app to read full this article<
Supplement Table 1
Get Radiology Tree app to read full this article<
Phantom Airway Sizes Comparable to Bronchial Airway Sizes Encountered in Children With Cystic Fibrosis Aged 7 to 18 Years
Tube ID (mm) Age Sex Type ID (mm) OD (mm) Age Sex Type OD (mm) WT (mm) Age Sex Type WT (mm) 1 16.39 18 M Distal trach ID 16.4 25.52 15 F Trach 25.5 4.57 18 M Mid trach 4.6 2 10.14 7 M Mid trach ID 10.1 16.96 7 M Mid trach 17.0 3.41 18 F RMS (G1) 3.4 3 6.16 15 F RULTO ID (G2) 6.2 11.35 7 M LMS (G1) 11.4 2.60 18 M LMS (G1) 2.6 4 5.04 18 F RUL seg ID (G3) 5.1 9.51 7 M RMS (G1) 9.5 2.25 18 F RULTO (G2) 2.2 5 3.98 15 F RUL seg ID (G3) 4.0 7.66 7 F RUL apic seg (G3) 7.7 1.85 12 F RUL apic subseg (G4) 1.9 6 2.98 18 M RUL subseg ID (G4) 3.0 5.54 7 M RULTO (G2) 5.5 1.28 7 F RUL apic subseg (G4) 1.3 7 2.06 7 F RUL apic subseg ID (G4) 2.1 3.62 7 M RUL apic subseg (G4) 3.6 0.78 7 F RUL post subseg (G4) 0.8 8 1.06 7 F RUL apic subsubseg ID (G5) 1.1 1.89 1.9 0.42
Apic, apical; F, female; ID, internal (luminal) diameter; LMS, left mainstem bronchus, M, male; Mid trach, middle trachea; OD, outer (total airway) diameter; RMS, right mainstem bronchus; RUL, right upper lobe, RULTO, right upper lobe take-off, Seg, segment; Subseg, subsegment, Subsubseg, sub-subsegment; Trach, trachea; WT, wall thickness.
Get Radiology Tree app to read full this article<
References
1. de Jong P.A., Mayo J.R., Golmohammadi K., et. al.: Estimation of cancer mortality associated with repetitive computed tomography scanning. Am J Respir Crit Care Med 2006; 173: pp. 199-203.
2. de Jong P.A., Tiddens H.A., Lequin M.H., et. al.: Estimation of the radiation dose from CT in cystic fibrosis. Chest 2008; 133: pp. 1289-1291.
3. Goris M.L., Zhu H.J., Blankenberg F., et. al.: An automated approach to quantitative air trapping measurements in mild cystic fibrosis. Chest 2003; 123: pp. 1655-1663.
4. Long F.R.: High-resolution computed tomography of the lung in children with cystic fibrosis: technical factors. Proc Am Thorac Soc 2007; 4: pp. 306-309.
5. Robinson T.E.: Computed tomography scanning techniques for the evaluation of cystic fibrosis lung disease. Proc Am Thorac Soc 2007; 4: pp. 310-315.
6. Huda W.: Radiation doses and risks in chest computed tomography examinations. Proc Am Thorac Soc 2007; 4: pp. 316-320.
7. Imaging Performance Assessment of CT Scanners Group. ImPACT CT Patient Dosimetry Calculator version 0.99x. Available at: http://www.impactscan.org . Accessed October 30, 2006.
8. Reinhardt J.M., D’Souza N.D., Hoffman E.A.: Accurate measurement of intrathoracic airways. IEEE Trans Med Imaging 1997; 16: pp. 820-827.
9. Venkatraman R., Raman R., Raman B., et. al.: Fully automated system for three-dimensional bronchial morphology analysis using volumetric multidetector computed tomography of the chest. J Digit Imaging 2006; 19: pp. 132-139.
10. Perisinakis K., Tzedakis A., Damilakis J.: On the use of Monte Carlo-derived dosimetric data in the estimation of patient dose from CT examinations. Med Phys 2008; 35: pp. 2018-2028.
11. Van der Molen A.J., Veldkamp W.J., Geleijns J.: 16-slice CT: achievable effective doses of common protocols in comparison with recent CT dose surveys. Br J Radiol 2007; 80: pp. 248-255.
12. Kim N., Seo J.B., Song K.S., et. al.: Semi-automatic measurement of the airway dimension by computed tomography using the full-width-half-maximum method: a study on the measurement accuracy according to the CT parameters and size of the airway. Korean J Radiol 2008; 9: pp. 226-235.
13. de Jong P.A., Long F.R., Nakano Y.: Computed tomography dose and variability of airway dimension measurements: how low can we go?. Pediatr Radiol 2006; 36: pp. 1043-1047.