
Rationale and Objectives
To analyze radiologist lung nodule segmentations in the Lung Imaging Database Consortium (LIDC) database and to apply statistical tools to generate estimates of ground truth. This investigation expands on earlier work by considering a larger number of cases from the LIDC database, and results were generated on a per-nodule basis, as opposed to a per-case basis as was done previously.
Materials and Methods
We analyzed nodule data drawn from the 41 most recent computed tomography exams released by the LIDC. We combined radiologist segmentations for a given nodule using different consensus schemes: union, intersection, and simultaneous truth and performance level estimation (STAPLE). We also generated three-dimensional models of the manual segmentations using discrete marching cubes to visualize features of the data.
Results
Using the union as the consensus scheme produced the greatest number of nodule-positive voxels while using the intersection produced the fewest. Considering only nodules for which all readers agreed on nodule presence, STAPLE computed sensitivity averages for readers one, two, three, and four were 0.91, 0.83, 0.90, and 0.77, respectively. Specificity averages were 0.97, 0.98, 0.97, and 0.97. Considering cases for which there was disagreement about nodule presence, sensitivity results become 0.67, 0.74, 0.60, and 0.37. Specificity results in this case are 0.95, 0.95, 0.95, and 0.98. STAPLE-generated pmaps exhibited probability values tightly grouped below the 0.25 and above the 0.75 probability levels. Three-dimensional models of manually segmented nodules revealed step-artefacts in the segmentation data.
Conclusions
Radiologists often disagree about nodule presence. Ideally, knowing each reader’s sensitivity and specificity a priori is preferred for optimal STAPLE results. Knowing these values and developing manual segmentation tools and imaging protocols that mitigate unwanted segmentation features (such as step artefacts) can result in more accurate estimates of ground truth. Furthermore, a computer-aided detection algorithm’s performance is a function of the ground truth estimate by which it is scored.
Despite warnings stretching back 40 years—the initial US Surgeon General’s Report on Smoking was issued in 1964 and warning labels have been required on cigarettes sold in the United States since 1969—lung cancer remains a serious health threat in the world with an estimated 1 million deaths in 2000 ( ). For the United States, lung cancer is the single largest fatal malignancy and is second only to heart disease in yearly fatalities; it makes up 32% of the cancer deaths among men and 25% of the cancer deaths among women. There are few effective treatments and 5-year mortality is approximately 14% ( ) because largely to advanced stage of the disease at diagnosis. Despite this, lung cancer screening is not recommended, even for at-risk populations, based largely on statistically powerful studies carried out in the 1970s that showed little benefit to lung cancer screening. However, imaging advances over recent years—most notably the advent of thin slice multidetector computed tomography (MDCT)—have prompted revisiting the notion of screening.
Recent studies of stage I cancers demonstrate that the diagnosis of lung cancer before metastases can give 5-year survival rates as high as 70% ( ) and other studies ( ) equate small, subtle cancers with early-stage disease. But before screening becomes widely accepted, issues involving overdiagnosis, radiation dose, and appropriate population selection must be addressed. However, a dose-limiting screening protocol that enables early nodule detection while limiting overdiagnosis appears within reach. One of the promising vehicles for early detection is the low-dose MDCT scan. MDCT has been shown to be an effective method for detecting small (<1 cm) nodules in the lungs that may be cancerous or precancerous lesions. However, the rigors of reading a large number of MDCT chest scans with upwards of 500 images per scan, combined with the subtlety of some of nodules of interest argue for computer-aided detection (CAD) as a necessity for a rational screening program.
Get Radiology Tree app to read full this article<
 Open full size image
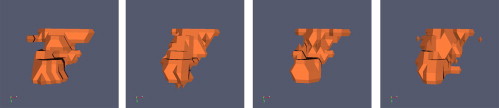
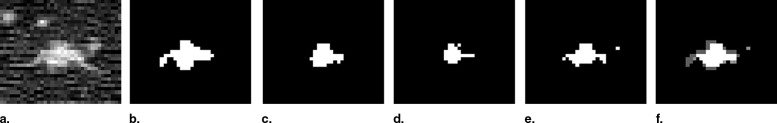
Figure 1
The variability of nodule ground truth based on radiologic consensus.
Get Radiology Tree app to read full this article<
Get Radiology Tree app to read full this article<
Get Radiology Tree app to read full this article<
Materials and methods
Get Radiology Tree app to read full this article<
Get Radiology Tree app to read full this article<
Get Radiology Tree app to read full this article<
Calculating GT
Get Radiology Tree app to read full this article<
Tmaxn=∪mSm,n T
m
a
x
n
=
∪
m
S
m
,
n
Get Radiology Tree app to read full this article<
Get Radiology Tree app to read full this article<
Get Radiology Tree app to read full this article<
Tminn=∩mSm,n T
m
i
n
n
=
∩
m
S
m
,
n
Get Radiology Tree app to read full this article<
Get Radiology Tree app to read full this article<
Get Radiology Tree app to read full this article<
Get Radiology Tree app to read full this article<
Get Radiology Tree app to read full this article<
Vn=1R∑Rm=1Im,n V
n
=
1
R
∑
m
=
1
R
I
m
,
n
where I m,n is reader m ’s label map for nodule n (either 1 or 0) and R is the number of radiologists who provided annotations.
Get Radiology Tree app to read full this article<
Get Radiology Tree app to read full this article<
Get Radiology Tree app to read full this article<
Sensitivity=TPTP+FN S
e
n
s
i
t
i
v
i
t
y
=
T
P
T
P
+
F
N
Specificity=TNFP+TN S
p
e
c
i
f
i
c
i
t
y
=
T
N
F
P
+
T
N
Get Radiology Tree app to read full this article<
Get Radiology Tree app to read full this article<
Results
Get Radiology Tree app to read full this article<
Table 1
Comparison of Ground Truth Approaches
Nodule_T__max__T__min__pmap 25_pmap 50__pmap 75 1 581 233 484 484 480 2 2,201 906 1,647 1,647 1,647 3 1,451 665 1,212 1,212 1,212 4 14,260 5,202 9,810 9,810 9,810 5 277 67 197 197 184 6 2,649 1,342 2,023 2,023 2,023 7 7,805 4,403 5,430 5,430 5,429 8 1,313 522 1,050 1,050 1,050 9 5,413 3,961 4,782 4,782 4,563 10 242 97 164 161 153 11 180 78 122 122 115 12 618 250 471 471 462 13 198 75 153 153 153 14 610 472 472 472 472 15 372 184 170 170 170 16 169 116 116 116 116 17 777 415 415 415 415 18 2,280 1,681 1,681 1,681 1,681 19 1,876 1,796 1,738 1,738 1,738 20 142 100 88 88 88 21 51,740 0 42,785 42,785 42,785 22 181 0 113 113 113 23 11 0 11 0 0 24 58 0 58 0 0 25 271 0 106 106 106 26 81 0 81 0 0 27 427 0 256 256 256 28 3,291 0 3,291 0 0 29 42 0 24 24 24 30 117 0 59 59 59 31 119 0 81 81 78 32 139 0 110 110 110 33 392 0 226 224 224 34 1,047 0 367 367 367 35 200 0 129 129 129 36 172 0 78 68 68 37 209 0 151 149 149 38 360 0 238 238 238 39 119 0 75 75 75 40 92 0 47 47 47 41 107 0 86 86 86 42 782 0 622 622 622 43 130 0 130 0 0 44 53 0 53 0 0 45 152 0 152 0 0 46 116 0 116 0 0 47 1,521 0 18 0 0 48 73 0 73 0 0 49 1,796 0 1,796 0 0 50 85 0 85 0 0 51 28 0 28 0 0 52 140 0 140 0 0 53 550 0 550 0 0
Get Radiology Tree app to read full this article<
Get Radiology Tree app to read full this article<
Table 2
Reader Sensitivity and Specificity Estimates
Nodule R1 Sensitivity R1 Specificity R2 Sensitivity R2 Specificity R3 Sensitivity R3 Specificity R4 Sensitivity R4 Specificity 1 0.94 0.95 0.49 0.99 0.84 0.98 0.99 0.98 2 0.79 0.99 0.61 0.99 0.98 0.97 0.95 0.96 3 0.97 0.94 0.97 0.98 0.90 0.98 0.57 0.99 4 0.87 0.98 0.98 0.92 0.77 0.99 0.64 0.99 5 0.95 0.89 0.94 0.98 0.86 0.96 0.36 1.0 6 0.68 0.99 0.99 0.99 0.87 0.99 1.0 0.84 7 0.99 0.99 0.81 0.99 0.91 0.94 0.99 1.0 8 0.95 0.98 0.57 1.0 0.80 0.99 1.0 0.91 9 0.94 0.96 0.92 0.99 0.97 0.95 0.94 0.99 10 0.75 0.95 0.87 0.98 0.95 0.91 0.87 0.98 11 0.87 0.92 0.92 0.99 1.0 0.95 0.72 1.0 12 0.78 0.98 0.98 0.97 0.98 0.93 0.55 1.0 13 0.69 0.99 0.97 0.97 0.89 0.94 0.58 0.99 14 1.0 1.0 0.98 0.94 0.88 0.99 0.97 0.99 15 1.0 1.0 0.7 0.97 1.0 1.0 0.95 0.75 16 1.0 0.90 1.0 0.96 0.47 1.0 0.29 1.0 17 0.97 0.90 0.61 0.99 0.94 0.99 0.44 0.99 18 0.95 0.93 0.78 1.0 0.91 0.96 0.78 1.0 19 1.0 1.0 0.78 0.95 1.0 1.0 0.80 0.97 20 1.0 1.0 0.57 0.96 0.96 0.82 1.0 1.0 21 0.0 1.0 1.0 0.95 1.0 0.96 0.0 1.0 22 0.0 1.0 1.0 0.93 1.0 0.97 0.0 1.0 23 0.0 1.0 1.0 0.74 0.0 1.0 0.0 1.0 24 0.0 1.0 0.0 1.0 1.0 0.59 0.0 1.0 25 0.0 1.0 1.0 0.96 0.0 1.0 1.0 0.88 26 1.0 0.76 0.0 1.0 0.0 1.0 0.0 1.0 27 1.0 0.98 0.29 1.0 1.0 0.90 0.0 1.0 28 0.0 1.0 0.0 1.0 1.0 0.66 0.0 1.0 29 1.0 1.0 1.0 0.83 0.0 1.0 0.0 1.0 30 1.0 0.77 1.0 0.95 0.0 1.0 0.0 1.0 31 0.99 0.83 0.53 0.98 0.97 1.0 0.0 1.0 32 1.0 1.0 0.66 0.94 0.0 1.0 1.0 1.0 33 0.95 0.95 0.80 1.0 0.91 0.96 0.0 1.0 34 0.99 0.97 1.0 0.82 0.0 1.0 0.0 1.0 35 0.94 0.98 0.57 1.0 1.0 0.89 0.0 1.0 36 0.93 0.78 0.95 1.0 1.0 0.89 0.0 1.0 37 0.87 0.93 0.91 1.0 0.93 0.94 0.0 1.0 38 1.0 0.90 1.0 0.95 0.0 1.0 0.0 1.0 39 0.81 0.96 0.89 1.0 0.99 0.86 0.0 1.0 40 0.88 0.93 0.68 1.0 0.0 1.0 0.97 0.92 41 1.0 1.0 0.59 0.90 0.0 1.0 1.0 1.0 42 0.95 0.94 0.94 0.98 0.92 0.98 0.0 1.0 43 1.0 0.68 0.0 1.0 0.0 1.0 0.0 1.0 44 0.0 1.0 1.0 0.80 0.0 1.0 0.0 1.0 45 0.0 1.0 1.0 0.77 0.0 1.0 0.0 1.0 46 0.0 1.0 0.0 1.0 1.0 0.88 0.0 1.0 47 0.0 1.0 1.0 1.0 0.0 1.0 0.0 1.0 48 0.0 1.0 1.0 0.66 0.0 1.0 0.0 1.0 49 0.0 1.0 1.0 0.88 0.0 1.0 0.0 1.0 50 0.0 1.0 1.0 0.67 0.0 1.0 0.0 1.0 51 0.0 1.0 0.0 1.0 1.0 0.73 0.0 1.0 52 1.0 0.49 0.0 1.0 0.0 1.0 0.0 1.0 53 0.0 1.0 1.0 0.83 0.0 1.0 0.0 1.0
Get Radiology Tree app to read full this article<
Get Radiology Tree app to read full this article<
Get Radiology Tree app to read full this article<
Get Radiology Tree app to read full this article<
Get Radiology Tree app to read full this article<
Get Radiology Tree app to read full this article<
Discussion
Get Radiology Tree app to read full this article<
Get Radiology Tree app to read full this article<
Get Radiology Tree app to read full this article<
Get Radiology Tree app to read full this article<
Get Radiology Tree app to read full this article<
References
1. Humphrey L., Teutsch S., Johnson M.: Lung cancer screening with sputum cytology examination, chest radiography, and computed tomography: an update for the U.S. preventive services task force. Ann Intern Med 2004; 140: pp. 740-753.
2. Fry W.A., Menck H.R., Winchester D.P.: The national database report on lung cancer. Cancer 1996; 77: pp. 1947-1955.
3. Dodd L., Wagner R., Armato S., et. al., The Lung Imaging Database Consortium Group: Assessment methodologies and statistical issues for computer-aided diagnosis of lung nodules in computed tomography: contemporary research topics relevant to the lung image database consortium. Acad Radiol 2004; 11: pp. 462-475.
4. Henschke C.I., Naidich D.P., Yankelevitz D.F., et. al.: Early lung cancer action project: Initial findings on repeat screenings. Cancer 2001; 92: pp. 153-159.
5. Suzuki K., Kusumoto M., Tsuchiya R., et. al.: Radiologic classification of small adenocarcinoma of the lung: radiologic-pathologic correlation and its prognostic impact. Ann Thorac Surg 2006; 86: pp. 413-420.
6. Armato S., McClennan G., McNitt-Gray M.F., et. al., Lung Image Database Consortium Research Group: Lung image database consortium: developing a resource for the medical imaging research community. Radiology 2004; pp. 739-748.
7. Warfield S.K., Zou K.H., Wells W.M.: Simultaneous truth and performance level estimation (staple): an algorithm for the validation of image segmentation. IEEE Trans Med Imaging 2004; 23: pp. 903-921.
8. Ibáñez L., Schroeder W., Ng L., et. al.: The Insight Software Consortium.ed 22005. Available online at http://www.itk.org
9. NCI/LIDC, https://imaging.nci.nih.gov/ncia/faces/baseDef.tiles
10. National Cancer Institute. National Cancer Imaging Archive. Available online at http://ncia.nci.nih.gov
11. National Cancer Institute. Cancer imaging program. Available online at http://imaging.cancer.gov/reportsandpublications/reportsandpresentations/firstdataset
12. Lorensen W., Miller J.V., Padfield D., et. al.: Creating models from segmented medical images.2005. Medicine Meets Virtual Reality, Long Beach, USA, Jun 26–29th.
13. Schroeder W., Martin K., Lorensen W.: The visualization toolkit.2004.Kitware IncClifton Park, NJ