
Rationale and Objectives
The purpose of this study was to present a new methodology to compare accuracies of two imaging fluid attenuated inversion recovery (FLAIR) magnetic resonance sequences in detection of multiple sclerosis (MS) lesions in the brain in the absence of ground truth, and to determine whether the two sequences, which differed only in echo time (TE), have the same accuracy.
Materials and Methods
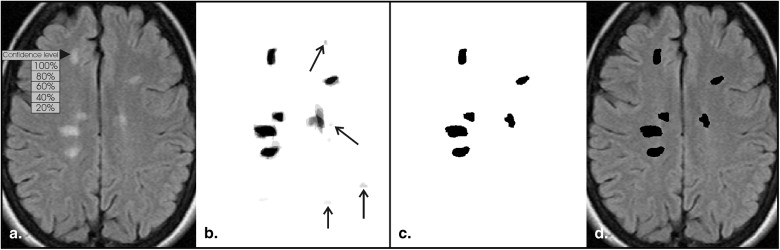
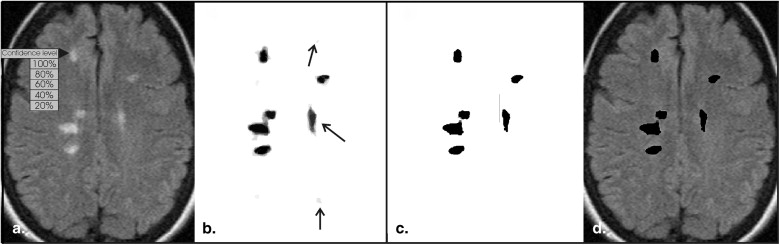
We acquired FLAIR images at TE 1 = 90 ms and TE 2 = 155 ms from 46 patients with MS (24–69 years old, mean 45.8, 15 males) and 11 healthy volunteers (23–54 years old, mean 37.1, 6 males). Seven experienced neuroradiologists segmented lesions manually on randomly presented corresponding TE 1 and TE 2 images. For every image pair, a “surrogate ground truth” for each TE was generated by applying probability thresholds, ranging from 0.3 to 0.5, to the weighted average of experts’ segmentations. Jackknife alternative free-response receiver operating characteristic analysis was used to compare experts’ performance on TE 1 and TE 2 images, using successively the TE 1 - and TE 2 -based ground truths.
Results
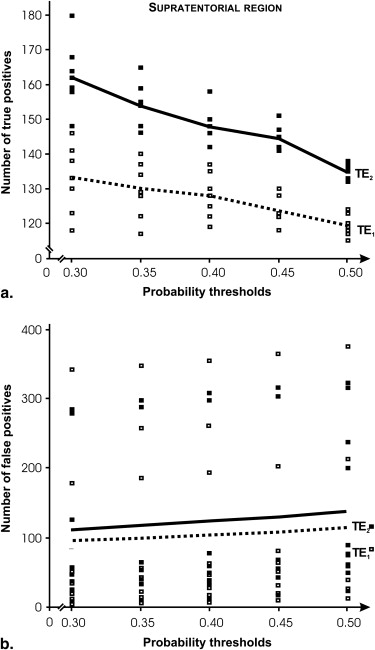
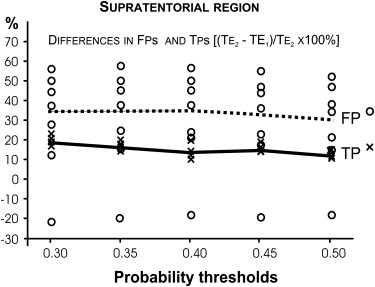
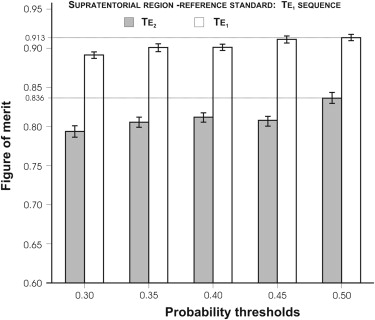
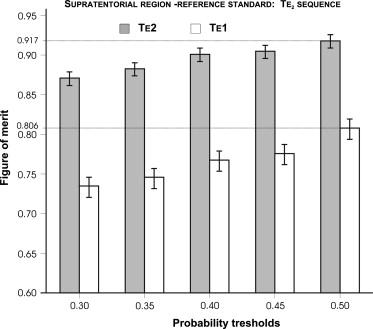
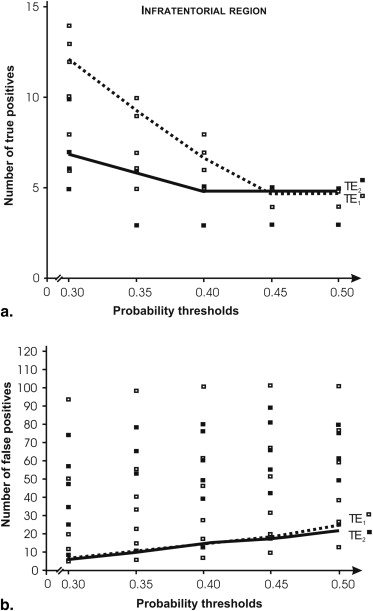
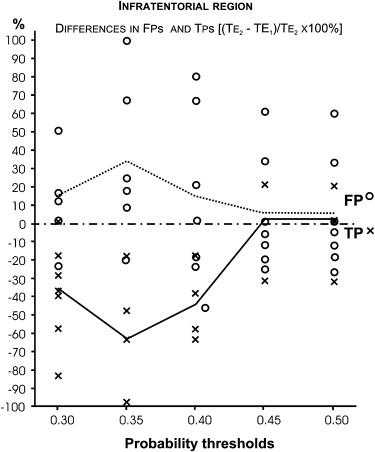
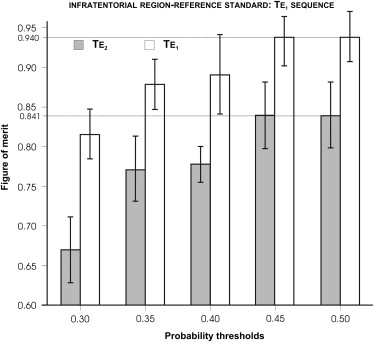
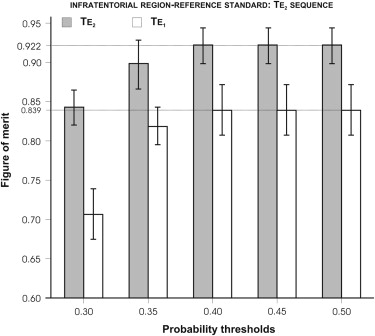
Supratentorially, there were significant differences in relative accuracy between the two sequences, ranging from 8.4% to 12.1%. In addition, we found a higher ratio of false positives to true positives for the TE 2 sequence using the TE 2 ground truth, compared to the TE 1 equivalent. Infratentorially, differences in the relative accuracy did not reach statistical significance.
Conclusion
The presented methodology may be useful in assessing the value of new clinical imaging protocols or techniques in the context of replacing existing ones, when the absolute ground truth is not available, and in determining changes in disease progression in follow-up studies. Our results suggest that the sequence with shorter TE should be preferred because it generates relatively fewer false positives. The finding is consistent with results of previous computer simulation studies.
Multiple sclerosis (MS) is a devastating neurological disease that is diagnosed primarily on the basis of a multiphasic pattern of clinical symptoms . Magnetic resonance imaging (MRI) is crucial in supporting the diagnosis, monitoring the dynamics of the disease, and evaluating responses to treatments . Considerable variability remains across institutions, however, in selecting an optimal MRI technique to detect MS lesions . Instead, many techniques are used concurrently and in various combinations, including intermediate-weighted imaging, T2-weighted imaging, fluid attenuated inversion recovery (FLAIR) imaging, diffusion-weighted imaging, and pre-and post-contrast T1-weighted imaging, among others . Further, because of rapid development of MRI technology and limited effort on methodology for selecting the best technique, no universal, rigorously optimized MRI protocol exists.
A fundamental problem complicating any research study evaluating and comparing imaging methods is the lack of “ground truth” information that is necessary to determine their accuracy (ie, questions as to whether there are any “true” lesions present and where they are located have no absolute answers). Many investigators either use a panel of experts to establish a surrogate ground truth based on all images, or directly compare images to determine which technique is better. These methods are fallible, however, as even experts vary in their interpretation of the images. Direct comparison studies have a known bias, because experts tend to prefer imaging methods that produce more false positives . To avoid this bias, images may be evaluated independently and in random order, but in the absence of “ground truth” data, such an approach may not be able to detect subtle differences in diagnostic accuracy.
Get Radiology Tree app to read full this article<
Get Radiology Tree app to read full this article<
Materials and methods
Get Radiology Tree app to read full this article<
Get Radiology Tree app to read full this article<
MRI Acquisition Parameters
Get Radiology Tree app to read full this article<
Testing Session Design
Get Radiology Tree app to read full this article<
Testing Software, Hardware, and Observers
Get Radiology Tree app to read full this article<
Get Radiology Tree app to read full this article<
Get Radiology Tree app to read full this article<
Processing and Formatting for Analysis
Get Radiology Tree app to read full this article<
Statistical Analysis
Get Radiology Tree app to read full this article<
Results
Supratentorial Region
Get Radiology Tree app to read full this article<
Get Radiology Tree app to read full this article<
Get Radiology Tree app to read full this article<
Table 1
Performance of Seven Neuroradiologists as Determined using JAFROC1 Figure of Merit (FOM) in Detection of Multiple Sclerosis Lesions in Supratentorial Compartment on FLAIR Images Obtained with Two Sequences Differing in Echo Time, 90 ms (TE 1 ) vs. 155 ms (TE 2 )
Reference TE 1 Reference TE 2 Threshold 0.5 FOM TE 1 FOM TE 2 FOM TE 1 FOM TE 2 Range (%) Reader 1 0.828 0.758 0.725 0.877 17.3 Reader 2 0.901 0.833 0.805 0.923 12.8 Reader 3 0.938 0.829 0.805 0.913 14.2 Reader 4 0.924 0.816 0.816 0.927 12.0 Reader 5 0.910 0.864 0.823 0.904 9.6 Reader 6 0.952 0.847 0.822 0.938 13.7 Reader 7 0.941 0.890 0.843 0.937 10.4 Range (%) 13.0 14.8 14.0 6.5
JAFROC, jackknife alternative free-response receiver operating characteristic; FLAIR, fluid-attenuated inversion recovery; FOM, figure of merit; TE, echo time.
Reference standards for each TE were generated using 50% detection probability threshold.
Table 2
Mean Performance of Seven Neuroradiologists as Measured with a Figure of Merit (FOM) and its 95% Confidence Interval (CI) in Brackets, in Detection of Multiple Sclerosis Brain Lesions on FLAIR Magnetic Resonance Images Obtained with Echo Time 90 ms (TE 1 ) and 155 ms (TE 2 )
Frame of Reference at 50% Probability Threshold Lesion
Location FOM
TE 1 FOM
TE 2 F_P_ Range (%) TE 1 “lesions” ST 0.913 (0.892–0.932) 0.834 (0.791–0.871) 15.4 <.001 8.7 IT 0.940 (0.868–0.977) 0.841 (0.659–0.944) 1.15 .285 10.5 TE 2 “lesions” ST 0.806 (0.761–0.845) 0.917 (0.896–0.935) 39.8 <.001 12.1 IT 0.839 (0.601–0.958) 0.922 (0.852–0.963) 0.52 .470 9.0
FOM, figure of merit; TE, echo time; ST, supratentorial; IT, infratentorial; CI, 95% confidence interval; F, F-statistic.
Get Radiology Tree app to read full this article<
Get Radiology Tree app to read full this article<
Table 3
Mean Performance of Seven Neuroradiologists as Measured with the Area under the ROC Curve (AUC) in the DBM-MRMC Method, and its 95% Confidence Interval (CI) in brackets, in Detection of Multiple Sclerosis Lesions in the Brain on FLAIR Magnetic Resonance Images Obtained with Echo Time 90 ms (TE 1 ) and 155 ms (TE 2 )
Frame of Reference at 50% Probability Threshold Lesion
Location AUC
TE 1 AUC
TE 2 F_P_ Range (%) TE 1 “lesions” ST 0.989 [0.979, 0.998] 0.964 [0.943, 0.985] 5.61 .0218 2.5 IT 0.958 [0.896,1.020] 0.893 [0.784, 1.003] 1.68 .229 6.8 TE 2 “lesions” ST 0.929 [0.884, 0.974] 0.981 [0.967, 0.995] 7.69 .007 5.3 IT 0.823 [0.570, 1.076] 0.938 [0.856, 1.019] 0.68 .411 12.3
ROC, receiver operating characteristic; ST, supratentorial; IT, infratentorial.
Get Radiology Tree app to read full this article<
Infratentorial Region
Get Radiology Tree app to read full this article<
Get Radiology Tree app to read full this article<
Get Radiology Tree app to read full this article<
Table 4
Performance of Seven Neuroradiologists as Determined using JAFROC1 Figure of Merit (FOM) in Detection of MS Lesions in Infratentorial Compartment on FLAIR Images Obtained with Two Sequences Differing in Echo Time, 90 ms (TE 1 ) vs. 155 ms (TE 2 )
Reference TE 1 Reference TE 1 Reference TE 2 Reference TE 2 Threshold 0.5 FOM TE 1 FOM TE 2 FOM TE 1 FOM TE 2 Range (%) Reader 1 0.967 0.759 0.873 0.825 21.5 Reader 2 0.927 0.941 0.800 0.965 17.1 Reader 3 0.961 0.861 0.851 0.980 13.2 Reader 4 0.994 0.859 0.875 0.961 13.6 Reader 5 0.953 0.910 0.904 0.937 5.1 Reader 6 0.884 0.675 0.780 0.784 23.6 Reader 7 0.896 0.882 0.788 1.000 21.2 Range (%) 11.1 28.3 13.7 21.6
JAFROC, jackknife alternative free-response receiver operating characteristic; FLAIR, fluid-attenuated inversion recovery; FOM, figure of merit; TE, echo time.
Reference standards for each TE were generated using 50% detection probability threshold.
Get Radiology Tree app to read full this article<
Get Radiology Tree app to read full this article<
Discussion
Get Radiology Tree app to read full this article<
Differences in Accuracy in the Supratentorial Region
Get Radiology Tree app to read full this article<
Get Radiology Tree app to read full this article<
Get Radiology Tree app to read full this article<
Get Radiology Tree app to read full this article<
Differences in Accuracy in the Infratentorial Region
Get Radiology Tree app to read full this article<
Get Radiology Tree app to read full this article<
Get Radiology Tree app to read full this article<
Clinical Implications
Get Radiology Tree app to read full this article<
Limitations
Get Radiology Tree app to read full this article<
Get Radiology Tree app to read full this article<
Get Radiology Tree app to read full this article<
Conclusions
Get Radiology Tree app to read full this article<
Acknowledgment
Get Radiology Tree app to read full this article<
Get Radiology Tree app to read full this article<
References
1. Comi G., Pulizzi A., Rovaris M., et. al.: Effect of laquinimod on MRI-monitored disease activity in patients with relapsing-remitting multiple sclerosis: a multicentre, randomised, double-blind, placebo-controlled phase IIb study. Lancet 2008; 371: pp. 2085-2092.
2. McDonald W.I., Compston A., Edan G., et. al.: Recommended diagnostic criteria for multiple sclerosis: guidelines from the International Panel on the diagnosis of multiple sclerosis. Ann Neurol 2001; 50: pp. 121-127.
3. Polman C.H., Reingold S.C., Edan G., et. al.: Diagnostic criteria for multiple sclerosis: 2005 revisions to the “McDonald Criteria”. Ann Neurol 2005; 58: pp. 840-846.
4. Kappos L., Gold R., Miller D.H., et. al.: Efficacy and safety of oral fumarate in patients with relapsing-remitting multiple sclerosis: a multicentre, randomised, double-blind, placebo-controlled phase IIb study. Lancet 2008; 372: pp. 1463-1472.
5. Brex P.A., Ciccarelli O., O’Riordan J.I., et. al.: A longitudinal study of abnormalities on MRI and disability from multiple sclerosis. N Engl J Med 2002; 346: pp. 158-164.
6. Yousry T.A., Filippi M., Becker C., et. al.: Comparison of MR pulse sequences in the detection of multiple sclerosis lesions. AJNR Am J Neuroradiol 1997; 18: pp. 959-963.
7. Bink A., Schmitt M., Gaa J., et. al.: Detection of lesions in multiple sclerosis by 2D FLAIR and single-slab 3D FLAIR sequences at 3.0 T: initial results. Eur Radiol 2006; 16: pp. 1104-1110.
8. Evans A.C., Frank J.A., Antel J., et. al.: The role of MRI in clinical trials of multiple sclerosis: comparison of image processing techniques. Ann Neurol 1997; 41: pp. 125-132.
9. Geurts J.J., Pouwels P.J., Uitdehaag B.M., et. al.: Intracortical lesions in multiple sclerosis: improved detection with 3D double inversion-recovery MR imaging. Radiology 2005; 236: pp. 254-260.
10. Moraal B., Meier D.S., Poppe P.A., et. al.: Subtraction MR images in a multiple sclerosis multicenter clinical trial setting. Radiology 2009; 250: pp. 506-514.
11. Bakshi R., Thompson A.J., Rocca M.A., et. al.: MRI in multiple sclerosis: current status and future prospects. Lancet Neurol 2008; 7: pp. 615-625.
12. Whiting P., Harbord R., Main C., et. al.: Accuracy of magnetic resonance imaging for the diagnosis of multiple sclerosis: systematic review. BMJ 2006; 332: pp. 875-884.
13. Begg C.B., McNeil B.J.: Assessment of radiologic tests: control of bias and other design considerations. Radiology 1988; 167: pp. 565-569.
14. Woo J.H., Henry L.P., Krejza J., et. al.: Detection of simulated multiple sclerosis lesions on T2-weighted and FLAIR images of the brain: observer performance. Radiology 2006; 241: pp. 206-212.
15. Herskovits E.H., Itoh R., Melhem E.R.: Accuracy for detection of simulated lesions: comparison of fluid-attenuated inversion-recovery, proton density—weighted, and T2-weighted synthetic brain MR imaging. AJR Am J Roentgenol 2001; 176: pp. 1313-1318.
16. Pikus L., Woo J.H., Wolf R.L., et. al.: Artificial multiple sclerosis lesions on simulated FLAIR brain MR images: echo time and observer performance in detection. Radiology 2006; 239: pp. 238-245.
17. Melhem E.R., Itoh R.: Effect of T1 relaxation time on lesion contrast enhancement in flair MR imaging: a study using computer-generated brain maps. AJR Am J Roentgenol 2001; 176: pp. 537-539.
18. JAFROC-1, software version 1.0, downloaded October 15, 2008. http://www.devchakraborty.com/downloads.html .
19. Dorfman D.D., Berbaum K.S., Metz C.E.: Receiver operating characteristic rating analysis. Generalization to the population of readers and patients with the jackknife method. Invest Radiol 1992; 27: pp. 723-731.
20. DBM-MRMC, software version 2.2, downloaded March 25, 2009. http://perception.radiology.uiowa.edu .
21. Obuchowski N.A.: Determining sample size for ROC studies: what is reasonable for the expected difference in tests’ ROC areas?. Acad Radiol 2003; 10: pp. 1327-1328.
22. Polman C.H., O’Connor P.W., Havrdova E., et. al.: A randomized, placebo-controlled trial of natalizumab for relapsing multiple sclerosis. N Engl J Med 2006; 354: pp. 899-910.
23. Kundel H.L., Polansky M., Dalinka M.K., et. al.: Reliability of soft-copy versus hard-copy interpretation of emergency department radiographs: a prototype study. AJR Am J Roentgenol 2001; 177: pp. 525-528.
24. Warfield S.K., Zou K.H., Wells W.M.: Simultaneous truth and performance level estimation (STAPLE): an algorithm for the validation of image segmentation. IEEE Trans Med Imaging 2004; 23: pp. 903-921.
25. Miller D.H., Grossman R.I., Reingold S.C., et. al.: The role of magnetic resonance techniques in understanding and managing multiple sclerosis. Brain 1998; 121: pp. 3-24.
26. Strasser-Fuchs S., Enzinger C., Ropele S., et. al.: Clinically benign multiple sclerosis despite large T2 lesion load: can we explain this paradox?. Mult Scler 2008; 14: pp. 205-211.
27. Daumer M., Neuhaus A., Morrissey S., et. al.: MRI as an outcome in multiple sclerosis clinical trials. Neurology 2009; 72: pp. 705-711.
28. Hashemi R.H. BWG, Lisanti C.J. MRI: the basics. Lippincott Williams & Wilkins, New York, 2003.
29. Gawne-Cain M.L., O’Riordan J.I., Thompson A.J., et. al.: Multiple sclerosis lesion detection in the brain: a comparison of fast fluid-attenuated inversion recovery and conventional T2-weighted dual spin echo. Neurology 1997; 49: pp. 364-370.
30. Wattjes M.P., Lutterbey G.G., Harzheim M., et. al.: Imaging of inflammatory lesions at 3.0 Tesla in patients with clinically isolated syndromes suggestive of multiple sclerosis: a comparison of fluid-attenuated inversion recovery with T2 turbo spin-echo. Eur Radiol 2006; 16: pp. 1494-1500.
31. Arakia Y., Ashikaga R., Fujii K., et. al.: MR fluid-attenuated inversion recovery imaging as routine brain T2-weighted imaging. Eur J Radiol 1999; 32: pp. 136-143.
32. Stevenson V.L., Parker G.J., Barker G.J., et. al.: Variations in T1 and T2 relaxation times of normal appearing white matter and lesions in multiple sclerosis. J Neurol Sci 2000; 178: pp. 81-87.
33. Chakraborty D.P., Berbaum K.S.: Observer studies involving detection and localization: modeling, analysis, and validation. Med Phys 2004; 31: pp. 2313-2330.
34. Chakraborty D.P.: Counterpoint to “Performance assessment of diagnostic systems under the FROC paradigm” by Gur and Rockette. Acad Radiol 2009; 16: pp. 507-510.
35. Chakraborty D.P.: Validation and statistical power comparison of methods for analyzing free-response observer performance studies. Acad Radiol 2008; 15: pp. 1554-1566.
36. Gur D., Rockette H.E.: Performance assessments of diagnostic systems under the FROC paradigm: experimental, analytical, and results interpretation issues. Acad Radiol 2008; 15: pp. 1312-1315.
37. Chakraborty D.P., Winter L.H.: Free-response methodology: alternate analysis and a new observer-performance experiment. Radiology 1990; 174: pp. 873-881.
38. Chakraborty D.P.: Maximum likelihood analysis of free-response receiver operating characteristic (FROC) data. Med Phys 1989; 16: pp. 561-568.
39. Dodd L.E., Wagner R.F., Armato S.G., et. al.: Assessment methodologies and statistical issues for computer-aided diagnosis of lung nodules in computed tomography: contemporary research topics relevant to the lung image database consortium. Acad Radiol 2004; 11: pp. 462-475.
40. Wagner R.F., Metz C.E., Campbell G.: Assessment of medical imaging systems and computer aids: a tutorial review. Acad Radiol 2007; 14: pp. 723-748.
41. Obuchowski N.A.: Sample size tables for receiver operating characteristic studies. AJR Am J Roentgenol 2000; 175: pp. 603-608.