
Rationale and Objectives
Delays between order and magnetic resonance (MR) exam often result when using the conventional paper-based MR safety screening process. The impact of an electronic MR safety screening process imbedded in a computerized physician order entry (CPOE) system was evaluated.
Materials and Methods
Retrospective chart review of 4 months of inpatient MR exam orders and reports was performed before and after implementation of electronic MR safety documentation. Time from order to MR exam completion, time from MR exam completion to final radiology report, and time from first order to final report were analyzed by exam anatomy. Length of stay (LOS) and date of service within the admission were also analyzed.
Results
We evaluated 1947 individual MR orders in 1549 patients under an institutional review board exemption and a waiver of informed consent. Implementation of the electronic safety screening process resulted in a significant decrease of 1.1 hours (95% confidence interval 1.0–1.3 hours) in the mean time between first order to final report and a nonsignificant decrease of 0.8 hour in the median time from first order to exam end. There was a 1-day reduction ( P = .697) in the time from admission to the MR exam compared to the paper process. No significant change in LOS was found except in neurological intensive care patients imaged within the first 24 hours of their admission, where a mean 0.9-day decrease was found.
Conclusion
Benefits of an electronic process for MR safety screening include enabling inpatients to have decreased time to MR exams, thus enabling earlier diagnosis and treatment and reduced LOS.
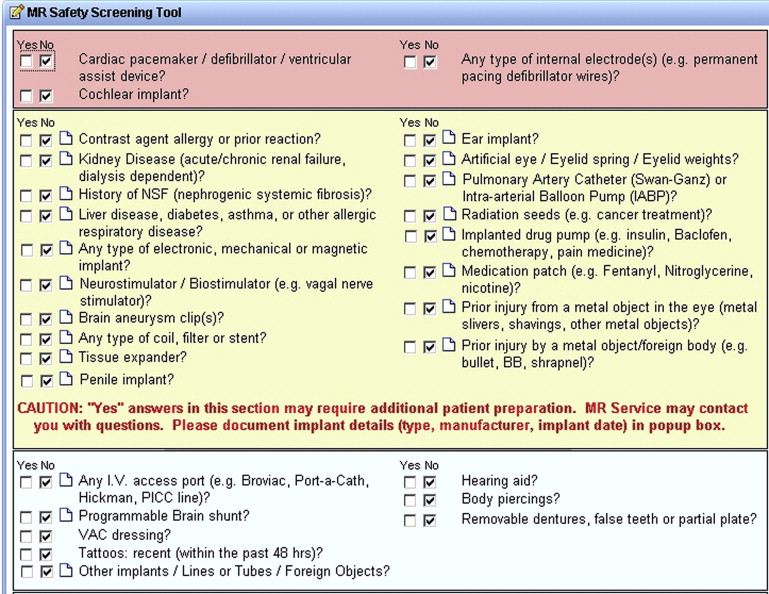
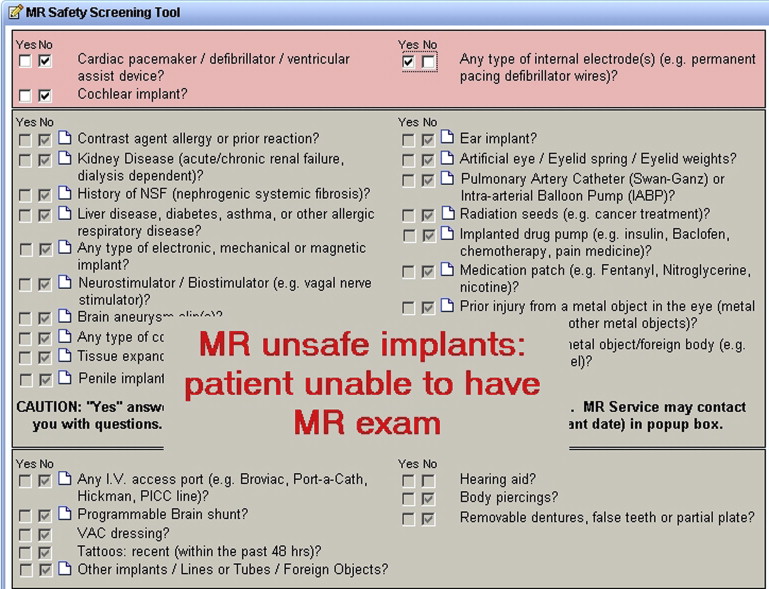
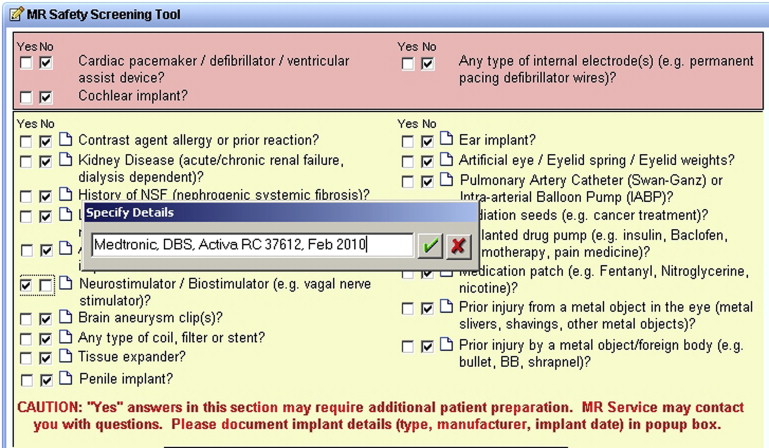
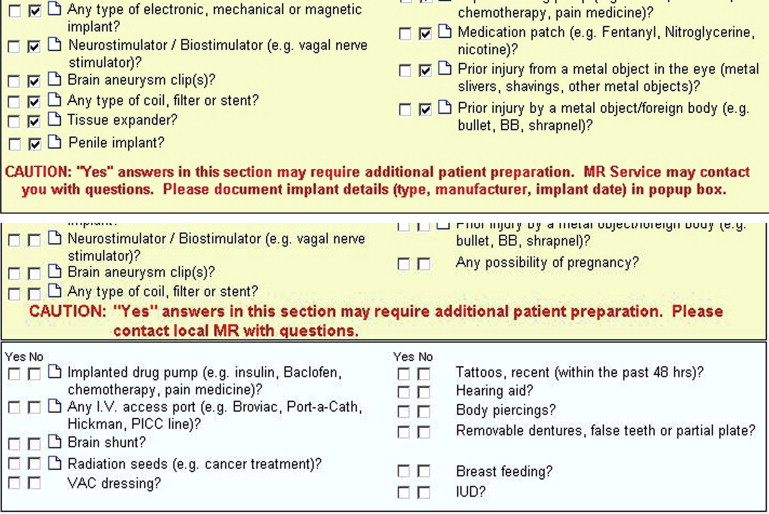
Time to completion of inpatient magnetic resonance (MR) imaging exams was thought to prolong the inpatient length of stay (LOS) in our hospital . While this is a multifactorial problem, completion of the conventional paper MR Safety Screening Form was identified to cause delays. Specific activities contributing to these delays included neglecting to complete the paper form, forgetting to fax the completed form to radiology, and changes in the hospital service so the original ordering provider is no longer available to answer questions about the patient. The desire to improve safety with a patient-level overview of implant, medical, and surgical history motivated imbedding the MR safety screening process into the computerized physician order entry (CPOE) and requiring completion before placing the MR exam order. We also sought to reduce the time to the final report and hopefully enable earlier care decisions and treatment implementation, as well as improve patient outcomes .
To date, there have been no published reports of an electronic implementation of the MR safety screening process. Here, we describe the observed impact of creating an electronic replacement for the standard paper screening method in the inpatient care environment. We hypothesized that the electronic MR safety screening would result in decreased time from order to MR exam completion and decreased time from first order to final report.
Materials and methods
Electronic MR Safety Screening Process
Get Radiology Tree app to read full this article<
Table 1
Inpatient Electronic Magnetic Resonance (MR) Safety Screening Workflow and Design Criteria
Get Radiology Tree app to read full this article<
Get Radiology Tree app to read full this article<
Get Radiology Tree app to read full this article<
Statistical Analysis
Get Radiology Tree app to read full this article<
Get Radiology Tree app to read full this article<
Get Radiology Tree app to read full this article<
Results
Get Radiology Tree app to read full this article<
Get Radiology Tree app to read full this article<
Table 2
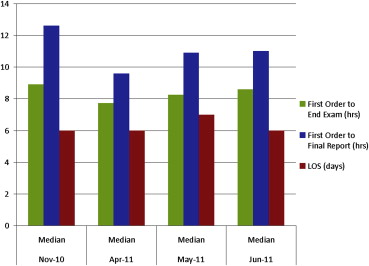
Monthly Summary of Day of Service (DOS) within the Inpatient Admission, Hospital Length of Stay (LOS), Exam End to Final Report Time, First Order to Exam End Time, and First Order to Final Report Time
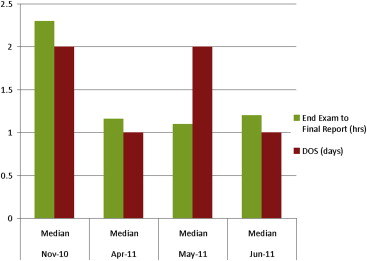
Month DOS (d) LOS (d) First Order to End Exam (h) Exam End to Final Report (h) First Order to Final Report (h) Nov–10 Median 2 6 8.9 2.3 12.6 Range 0–47 0–148 0.0–140.2 0.1–63.0 0.3–141.2 Neuro-ICU pilot Median 8.8 0.7 9.6 Range 0.2–23.1 0.4–4.5 5.4–23.8 Apr–11 Median 1 6 7.73 1.16 9.6 Range 0–55 0–259 0.0–103.0 0.1–105.7 0.8–129.6 May–11 Median 2 7 8.25 1.10 10.9 Range 0–59 0–239 0.0–96.2 0.2–49.4 0.3–106.2 Jun–11 Median 1 6 8.6 1.2 11.0 Range 0–126 0–159 0.0–81.6 0.1–190.4 0.2–232.7
Median and range values are reported. Neuro–intensive care unit (ICU) pilot data (January 2011) is provided for comparison.
Get Radiology Tree app to read full this article<
Get Radiology Tree app to read full this article<
Table 3
Median Time and Range (in Hours) from First Order to Final Report by Magnetic Resonance (MR) Exam Anatomic Location
Month Musculoskeletal Abdominal Brain Chest Spine Nov–10 Count 26 13 304 26 73 Median 24.5 20.8 12.3 6.9 12.1 Range 3.8–71.3 4.4–76.0 0.3–141.2 0.5–38.2 2.9–66.3 Apr to Jun–11 Count 73 72 968 58 257 Median 22.2 28.3 9.4 8.8 9.6 Range 0.7–232.7 2.8–167.3 0.2–103.3 2.0–51.7 1.0–76.1
Preimplementation (Nov–10) and postimplementation (Apr, May, Jun–11) times are compared. A significant increase in report turnaround time for abdominal exams (independent of implementation of the electronic MR screening tool) was found to adversely impact both the overall and the abdominal time from first order to final report.
Get Radiology Tree app to read full this article<
Get Radiology Tree app to read full this article<
Table 4
Median Time and Range (in Hours) from Exam End to Final Magnetic Resonance (MR) Exam Report (in Hours) by Anatomy
Month Musculoskeletal Abdominal Brain Chest Spine Nov–10 Count 26 13 304 26 73 Median 9.34 6.5 2.0 3.3 1.8 Range 0.5–26.8 1.2–63.0 0.1–30.8 0.5–10.8 0.3–14.4 Apr to Jun–11 Count 73 72 968 58 257 Median 6.5 14.5 0.9 3.8 1.1 Range 0.3–190.4 0.3–141.1 0.1–55.4 1.1–37.4 0.1–13.3
Preimplementation (Nov–10) and postimplementation (Apr, May, Jun–11) times are compared. A significant increase in report turnaround time was found for abdominal exams; this was reviewed and found to be independent of the electronic MR screening tool implementation. Small increases were also found for chest exam reports. Both of these increases caused increases in the time from first order to final report.
Get Radiology Tree app to read full this article<
Get Radiology Tree app to read full this article<
Get Radiology Tree app to read full this article<
Table 5
Median and Range (in Days) Length of Stay (LOS) for All Magnetic Resonance Exams on Inpatients with LOS ≥3 Days [for Direct Comparison to Batlle et al ]
LOS November (Preimplementation) April May June Postimplementation DOS (–1,0) Count 43 55 56 53 164 Mean (SD) 6.19 (3.40) 9.42 (19.12) 8.45 (7.55) 7.13 (4.72) 8.35 (12.18) Median 5 6 6 6 6 Range 3–16 3–146 3–42 3–21 3–146 DOS (1,2) Count 160 185 161 153 499 Mean (SD) 8.33 (7.73) 7.83 (4.94) 10.58 (13.54) 8.43 (8.85) 8.90 (9.87) Median 6 6 6 6 6 Range 3–51 3–29 3–94 3–76 3–94
Date of service (DOS) within the inpatient admission was limited to two groups: D (–1,0) and D (1,2) days. Preimplementation (Nov–10) and postimplementation (Apr, May, Jun–11) lengths of inpatient admissions are compared.
Get Radiology Tree app to read full this article<
Get Radiology Tree app to read full this article<
Get Radiology Tree app to read full this article<
Discussion
Get Radiology Tree app to read full this article<
Get Radiology Tree app to read full this article<
Get Radiology Tree app to read full this article<
Get Radiology Tree app to read full this article<
Get Radiology Tree app to read full this article<
Get Radiology Tree app to read full this article<
Conclusion
Get Radiology Tree app to read full this article<
Supplementary Data
Get Radiology Tree app to read full this article<
Supplemental Table 1
Get Radiology Tree app to read full this article<
Get Radiology Tree app to read full this article<
Get Radiology Tree app to read full this article<
Get Radiology Tree app to read full this article<
Get Radiology Tree app to read full this article<
Get Radiology Tree app to read full this article<
References
1. Batlle J.C., Hahn P.F., Thrall J.H., et. al.: Patients imaged early during admission demonstrate reduced length of hospital stay: a retrospective cohort study of patients undergoing cross-sectional imaging. J Am Coll Radiol 2010; 7: pp. 269-276.
2. Hurlen P., Ostbye T., Borthne A.S., et. al.: Does improved access to diagnostic imaging results reduce hospital length of stay? A retrospective study. BMC Health Serv Res 2010; 10: pp. 262-266.
3. Kanal E., Barkovich A.J., Bell C., et. al.: ACR guidance document for safe MR practices: 2007. Am J Radiol 2007; 188: pp. 1-27.
4. Sawyer-Glover A.M., Shellock F.G.: Pre-MRI procedure screening: recommendations and safety considerations for biomedical implants and devices. J Magn Reson Imaging 2000; 12: pp. 92-106.
5. Shellock F.G., Spinazzi A.: MRI safety update 2008: part 2, screening patients for MRI. AJR Am J Roentgenol 2008; 191: pp. 1-10.
6. Institute of Medicine: The state of quality improvement and implementation research.2007.National Academy of SciencesWashington, DC