
Rationale and Objectives
To develop an integrated diffusion map (iDM) for evaluation of diffusion properties, including the mean diffusivity and diffusion anisotropy concurrently.
Materials and Methods
The proposed integrated diffusion map consisted of trace and the deviation tensor. It measures the diffusion distributions from a region of interest. Diffusion tensor imaging was acquired from nine healthy volunteers and four patients with acoustic neuroma before and 3 months after the stereotactic radiosurgery. Five regions of interest were selected from healthy subjects and the whole tumor from the patients. The diffusion properties were analyzed in the proposed integrated diffusion map.
Results
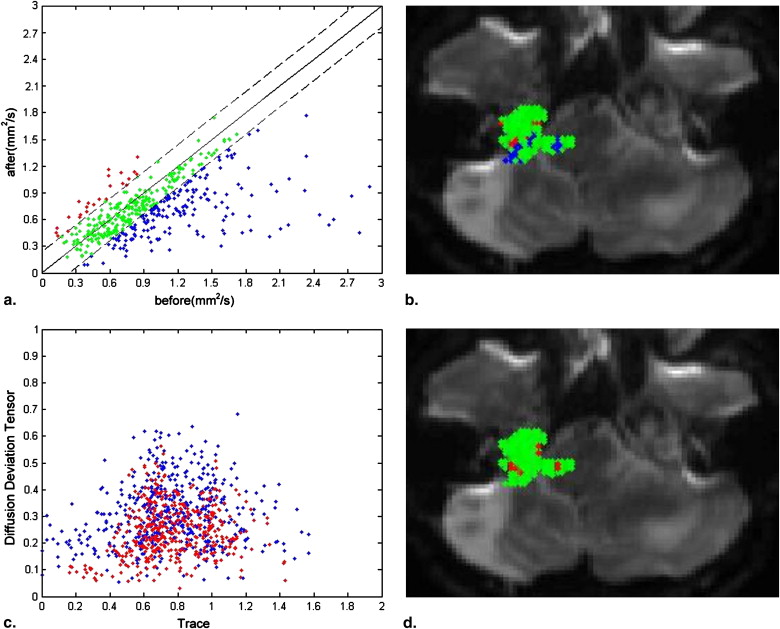
In healthy subjects, iDM showed different distributions in regions of interest that can lead to cluster segmentation. In monitoring the treatment response, the number of pixels with meaningful changes in iDM is 12.5% compared to 32.37% in apparent diffusion coefficient and 16.67% in fractional anisotropy. It suggested the effect from radiation therapy might affect the anisotropic diffusion. The interpretation of the diffusion properties, such as changes in mean diffusivity and anisotropy, should be treated in an integrated method.
Conclusions
The integrated diffusion map can be used to analyze the diffusion properties in a comprehensive manner.
Diffusion tensor imaging (DTI) is a technique to describe the microstructural properties of tissues in vivo . Indexes derived from DTI can be divided into two groups, determined by properties related to the diffusivity or anisotropy. The most commonly used indexes are trace and fractional anisotropy (FA). Trace is a reflection of the total measured diffusivity, and FA is often used to quantify the degree of anisotropy. Different anisotropy indexes, such as relative anisotropy and volume ratio , have been compared with their contrast to noise ratio and their susceptibility to noise . In general, FA is preferred because of improved noise immunity and superior contrast to noise ratio in both simulation and in vivo studies compared to relative anisotropy (RA) and volume ratio (VR). A new index, such as InterVoxel Diffusion Coherence, has been proposed to further quantify the diffusion directional coherence .
The change of diffusion related to several diseases can be effectively detected by DTI . Several studies have reported a decline in FA and an increase in mean diffusivity. For example, in epilepsy patients, DTI shows increased diffusivity and reduced anisotropy, suggesting loss of structural organization and expansion of the extracellular space . In patients with multiple sclerosis, trace increased and FA decreased in segmented white matter in the whole multiple sclerosis group compared to their matched controls .
Get Radiology Tree app to read full this article<
Get Radiology Tree app to read full this article<
Get Radiology Tree app to read full this article<
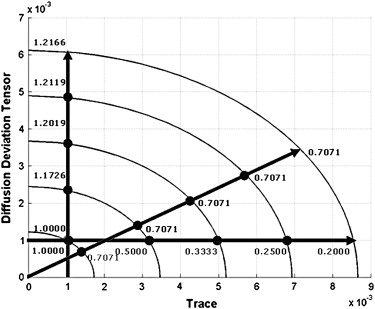
Theory
Get Radiology Tree app to read full this article<
Trace=λ1+λ2+λ3 Trace
=
λ
1
+
λ
2
+
λ
3
Get Radiology Tree app to read full this article<
Get Radiology Tree app to read full this article<
DD=λ21+λ22+λ23−−−−−−−−−−√ D
D
=
λ
1
2
+
λ
2
2
+
λ
3
2
Get Radiology Tree app to read full this article<
Get Radiology Tree app to read full this article<
Deviation=32((λ1−λ¯)2+(λ2−λ¯)2+(λ3−λ¯)2)−−−−−−−−−−−−−−−−−−−−−−−−−−−−−−√ Deviation
=
3
2
(
(
λ
1
−
λ
¯
)
2
+
(
λ
2
−
λ
¯
)
2
+
(
λ
3
−
λ
¯
)
2
)
(Trace3√)2+(Deviation3/2√)2=DD2 (
Trace
3
)
2
+
(
Deviation
3
/
2
)
2
=
D
D
2
Get Radiology Tree app to read full this article<
Get Radiology Tree app to read full this article<
Get Radiology Tree app to read full this article<
Get Radiology Tree app to read full this article<
Materials and Methods
Get Radiology Tree app to read full this article<
Healthy Volunteers
Get Radiology Tree app to read full this article<
Get Radiology Tree app to read full this article<
Patients with Acoustic Neuroma
Get Radiology Tree app to read full this article<
Get Radiology Tree app to read full this article<
DTI Analysis
Get Radiology Tree app to read full this article<
Get Radiology Tree app to read full this article<
Get Radiology Tree app to read full this article<
Result
Get Radiology Tree app to read full this article<
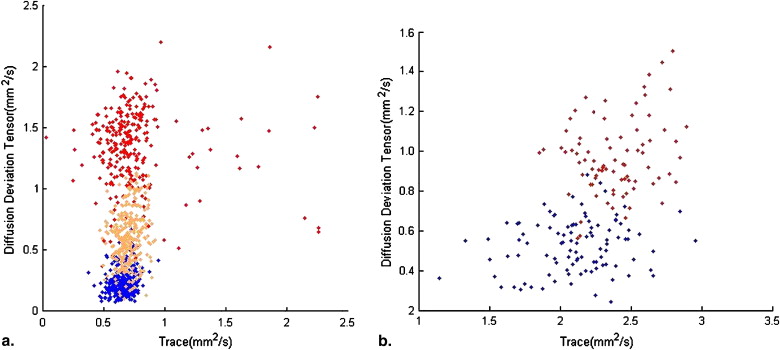
Table 1
The Averaged FA, DD, and ADC from Healthy Volunteers
Callosal splenium Lentiform nucleus External capsule Thalamus Subcortical white matter FA 0.82 ± 0.18 0.24 ± 0.10 0.55 ± 0.16 0.39 ± 0.05 0.61 ± 0.04 ADC (mm 2 /second) 0.77 ± 0.40 0.66 ± 0.08 0.70 ± 0.09 0.71 ± 0.02 0.77 ± 0.06 DD (mm 2 /second) 1.58 ± 0.42 0.71 ± 0.19 0.92 ± 0.18 1.30 ± 0.41 1.53 ± 0.14
The regions of interest included callosal splenium, lentiform nucleus, external capsule, thalamus, and subcortical white matter in the parietal lobe. FA (fractional anisotropy) is dimensionless. Both DD and ADC (apparent diffusion coefficient) are in units of square millimeters per second.
Get Radiology Tree app to read full this article<
Get Radiology Tree app to read full this article<
Get Radiology Tree app to read full this article<
Get Radiology Tree app to read full this article<
Table 2
The Percentage Change in Patients Measured from fDM and iDM
Changed Unchanged Integrated 12.5 ± 3.6 87.5 ± 3.6 fDM Increase Decrease 15.22 ± 3.9 17.15 ± 2.7 67.63 ± 3.2
The fractional anisotrophy (FA) and apparent diffusion coefficient (ADC) were calculated for each individual subject within the whole volume of tumor, selected from consecutive slices, before and after the stereotactic radiosurgery. The number of pixels of changes was calculated from fDM. In the integrated diffusion map, only with or without significant changes was shown. iDM, integrated diffusion map; fDM, functional diffusion map.
Get Radiology Tree app to read full this article<
Discussion
An iDM for Diffusion Evaluation
Get Radiology Tree app to read full this article<
Get Radiology Tree app to read full this article<
Get Radiology Tree app to read full this article<
In Healthy Volunteers
Get Radiology Tree app to read full this article<
Get Radiology Tree app to read full this article<
Get Radiology Tree app to read full this article<
Monitoring Tumor Response after Treatment
Get Radiology Tree app to read full this article<
Get Radiology Tree app to read full this article<
Get Radiology Tree app to read full this article<
Get Radiology Tree app to read full this article<
Get Radiology Tree app to read full this article<
Get Radiology Tree app to read full this article<
Get Radiology Tree app to read full this article<
Get Radiology Tree app to read full this article<
References
1. Pierpaoli C., Basser P.J.: Toward a quantitative assessment of diffusion anisotropy. Magn Reson Med 1996; 36: pp. 893-906.
2. Basser P.J.: Inferring microstructural features and the physiological state of tissues from diffusion-weighted images. NMR Biomed 1995; 8: pp. 333-344.
3. Wang J.J., et. al.: Novel diffusion anisotropy indices: an evaluation. J Magn Reson Imaging 2006; 24: pp. 211-221.
4. Conturo T.E., et. al.: Encoding of anisotropic diffusion with tetrahedral gradients: a general mathematical diffusion formalism and experimental results. Magn Reson Med 1996; 35: pp. 399-412.
5. Hasan K.M., Alexander A.L., Narayana P.A.: Does fractional anisotropy have better noise immunity characteristics than relative anisotropy in diffusion tensor MRI? An analytical approach. Magn Reson Med 2004; 51: pp. 413-417.
6. Kingsley P.B., Monahan W.G.: Contrast-to-noise ratios of diffusion anisotropy indices. Magn Reson Med 2005; 53: pp. 911-918.
7. Wang J., et. al.: Visualization of the coherence of the principal diffusion orientation: an eigenvector-based approach. Magn Reson Med 2008; 59: pp. 764-770.
8. Filippi M., Inglese M.: Overview of diffusion-weighted magnetic resonance studies in multiple sclerosis. J Neurol Sci 2001; 186: pp. S37-S43.
9. Fu L., et. al.: Imaging axonal damage of normal-appearing white matter in multiple sclerosis. Brain 1998; 121: pp. 103-113.
10. Warach S., et. al.: Acute human stroke studied by whole brain echo planar diffusion-weighted magnetic resonance imaging. Ann Neurol 1995; 37: pp. 231-241.
11. Arfanakis K., et. al.: Diffusion tensor MRI in temporal lobe epilepsy. Magn Reson Imaging 2002; 20: pp. 511-519.
12. Cassol E., et. al.: Diffusion tensor imaging in multiple sclerosis: a tool for monitoring changes in normal-appearing white matter. Mult Scler 2004; 10: pp. 188-196.
13. Sotak C.H.: The role of diffusion tensor imaging in the evaluation of ischemic brain injury—a review. NMR Biomed 2002; 15: pp. 561-569.
14. Moffat B.A., et. al.: Functional diffusion map: a noninvasive MRI biomarker for early stratification of clinical brain tumor response. Proc Natl Acad Sci U S A 2005; 102: pp. 5524-5529.
15. Guo A.C., et. al.: Lymphomas and high-grade astrocytomas: comparison of water diffusibility and histologic characteristics. Radiology 2002; 224: pp. 177-183.
16. Yang Q., et. al.: Serial study of apparent diffusion coefficient and anisotropy in patients with acute stroke. Stroke 1999; 30: pp. 2382-2390.
17. Werring D.J., et. al.: Diffusion tensor imaging can detect and quantify corticospinal tract degeneration after stroke. J Neurol Neurosurg Psychiatry 2000; 69: pp. 269-272.
18. Schwamm L.H., et. al.: Time course of lesion development in patients with acute stroke: serial diffusion- and hemodynamic-weighted magnetic resonance imaging. Stroke 1998; 29: pp. 2268-2276.
19. Hamstra D.A., et. al.: Evaluation of the functional diffusion map as an early biomarker of time-to-progression and overall survival in high-grade glioma. Proc Natl Acad Sci U S A 2005; 102: pp. 16759-16764.
20. Moffat B.A., et. al.: The functional diffusion map: an imaging biomarker for the early prediction of cancer treatment outcome. Neoplasia 2006; 8: pp. 259-267.
21. Beppu T., et. al.: Measurement of fractional anisotropy using diffusion tensor MRI in supratentorial astrocytic tumors. J Neurooncol 2003; 63: pp. 109-116.
22. Spiegelmann R., et. al.: L inear accelerator radiosurgery for vestibular schwannoma. J Neurosurg 2001; 94: pp. 7-13.
23. Okunaga T., et. al.: Linear accelerator radiosurgery for vestibular schwannoma: measuring tumor volume changes on serial three-dimensional spoiled gradient-echo magnetic resonance images. J Neurosurg 2005; 103: pp. 53-58.