
Rationale and Objectives
This study aims to investigate the value of a magnetic resonance imaging–based radiomics classifier for preoperatively predicting the Ki-67 status in patients with breast cancer.
Materials and Methods
We chronologically divided 318 patients with clinicopathologically confirmed breast cancer into a training dataset ( n = 200) and a validation dataset ( n = 118). Radiomics features were extracted from T2-weighted (T2W) and contrast-enhanced T1-weighted (T1+C) images of breast cancer. Radiomics feature selection and radiomics classifiers were generated using the least absolute shrinkage and selection operator regression analysis method. The correlation between the radiomics classifiers and the Ki-67 status in patients with breast cancer was explored. The predictive performances of the radiomics classifiers for the Ki-67 status were evaluated with receiver operating characteristic curves in the training dataset and validated in the validation dataset.
Results
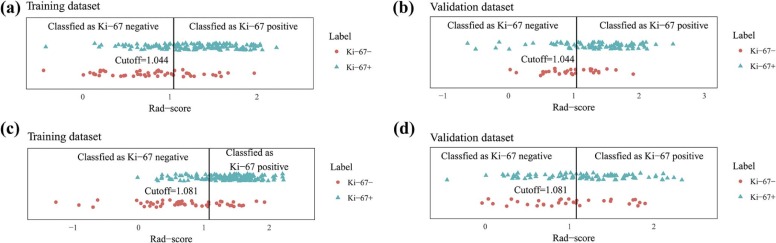
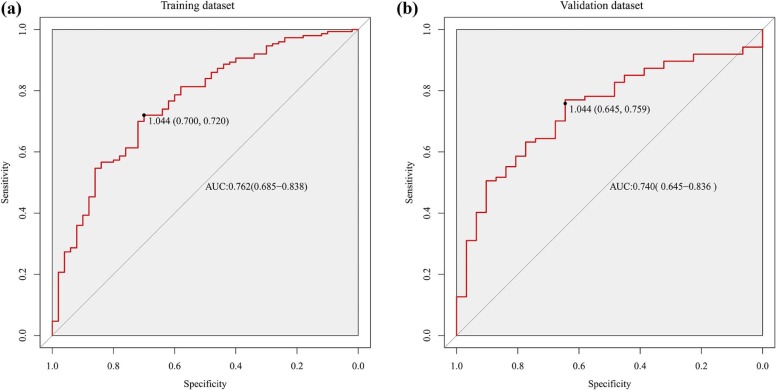
Through the radiomics feature selection, 16 and 14 features based on T2W and T1+C images, respectively, were selected to constitute the radiomics classifiers. The radiomics classifier based on T2W images was significantly correlated with the Ki-67 status in both the training and the validation datasets (both P < .0001). The radiomics classifier based on T1+C images was significantly correlated with the Ki-67 status in the training dataset ( P < .0001) but not in the validation dataset ( P = .083). The T2W image–based radiomics classifier exhibited good discrimination for Ki-67 status, with areas under the receiver operating characteristic curves of 0.762 (95% confidence interval: 0.685, 0.838) and 0.740 (95% confidence interval: 0.645, 0.836) in the training and validation datasets, respectively.
Conclusions
The T2W image–based radiomics classifier was a significant predictor of Ki-67 status in patients with breast cancer. Thus, it may serve as a noninvasive approach to facilitate the preoperative prediction of Ki-67 status in clinical practice.
Introduction
Breast cancer is the most common cancer in women, and the incidence rates are increasing worldwide . As personalized, precision medicine is becoming more prevalent, tumor biomarker assays are playing a more important role in guiding clinical care . Biomarker assay results can indicate the diagnosis and prognosis, as well as the need for monitoring for recurrence or progression in patients with breast cancer according to the American Society of Clinical Oncology guidelines . In particular, the Ki-67 labeling index is known to be a valuable prognostic marker in breast cancer . Moreover, the Ki-67 value is a significant indicator of potential triage to chemotherapy, whereas the Ki-67-based Preoperative Endocrine Prognostic Index is a feasible predictor of the risk of relapse . According to a study by Dowsett et al. , the predictive performance of the recurrence-free survival can be improved by measuring the tumor Ki-67 labeling index in patients undergoing short-term endocrine therapy. However, the accuracy of traditional invasive detection methods, that is, biopsy samples, is influenced by sampling errors, as they ignore intratumoral heterogeneity expression . In addition, research has shown that the Ki-67 status dynamically changes during treatment , and thus it is difficult to evaluate the Ki-67 status using only one biopsy. Therefore, an accurate, noninvasive predictor of the Ki-67 status in patients with breast cancer is clinically desirable.
Radiomics, which differs from the traditional practice of using medical images solely for visual interpretation, is the transition of digital medical images into mineable data through the high-throughput extraction of abundant quantitative features based on shape, intensity, size, or volume, among others . Radiomics data can be applied to build descriptive or predictive models that correlate quantitative image features with phenotypes or gene-protein markers, potentially assisting in the following: cancer detection, diagnosis, and staging; predicting the response to treatment; monitoring the disease status; and assessing the prognosis . Radiomics features have already been shown to aid in the diagnosis , molecular subtyping , prognosis, and prediction of the response to treatment in patients with breast cancer . Furthermore, in a study by Ha et al., 18 F-fluorodeoxyglucose positron emission tomography–based radiomics patterns of locally advanced breast cancer were associated with Ki-67 expression, the pathologic complete response to neoadjuvant chemotherapy, and the risk of recurrence, supporting the potential of such patterns to assist in the development of personalized disease management strategies .
Get Radiology Tree app to read full this article<
Materials and Methods
Patients
Get Radiology Tree app to read full this article<
Get Radiology Tree app to read full this article<
Ki-67 Measurements
Get Radiology Tree app to read full this article<
MR Image Acquisition
Get Radiology Tree app to read full this article<
Region of Interest Delineation
Get Radiology Tree app to read full this article<
Radiomics Feature Extraction
Get Radiology Tree app to read full this article<
Radiomics Feature Selection and Classifier Building
Get Radiology Tree app to read full this article<
X′=(X−X¯¯¯)/SD. X
′
=
(
X
−
X
¯
)
/
S
D
.
The least absolute shrinkage and selection operator (LASSO) logistic regression analysis method, which is suited to the regression of high-dimensional data, was used to perform radiomics feature selection in the training dataset. This method minimizes the sum of squares of residues, with the sum of the absolute values of the selected features coefficients being no more than a tuning parameter (λ) . As λ becomes smaller, the coefficients of more features are set to 0. Features that contributed well to the model were selected and used to construct a radiomics classifier when the area under the receiver operating characteristic (ROC) curve (AUC) of the binary logistic regression model was the largest. Finally, a radiomics score (Rad-score) was calculated for each patient through the linear combination of the selected features weighted by their respective coefficients.
Get Radiology Tree app to read full this article<
Statistical Analyses
Patients’ Clinicopathologic Characteristics
Get Radiology Tree app to read full this article<
Performance of the Radiomics Classifiers
Get Radiology Tree app to read full this article<
Get Radiology Tree app to read full this article<
Results
Patients’ Clinicopathologic Characteristics
Get Radiology Tree app to read full this article<
Get Radiology Tree app to read full this article<
Radiomics Feature Selection and Classifier Building
Get Radiology Tree app to read full this article<
Get Radiology Tree app to read full this article<
Performance of the Radiomics Classifiers
Get Radiology Tree app to read full this article<
TABLE 1
Radiomics Score (Rad-score) for Ki-67 Status in the Training and Validation Dataset
Rad-score Ki-67 (−) Median (IQR) Ki-67(+) Median (IQR)P T2 Training 0.841 (0.446, 1.155) 1.325 (0.963, 1.616) <.0001 Validation 0.956 (0.711, 1.268) 1.390 (1.064, 1.691) <.0001 T1+C Training 0.682 (0.301, 1.229) 1.397 (1.061, 1.654) <.0001 Validation 0.956 (0.625, 1.448) 1.206 (0.836, 1.554) .083
IQR, interquartile range; Rad-score, radiomics score; T1+C, contrast-enhanced T1-weighted images; T2, T2-weighted images.
Get Radiology Tree app to read full this article<
Get Radiology Tree app to read full this article<
TABLE 2
The Predictive Performance of Radiomics Classifier Based on T2WI
Dataset Cutoff AUC (95% CI) SEN SPE Accuracy PPV NPV Training 1.044 0.762 (0.685,0.838) 0.720 0.700 0.715 0.878 0.455 Validation 1.044 0.740 (0.645,0.836) 0.759 0.645 0.729 0.857 0.488
95% CI, 95% confidence interval; AUC, area under curve; NPV, negative predictive value; PPV, positive predictive value; SEN, sensitivity; SPE, specificity.
Get Radiology Tree app to read full this article<
Discussion
Get Radiology Tree app to read full this article<
Get Radiology Tree app to read full this article<
Get Radiology Tree app to read full this article<
Get Radiology Tree app to read full this article<
Get Radiology Tree app to read full this article<
Get Radiology Tree app to read full this article<
Get Radiology Tree app to read full this article<
Acknowledgments
Get Radiology Tree app to read full this article<
Supplementary Data
Get Radiology Tree app to read full this article<
Appendix S1
Get Radiology Tree app to read full this article<
Get Radiology Tree app to read full this article<
Get Radiology Tree app to read full this article<
References
1. Bray F., Jemal A., Grey N., et. al.: Global cancer transitions according to the Human Development Index (2008–2030): a population-based study. Lancet Oncol 2012; 13: pp. 790-801.
2. Torre L.A., Bray F., Siegel R.L., et. al.: Global cancer statistics, 2012. CA Cancer J Clin 2015; 65: pp. 87-108.
3. Harris L.N., Ismaila N., McShane L.M., et. al.: Use of biomarkers to guide decisions on adjuvant systemic therapy for women with early-stage invasive breast cancer: American Society of Clinical Oncology Clinical Practice Guideline. J Clin Oncol 2016; 34: pp. 1134-1150.
4. Harris L., Fritsche H., Mennel R., et. al.: American Society of Clinical Oncology 2007 update of recommendations for the use of tumor markers in breast cancer. J Clin Oncol 2007; 25: pp. 5287-5312.
5. Viale G., Giobbie-Hurder A., Regan M.M., et. al.: Prognostic and predictive value of centrally reviewed Ki-67 labeling index in postmenopausal women with endocrine-responsive breast cancer: results from Breast International Group Trial 1–98 comparing adjuvant tamoxifen with letrozole. J Clin Oncol 2008; 26: pp. 5569-5575.
6. Ellis M.J., Suman V.J., Hoog J., et. al.: Ki67 proliferation index as a tool for chemotherapy decisions during and after neoadjuvant aromatase inhibitor treatment of breast cancer: results from the American College of Surgeons Oncology Group Z1031 Trial (Alliance). J Clin Oncol 2017; 35: pp. 1061-1069.
7. Dowsett M., Smith I.E., Ebbs S.R., et. al.: Prognostic value of Ki67 expression after short-term presurgical endocrine therapy for primary breast cancer. J Natl Cancer Inst 2007; 99: pp. 167-170.
8. Diwakar N., Sperandio M., Sherriff M., et. al.: Heterogeneity, histological features and DNA ploidy in oral carcinoma by image-based analysis. Oral Oncol 2005; 41: pp. 416-422.
9. Gillies R.J., Kinahan P.E., Hricak H.: Radiomics: images are more than pictures, they are data. Radiology 2016; 278: pp. 563-577.
10. Lambin P., Rios-Velazquez E., Leijenaar R., et. al.: Radiomics: extracting more information from medical images using advanced feature analysis. Eur J Cancer 2012; 48: pp. 441-446.
11. Huang Y., Liu Z., He L., et. al.: Radiomics signature: a potential biomarker for the prediction of disease-free survival in early-stage (I or II) non-small cell lung cancer. Radiology 2016; 281: pp. 947-957.
12. Huang Y.Q., Liang C.H., He L., et. al.: Development and validation of a radiomics nomogram for preoperative prediction of lymph node metastasis in colorectal cancer. J Clin Oncol 2016; 34: pp. 2157-2164.
13. Liang C., Huang Y., He L., et. al.: The development and validation of a CT-based radiomics signature for the preoperative discrimination of stage I-II and stage III-IV colorectal cancer. Oncotarget 2016; 7: pp. 31401-31412.
14. Bickelhaupt S., Paech D., Kickingereder P., et. al.: Prediction of malignancy by a radiomic signature from contrast agent-free diffusion MRI in suspicious breast lesions found on screening mammography. J Magn Reson Imaging 2017; 46: pp. 604-616.
15. Li H., Zhu Y., Burnside E.S., et. al.: Quantitative MRI radiomics in the prediction of molecular classifications of breast cancer subtypes in the TCGA/TCIA data set. NPJ Breast Cancer 2016; 2:
16. Li H., Zhu Y., Burnside E.S., et. al.: MR imaging radiomics signatures for predicting the risk of breast cancer recurrence as given by research versions of MammaPrint, Oncotype DX, and PAM50 gene assays. Radiology 2016; 281: pp. 382-391.
17. Ha S., Park S., Bang J.I., et. al.: Metabolic radiomics for pretreatment 18F-FDG PET/CT to characterize locally advanced breast cancer: histopathologic characteristics, response to neoadjuvant chemotherapy, and prognosis. Sci Rep 2017; 7: pp. 1556.
18. Cuzick J., Dowsett M., Pineda S., et. al.: Prognostic value of a combined estrogen receptor, progesterone receptor, Ki-67, and human epidermal growth factor receptor 2 immunohistochemical score and comparison with the Genomic Health recurrence score in early breast cancer. J Clin Oncol 2011; 29: pp. 4273-4278.
19. Goldhirsch A., Wood W.C., Coates A.S., et. al.: Strategies for subtypes—dealing with the diversity of breast cancer: highlights of the St. Gallen International Expert Consensus on the Primary Therapy of Early Breast Cancer 2011. Ann Oncol 2011; 22: pp. 1736-1747.
20. Sasikala V., LakshmiPrabha V.: A comparative study on the swarm intelligence based feature selection approaches for fake and real fingerprint classification. 2015 International Conference on Soft-Computing and Networks Security (ICSNS)2015.pp. 1-8.
21. Aerts H.J., Velazquez E.R., Leijenaar R.T., et. al.: Decoding tumour phenotype by noninvasive imaging using a quantitative radiomics approach. Nat Commun 2014; 5: pp. 4006.
22. Osborne M.R., Presnell B., Turlach B.A.: On the LASSO and its dual. J Comput Graph Stat 2000; 9: pp. 319-337.
23. Stathopoulos G.P., Malamos N.A., Markopoulos C., et. al.: The role of Ki-67 in the proliferation and prognosis of breast cancer molecular classification subtypes. Anticancer Drugs 2014; 25: pp. 950-957.
24. Porschen R., Lohe B., Hengels K.J., et. al.: Assessment of cell proliferation in colorectal carcinomas using the monoclonal antibody Ki-67. Correlation with pathohistologic criteria and influence of irradiation. Cancer 1989; 64: pp. 2501-2505.
25. Besusparis J., Plancoulaine B., Rasmusson A., et. al.: Impact of tissue sampling on accuracy of Ki67 immunohistochemistry evaluation in breast cancer. Diagn Pathol 2016; 11: pp. 82.
26. Boros M., Moncea D., Moldovan C., et. al.: Intratumoral heterogeneity for Ki-67 index in invasive breast carcinoma: a study on 131 consecutive cases. Appl Immunohistochem Mol Morphol 2017; 25: pp. 338-340.
27. Ng F., Ganeshan B., Kozarski R., et. al.: Assessment of primary colorectal cancer heterogeneity by using whole-tumor texture analysis: contrast-enhanced CT texture as a biomarker of 5-year survival. Radiology 2013; 266: pp. 177-184.
28. Yun B.L., Cho N., Li M., et. al.: Intratumoral heterogeneity of breast cancer xenograft models: texture analysis of diffusion-weighted MR imaging. Korean J Radiol 2014; 15: pp. 591-604.
29. Sala E., Mema E., Himoto Y., et. al.: Unravelling tumour heterogeneity using next-generation imaging: radiomics, radiogenomics, and habitat imaging. Clin Radiol 2017; 72: pp. 3-10.
30. Santamaria G., Velasco M., Bargallo X., et. al.: Radiologic and pathologic findings in breast tumors with high signal intensity on T2-weighted MR images. Radiographics 2010; 30: pp. 533-548.
31. Velasco M., Santamaria G., Ganau S., et. al.: MRI of metaplastic carcinoma of the breast. AJR Am J Roentgenol 2005; 184: pp. 1274-1278.
32. Kuhl C.: The current status of breast MR imaging. Part I. Choice of technique, image interpretation, diagnostic accuracy, and transfer to clinical practice. Radiology 2007; 244: pp. 356-378.
33. Schieda N., Coffey N., Gulavita P., et. al.: Prostatic ductal adenocarcinoma: an aggressive tumour variant unrecognized on T2 weighted magnetic resonance imaging (MRI). Eur Radiol 2014; 24: pp. 1349-1356.
34. Jha R.C., Zanello P.A., Nguyen X.M., et. al.: Small hepatocellular carcinoma: MRI findings for predicting tumor growth rates. Acad Radiol 2014; 21: pp. 1455-1464.
35. Iglesias A., Arias M., Santiago P., et. al.: Benign breast lesions that simulate malignancy: magnetic resonance imaging with radiologic-pathologic correlation. Curr Probl Diagn Radiol 2007; 36: pp. 66-82.
36. Huang J., Hahn T., Hoisington L., et. al.: Improving suspicious breast lesion characterization using semi-automatic lesion fractional volume washout kinetic analysis. Med Phys 2011; 38: pp. 5998-6009.
37. Mann R.M., Mus R.D., van Zelst J., et. al.: A novel approach to contrast-enhanced breast magnetic resonance imaging for screening: high-resolution ultrafast dynamic imaging. Invest Radiol 2014; 49: pp. 579-585.
38. Kuhl C.K.: Abbreviated breast MRI for screening women with dense breast: the EA1141 trial. Br J Radiol 2017; pp. 20170441.
39. Petrillo A., Fusco R., Sansone M., et. al.: Abbreviated breast dynamic contrast-enhanced MR imaging for lesion detection and characterization: the experience of an Italian oncologic center. Breast Cancer Res Treat 2017; 164: pp. 401-410.
40. Lubner M.G., Stabo N., Lubner S.J., et. al.: CT textural analysis of hepatic metastatic colorectal cancer: pre-treatment tumor heterogeneity correlates with pathology and clinical outcomes. Abdom Imaging 2015; 40: pp. 2331-2337.