
Rationale and Objectives
The aims of this study were to investigate improving work flow efficiency by shortening the reading time of digital mammograms using a computer-aided reading protocol (CARP) in the screening environment and to increase detection sensitivity using CARP, compared to the current protocol, commonly referred to as the quadrant view (QV).
Materials and Methods
A total of 200 cases were selected for a receiver-operating characteristic (ROC) study to evaluate two image display work flows, CARP and QV, in the screening environment. A Web-based tool was developed for scoring, reporting, and statistical analysis. Cases were scored for and stratified by difficulty. A total of six radiologists of differing levels of training ranging from dedicated mammographers to senior radiology residents participated. Each was timed while interpreting the 200 cases in groups of 50, first using QV and then, after a washout period, using CARP. The data were analyzed using ROC and κ analysis. Interpretation times were also assessed.
Results
Using QV, readers’ average area under the ROC curve was 0.68 (range, 0.54–0.73). Using CARP, readers’ average area under the ROC curve was 0.71 (range, 0.66–0.75). There was no statistically significant difference in reader performance using either work flow. However, there was a statistically significant reduction in the average interpretation time of negative cases from 64.7 seconds using QV to 58.8 seconds using CARP.
Conclusions
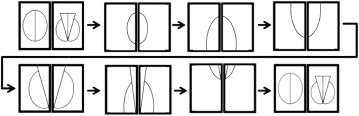
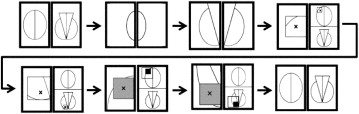
CARP determines the display order of regions of interest depending on computer-aided detection findings. This is a variation of traditional computer-aided detection for digital mammography that has the potential to reduce interpretation times of studies with negative findings without significantly affecting sensitivity, thus allowing improved work flow efficiency in the screening environment, in which, in most settings, the majority of cases are negative.
Mammography has been and continues to be valuable in the detection of breast cancer. Because the early detection of a potential malignancy could improve the chance of survival, Breast Imaging Reporting and Data System (BI-RADS) categories 4 and 5 usually proceed to biopsy .
Changes in technology, most notably the advent and rapid adoption of full-field digital mammography, have improved the practice of mammography. However, the move to digital mammography does not come without drawbacks. In the setting of screening mammography interpretation, it has been demonstrated that digital mammograms take more time to read than similar film-screen mammograms .
Get Radiology Tree app to read full this article<
Get Radiology Tree app to read full this article<
Get Radiology Tree app to read full this article<
Get Radiology Tree app to read full this article<
Materials and methods
Data Set
Get Radiology Tree app to read full this article<
Get Radiology Tree app to read full this article<
Get Radiology Tree app to read full this article<
Get Radiology Tree app to read full this article<
Get Radiology Tree app to read full this article<
Get Radiology Tree app to read full this article<
Get Radiology Tree app to read full this article<
Get Radiology Tree app to read full this article<
Get Radiology Tree app to read full this article<
Get Radiology Tree app to read full this article<
Get Radiology Tree app to read full this article<
Get Radiology Tree app to read full this article<
Table 1
Distribution of Difficulty Scores for the 100 Malignant Pathology Cases
Score Mass Calcification Associated Findings 0 25% 61% 0% 1 25% 8% 0% 2 12% 13% 0% 3 13% 4% 18% 4 25% 14% 82% Total 100% 100% 100%
Table 2
Distribution of Difficulty Scores for the 100 Benign Pathology Cases
Score Mass Calcification Associated Findings 0 70% 78% 0% 1 11% 7% 0% 2 4% 6% 0% 3 8% 6% 3% 4 7% 3% 97% Total 100% 100% 100%
Table 3
Distribution of Breast Density for All 200 Cases
Breast Density Mass and Calcification Normal and Benign Fat <25% glandular 12% 16% Fibroglandular 25% to 50% 47% 35% Dense 51% to 75% 32% 42% Extreme Dense >75% 9% 7% Total 100% 100%
Get Radiology Tree app to read full this article<
Get Radiology Tree app to read full this article<
QV and CARP Systems
Get Radiology Tree app to read full this article<
Get Radiology Tree app to read full this article<
Get Radiology Tree app to read full this article<
Get Radiology Tree app to read full this article<
Get Radiology Tree app to read full this article<
Observer Performance Study
Get Radiology Tree app to read full this article<
Get Radiology Tree app to read full this article<
Get Radiology Tree app to read full this article<
Get Radiology Tree app to read full this article<
Get Radiology Tree app to read full this article<
Get Radiology Tree app to read full this article<
Get Radiology Tree app to read full this article<
Get Radiology Tree app to read full this article<
Get Radiology Tree app to read full this article<
Get Radiology Tree app to read full this article<
Data and Statistical Analysis
Case selection
Get Radiology Tree app to read full this article<
Interpretation
Get Radiology Tree app to read full this article<
Get Radiology Tree app to read full this article<
Get Radiology Tree app to read full this article<
Get Radiology Tree app to read full this article<
Get Radiology Tree app to read full this article<
Get Radiology Tree app to read full this article<
Results
Multireader Multicase ROC Analysis
Get Radiology Tree app to read full this article<
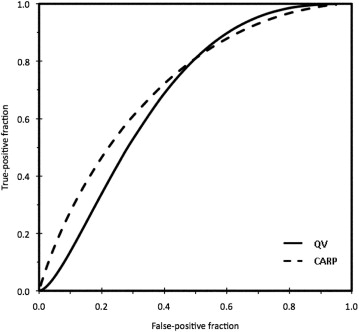
Table 4
Individual Reader Performance Using Both the QV and CARP Systems
Radiologist QV CARP CARP − QV Reader 1 ∗ .65 .71 .06 Reader 2 ∗ .70 .75 .05 Reader 3 † .74 .72 −01 Reader 4 † .55 .68 .13 Reader 5 ‡ .72 .73 .01 Reader 6 ‡ .73 .66 −.07 Average .68 .71 .029 Standard error .04 .04
CARP, computed-aided reading protocol; QV, quadrant view.
Get Radiology Tree app to read full this article<
Get Radiology Tree app to read full this article<
Get Radiology Tree app to read full this article<
Get Radiology Tree app to read full this article<
Interpretation Time: QV Versus CARP: Overall and Case Types
Get Radiology Tree app to read full this article<
Table 5
Mean Interpretation Time (Individual Readers) for Negative, Positive, and Total Cases and Corresponding Differences
Mean ± Standard Error QV − CARP_P_ QV CARP Negative cases 64.72 ± 1.91 58.79 ± 1.68 5.93 .001 Positive cases 71.28 ± 2.21 69.99 ± 1.98 1.29 .528 All cases 67.99 ± 1.46 64.39 ± 1.30 3.61 .008
CARP, computed-aided reading protocol; QV, quadrant view.
Get Radiology Tree app to read full this article<
Get Radiology Tree app to read full this article<
Get Radiology Tree app to read full this article<
Table 6
Individual Reader Mean Performance Times for Negative or Benign Cases
Radiologist System Mean ± Standard Error Difference_P_ Reader 1 ∗ QV 34.56 ± 2.21 7.85 .003 CARP 26.71 ± 1.23 Reader 2 ∗ QV 35.92 ± 1.87 −5.71 .017 CARP 41.63 ± 1.89 Reader 3 † QV 48.50 ± 3.07 5.20 .119 CARP 43.30 ± 2.39 Reader 4 † QV 100.86 ± 4.50 20.55 .000 CARP 80.31 ± 3.37 Reader 5 ‡ QV 93.54 ± 5.17 12.76 .033 CARP 80.78 ± 4.34 Reader 6 ‡ QV 74.92 ± 4.99 −5.06 .366 CARP 79.98 ± 5.66
CARP, computed-aided reading protocol; QV, quadrant view.
Get Radiology Tree app to read full this article<
Get Radiology Tree app to read full this article<
Get Radiology Tree app to read full this article<
Table 7
Individual Reader Mean Performance Times for Malignant Cases
Radiologist System Mean ± Standard Error Difference Significance Reader 1 ∗ QV 34.14 ± 2.48 4.19 .167 CARP 29.95 ± 2.00 Reader 2 ∗ QV 39.52 ± 2.54 −2.17 .369 CARP 41.69 ± 2.17 Reader 3 † QV 54.84 ± 4.29 0.86 .851 CARP 53.98 ± 2.66 Reader 4 † QV 101.36 ± 6.33 −0.66 .917 CARP 102.02 ± 4.56 Reader 5 ‡ QV 107.59 ± 5.14 3.50 .588 CARP 104.09 ± 5.00 Reader 6 ‡ QV 90.23 ± 5.20 1.99 .730 CARP 88.24 ± 5.32
CARP, computed-aided reading protocol; QV, quadrant view.
Get Radiology Tree app to read full this article<
Get Radiology Tree app to read full this article<
Get Radiology Tree app to read full this article<
Get Radiology Tree app to read full this article<
κ Analysis
Get Radiology Tree app to read full this article<
Table 8
Kappa Analysis for Individual Readers
Reader QV Mode CARP Mode Agreement Expected Agreement κ (SE) Agreement Expected Agreement κ (SE) Reader 1 ∗ 76 68.98 0.22 (.06) 79.13 68.08 0.34 (0.05) Reader 2 ∗ 81.13 70.92 0.35 (0.04) 82.5 70.64 0.40 (0.04) Reader 3 † 79.75 68.36 0.35 (0.06) 78.5 64.2 0.39 (0.06) Reader 4 † 74.31 73.5 0.23 (0.06) 77.25 68.9 0.26 (0.06) Reader 5 ‡ 77.84 67.78 0.30 (0.06) 79.25 66.94 0.37 (0.06) Reader 6 ‡ 76.88 64.63 0.34 (0.06) 77.13 66.79 0.31 (0.05) Average 0.30 (95% CI, 0.2589–0.3559) 0.35 (95% CI, 0.3101–0.4011)
CARP, computed-aided reading protocol; CI, confidence interval; QV, quadrant view.
Get Radiology Tree app to read full this article<
Get Radiology Tree app to read full this article<
Get Radiology Tree app to read full this article<
Get Radiology Tree app to read full this article<
Sensitivity and Specificity Analysis for BI-RADS
Get Radiology Tree app to read full this article<
Table 9
Sensitivity and Specificity Estimates for the BI-RADS Scores
QV CARP Sensitivity estimate (combined over readers) (95% CI) 0.69 (0.66–0.74) 0.71 (0.66–0.75) Specificity estimate (combined over readers) (95% CI) 0.49 (0.41–0.55) 0.5 (0.42–0.57)
BI-RADS, Breast Imaging Reporting and Data System; CARP, computed-aided reading protocol; CI, confidence interval; QV, quadrant view.
Get Radiology Tree app to read full this article<
Discussion
Get Radiology Tree app to read full this article<
Get Radiology Tree app to read full this article<
Get Radiology Tree app to read full this article<
Get Radiology Tree app to read full this article<
Get Radiology Tree app to read full this article<
Get Radiology Tree app to read full this article<
Get Radiology Tree app to read full this article<
Get Radiology Tree app to read full this article<
Get Radiology Tree app to read full this article<
Conclusions
Get Radiology Tree app to read full this article<
Get Radiology Tree app to read full this article<
Appendix
Case Scoring Schema
Get Radiology Tree app to read full this article<
Get Radiology Tree app to read full this article<
Get Radiology Tree app to read full this article<
Get Radiology Tree app to read full this article<
Get Radiology Tree app to read full this article<
Get Radiology Tree app to read full this article<
Get Radiology Tree app to read full this article<
Get Radiology Tree app to read full this article<
Get Radiology Tree app to read full this article<
Get Radiology Tree app to read full this article<
Get Radiology Tree app to read full this article<
Get Radiology Tree app to read full this article<
Get Radiology Tree app to read full this article<
Get Radiology Tree app to read full this article<
Get Radiology Tree app to read full this article<
Get Radiology Tree app to read full this article<
Get Radiology Tree app to read full this article<
Get Radiology Tree app to read full this article<
References
1. Sahiner B., Chan H.P., Hadjiiski L.M., et. al.: Multi-modality CADx: ROC study of the effect on radiologists’ accuracy in characterizing breast masses on mammograms and 3D ultrasound images. Acad Radiol 2009; 16: pp. 810-818.
2. American College of Radiology: ACR Breast Imaging Reporting and Data System Atlas (BI-RADS Atlas).2003.American College of RadiologyReston, VA
3. Weigel S., Decker T., Korsching E., et. al.: Calcifications in digital mammographic screening: improvement of early detection of invasive breast cancers?. Radiology 2008; 255: pp. 738-745.
4. Uematsu T., Kasami M., Yuen S.: A cluster of microcalcifications: women with high risk for breast cancer versus other women. Breast Cancer (Tokyo) 2009; 16: pp. 307-314.
5. Haygood T.M., Wang J., Atkinson E.N., et. al.: Timed efficiency of interpretation of digital and film-screen screening mammograms. AJR Am J Roentgenol 2009; 192: pp. 216-220.
6. Nishikawa R.M., Acharyya S., Gatsonis C., et. al.: Comparison of soft-copy and hard-copy reading for full-field digital mammography. Radiology 2009; 251: pp. 41-49.
7. Berns E.A., Hendrick R.E., Solari M., et. al.: Digital and screen-film mammography: comparison of image acquisition and interpretation times. AJR Am J Roentgenol 2006; 187: pp. 38-41.
8. Giger M.L., Chan H.P., Boone J.: Anniversary paper: history and status of CAD and quantitative image analysis: the role of medical physics and AAPM. Med Phys 2008; 35: pp. 5799-5820.
9. Paquerault S., Hardy P.T., Wersto N., et. al.: Investigation of optimal use of computer-aided detection systems: the role of the “machine” in decision making process. Acad Radiol 2010; 17: pp. 1112-1121.
10. Zheng B., Chough D., Ronald P., et. al.: Actual versus intended Use of CAD systems in the clinical environment. Progr Biomed Optics Imaging 2006; 7:
11. Mello-Thoms C.: Perception of breast cancer: eye-position analysis of mammogram interpretation. Acad Radiol 2003; 10: pp. 4-12.
12. Landis J.R., Koch G.G.: The measurement of observer agreement for categorical data. Biometrics 1977; 33: pp. 159-174.
13. Obuchowski N.A.: ROC analysis. AJR Am J Roentgenol 2005; 184: pp. 364-372.
14. Dorfman D.D., Berbaum K.S., Metz C.E.: Receiver operating characteristic rating analysis. Generalization to the population of readers and patients with the jackknife method. Invest Radiol 1992; 27: pp. 723-731.
15. Jiang Y., Metz C.E.: BI-RADS data should not be used to estimate ROC curves. Radiology 2010; 256: pp. 29-31.
16. Crewson P.E.: Reader agreement studies. AJR Am J Roentgenol 2005; 184: pp. 1391-1397.
17. Pijnappel R.M., Peeters P.H., Hendriks J.H., et. al.: Reproducibility of mammographic classifications for non-palpable suspect lesions with microcalcifications. Br J Radiol 2004; 77: pp. 312-314.
18. Mendez A., Cabanillas F., Echenique M., et. al.: Mammographic features and correlation with biopsy findings using 11-gauge stereotactic vacuum-assisted breast biopsy (SVABB). Ann Oncol 2004; 15: pp. 450-454.
19. Mello-Thoms C., Nodine C.F., Weinstein S.P., et. al.: Unobtrusive method for monitoring visual attention during mammogram reading.Krupinski E.A.2000.SPIEBellingham, WA:pp. 100-163.
20. Leung J.W., Margolin F.R., Dee K.E., et. al.: Performance parameters for screening and diagnostic mammography in a community practice: are there differences between specialists and general radiologists?. AJR Am J Roentgenol 2007; 188: pp. 236-241.
21. Sickles E.A., Wolverton D.E., Dee K.E.: Performance parameters for screening and diagnostic mammography: specialist and general radiologists. Radiology 2002; 224: pp. 861-869.
22. Elmore J.G., Jackson S.L., Abraham L., et. al.: Variability in interpretive performance at screening mammography and radiologists’ characteristics associated with accuracy. Radiology 2009; 253: pp. 641-651.