
Rationale and Objectives
The aim of this study was to analyze the dominant factors affecting fatigue caused by soft-copy reading to identify a method for decreasing fatigue in clinical practice.
Materials and Methods
Two types of fatigue—fatigue in the central nervous system and subjective visual fatigue—were evaluated using a critical fusion frequency test and a questionnaire administered to 17 male radiologists before and after soft-copy reading. Reading-induced fatigue was assumed to be affected by 20 hypothetical factors associated with personal characteristics, time required for reading, content or amount of reading, and the reading environment. We used multiple linear regression analysis with a variable selection method to detect the best combination of factors capable of expressing variations in each of the measured fatigue values. The effects of the detected (dominant) factors on fatigue were also examined based on coefficients of the dominant factors in multiple regression models.
Results
Fatigue in the central nervous system decreased with a higher corrected visual acuity and a higher ambient illuminance in the reading room and was also affected by the type of monitor used. Visual fatigue was relieved when there was a larger difference in the brightness of the monitor and the surfaces surrounding the monitor and tended to be more severe when glasses rather than contact lenses were worn.
Conclusions
Increasing the ambient illuminance, using an appropriate type of monitor, improving the corrected visual acuity, and using contact lenses rather than eyeglasses could help decrease reading-induced fatigue in male radiologists.
The number of images produced in radiology departments has increased rapidly because of recent progress in the development of various imaging modalities, including a variety of magnetic resonance imaging sequences and multi–detector-row computed tomography (CT). Radiologists now have to read more images in less time ; as a result, most radiologists have reported severe reading-induced visual fatigue . Values representing visual fatigue and other types of fatigue in the central nervous system (CNS) have been reported to be significantly changed by the reading of digital images displayed on an electronic display device (soft-copy reading) . Visual fatigue arises from a near-viewing task or from tasks associated with large differences in brightness between the observed object and the surfaces surrounding the object ; CNS fatigue arises from mental work . Furthermore, according to Krupinski et al , a decline in diagnostic accuracy could be caused by a day of soft-copy reading. These reports imply that a reading environment with less fatigue will not only yield improved efficiency in clinical reading but also higher-quality medical care for patients. To create a reading environment with less fatigue, it is important to investigate the factors that affect fatigue. Previous studies have reported several factors that could affect reading-induced fatigue, such as experience image reading , the amount of sleep the previous night , age, sex, reading time, and frequency of breaks . However, no report has provided a quantitative comparison of the effects of various factors on reading-induced fatigue.
The purpose of this study was to analyze the dominant factors affecting fatigue caused by routine soft-copy reading by radiologists in order to identify effective countermeasures.
Materials and Methods
Participants
Get Radiology Tree app to read full this article<
Settings
Get Radiology Tree app to read full this article<
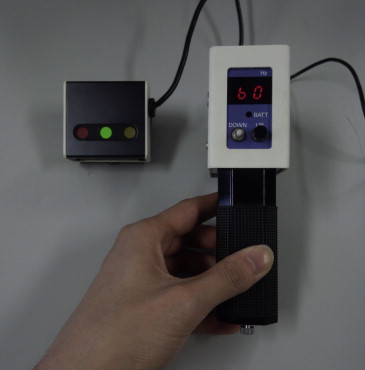
Indices of Fatigue
Get Radiology Tree app to read full this article<
CFFRR=CFFB−CFFACFFB⋅100(%). CFF
RR
=
CFF
B
−
CFF
A
CFF
B
·
100
(
%
)
.
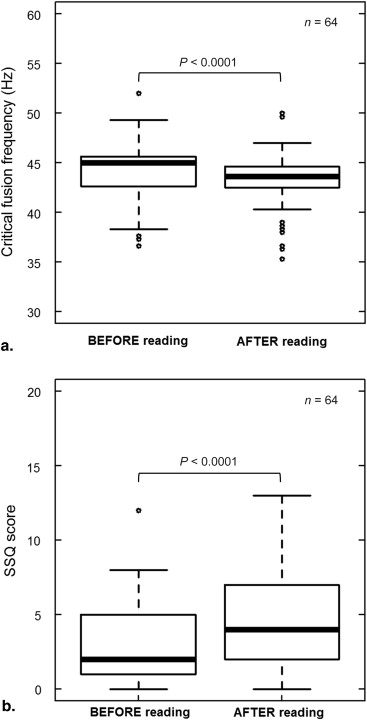
The CFF RR value will show a positive correlation with reading-induced fatigue in the CNS. In other words, when more fatigue in the CNS is caused by soft-copy reading, the CFF RR will be higher than 0%. In contrast, a value less than 0% indicates relief from fatigue.
Get Radiology Tree app to read full this article<
Get Radiology Tree app to read full this article<
SSQD=SSQA−SSQB. SSQ
D
=
SSQ
A
−
SSQ
B
.
The SSQ D value will show a positive correlation with visual fatigue caused by reading. In other words, when soft-copy reading causes more visual fatigue, the SSQ D will be higher than 0. A value less than 0 indicates relief from fatigue.
Table 1
The Oculomotor Strain Subscale From the Simulator Sickness Questionnaire
Data from References 11, 12, and 17.
Symptoms None Slight Moderate Severe General discomfort□□□□ Fatigue□□□□ Headache□□□□ Eyestrain□□□□ Difficulty focusing□□□□ Difficulty concentrating□□□□ Blurred vision□□□□
Get Radiology Tree app to read full this article<
Hypothetical Factors
Get Radiology Tree app to read full this article<
Table 2
Twenty Hypothetical Factors That Could Affect Reading-Induced Fatigue
Numerical Factors ∗ Categorical Factors †
(Included Categories) Personal 1. Age of radiologist
2. Years of experience in reading
3. Corrected visual acuity ‖
4. Amount of sleep the previous night 16. Vision correction ‖
(with glasses/with contact lenses/without any correction) Time 5. Reading time ‡
6. Average time to interpret a case ¶ Contents of reading 7. No. of images §
8. No. of series of images §
9. No. of cases §
10. Average No. of images/case §
11. Average No. of images/series §
12. Average No. of images/series/case §
13. Average No. of series/case § 17. Subspecialty of reading
(neuroradiology/chest/abdomen/nuclear medicine) Environment 14. Ambient illuminance (lux) ‖
15. Δ L adp ‖ 18. Time of day
(morning/afternoon)
19. Day of week (Monday to Friday)
20. Type of LCD ‖
(2-MP color LCD with L max of 200 or
3-MP monochrome LCD with L max of 450)
Δ L adp , difference in the perceived brightness between an LCD and the surfaces surrounding the LCD based on the diameter of the pupil ; LCD, liquid-crystal display; L max , maximum luminance (cd/m 2 ) recommended by the manufacturer; MP, megapixel.
Get Radiology Tree app to read full this article<
Get Radiology Tree app to read full this article<
Get Radiology Tree app to read full this article<
Get Radiology Tree app to read full this article<
Get Radiology Tree app to read full this article<
Get Radiology Tree app to read full this article<
Get Radiology Tree app to read full this article<
Procedure for Evaluation of Fatigue
Get Radiology Tree app to read full this article<
Statistical Analyses
Get Radiology Tree app to read full this article<
Get Radiology Tree app to read full this article<
Results
Get Radiology Tree app to read full this article<
Get Radiology Tree app to read full this article<
Get Radiology Tree app to read full this article<
Table 3
The Dominant Factors and Their Effects On Fatigue In the Central Nervous System ( CFF RR )
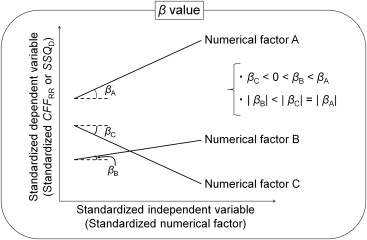
Numerical Factors ∗ β_P_ -Value ‡ Average No. of images/series/case 1.348 <.005 Average No. of series/case 1.099 <.005 Average No. of images/case −1.096 <.005 Corrected visual acuity § −0.683 <.005 Average time to interpret a case −0.679 <.05 Average No. of images/series 0.618 <.05 Years of experience in reading −0.571 .057 Age of radiologist 0.520 .082 Reading time 0.359 <.05 Ambient illuminance (lux) § −0.245 .137
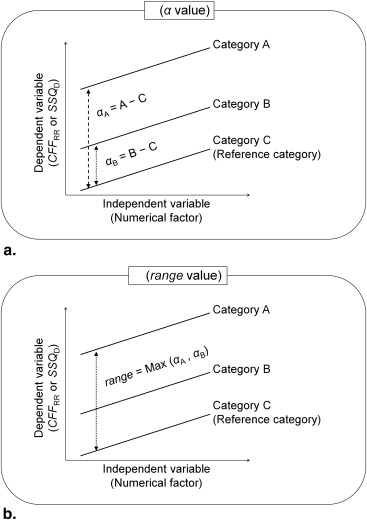
Categorical factors † ( range ) Categories α_P_ -Value ‡ Subspecialty of reading (7.647) Neuroradiology 7.647 <0.05 Chest 7.402 <.05 Abdomen 5.641 <.05cf . Nuclear medicine 0 — Type of LCD § (1.755) 3-MP monochrome with L max of 450 1.755 .105cf . 2-MP color with L max of 200 0 —
α, the difference in the fatigue data between a category and the reference category (indicated by “ cf .”) in the same categorical factor (a higher α value means a larger effect on the fatigue compared with the reference category); β, the slope of the regression line between fatigue and a factor standardized based on the histogram, under certain conditions of the other factors (a higher absolute β value means a larger effect on fatigue); CFF RR , the ratio of the decrease in critical fusion frequency (CFF) by reading relative to the CFF before the reading; LCD, liquid-crystal display; L max , maximum luminance (cd/m 2 ); MP, megapixel; range , the difference between the maximal and minimal α values in the same categorical factor (a higher range value means a larger effect on the fatigue compared with the other factors).
Get Radiology Tree app to read full this article<
Get Radiology Tree app to read full this article<
Get Radiology Tree app to read full this article<
Get Radiology Tree app to read full this article<
Table 4
The Dominant Factors and Their Effects On Visual Fatigue ( SSQ D )
Numerical factors ∗ β_P_ -Value ‡ Average time to interpret a case 0.950 <.005 Average No. of series/case −0.899 <.005 Average No. of images/series 0.343 <.05 Δ L adp § −0.293 <.05 Reading time 0.199 .130
Categorical factors † ( range ) Categories α_P_ -Value ‡ Vision correction § (2.619) With glasses 2.619 <.005 With contact lenses 1.325 .087cf . No correction 0 — Subspecialty of reading (1.578) Chest 1.578 <.05 Neuroradiology 0.101 .873 Nuclear medicine 0.008 .991cf . Abdomen 0 — Time of day (1.252) Afternoon 1.252 <.005cf . Morning 0 —
α, the difference in the fatigue data between a category and the reference category (indicated by “ cf .”) in the same categorical factor (a higher α value means a larger effect on the fatigue compared with the reference category); β, the slope of the regression line between fatigue and a factor standardized based on the histogram, under certain conditions of the other factors (a higher absolute β value means a larger effect on fatigue); Δ L adp , difference in the perceived brightness between a liquid-crystal display and the surfaces surrounding the display based on the diameter of the pupil (14); range , the difference between the maximal and minimal α values in the same categorical factor (a higher range value means a larger effect on the fatigue compared with the other factors); SSQ D , the difference in the score for the Simulator Sickness Questionnaire before and after the reading.
Get Radiology Tree app to read full this article<
Get Radiology Tree app to read full this article<
Get Radiology Tree app to read full this article<
Get Radiology Tree app to read full this article<
Get Radiology Tree app to read full this article<
Dominant Factors for Fatigue in the CNS
Get Radiology Tree app to read full this article<
Get Radiology Tree app to read full this article<
Get Radiology Tree app to read full this article<
Dominant Factors for Visual Fatigue ( Table 4 )
Get Radiology Tree app to read full this article<
Get Radiology Tree app to read full this article<
Get Radiology Tree app to read full this article<
Discussion
Dominant Factors Associated With Fatigue in the CNS
Get Radiology Tree app to read full this article<
Get Radiology Tree app to read full this article<
Dominant Factors Associated With Visual Fatigue
Get Radiology Tree app to read full this article<
Get Radiology Tree app to read full this article<
Limitations
Get Radiology Tree app to read full this article<
Conclusions
Get Radiology Tree app to read full this article<
Acknowledgments
Get Radiology Tree app to read full this article<
Get Radiology Tree app to read full this article<
Get Radiology Tree app to read full this article<
References
1. Bhargavan M., Sunshine J.H.: Utilization of radiology services in the United States: levels and trends in modalities, regions, and populations. Radiology 2005; 234: pp. 824-832.
2. DiPiro P.J., vanSonnenberg E., Tumeh S.S., et. al.: Volume and impact of second-opinion consultations by radiologists at a tertiary care cancer center: data. Acad Radiol 2002; 9: pp. 1430-1433.
3. Ebbert T.L., Meghea C., Iturbe S., et. al.: The state of teleradiology in 2003 and changes since 1999. AJR Am J Roentgenol 2007; 188: pp. W103-W112.
4. Sunshine J.H., Maynard C.D.: Update on the diagnostic radiology employment market: findings through 2007-2008. J Am Coll Radiol 2008; 5: pp. 827-833.
5. Lu Y., Zhao S., Chu P.W., et. al.: An update survey of academic radiologists’ clinical productivity. J Am Coll Radiol 2008; 5: pp. 817-826.
6. Nakajima Y., Yamada K., Imamura K., et. al.: Radiologist supply and workload: international comparison—Working Group of Japanese College of Radiology. Radiat Med 2008; 26: pp. 455-465.
7. Mukerji N., Wallace D., Mitra D.: Audit of the change in the on-call practices in neuroradiology and factors affecting it. BMC Med Imaging 2006; 6: pp. 13.
8. Meghea C., Sunshine J.H.: Determinants of radiologists’ desired workloads. J Am Coll Radiol 2007; 4: pp. 166-170.
9. Vertinsky T., Forster B.: Prevalence of eye strain among radiologists: influence on viewing variables on symptoms. AJR Am J Roentgenol 2005; 184: pp. 681-686.
10. Krupinski E.A., Berbaum K.S.: Measurement of visual strain in radiology. Acad Radiol 2009; 16: pp. 947-950.
11. Krupinski E.A., Berbaum K.S., Caldwell R.T., et. al.: Long radiology workdays reduce detection and accommodation accuracy. J Am Coll Radiol 2010; 7: pp. 698-704.
12. Krupinski E.A., Berbaum K.S., Caldwell R.T., et. al.: Do long radiology workdays affect nodule detection in dynamic CT interpretation?. J Am Coll Radiol 2012; 9: pp. 191-198.
13. Maeda E., Yoshikawa T., Hayashi N., et. al.: Radiology reading-caused fatigue and measurement of eye strain with critical flicker fusion frequency. Jpn J Radiol 2011; 29: pp. 483-487.
14. Chawla A.S., Samei E.: Ambient illumination revisited: a new adaptation-based approach for optimizing medical imaging reading environments. Med Phys 2007; 34: pp. 81-90.
15. Simonson E., Brožek J.: Flicker fusion frequency: background and applications. Physiol Rev 1952; 32: pp. 349-378.
16. Murata K., Araki S., Kawakami N., et. al.: Central nervous system effects and visual fatigue in VDT workers. Int Arch Occup Environ Health 1991; 63: pp. 109-113.
17. Kennedy R.S., Lane N.E., Berbaum K.S., et. al.: Simulator Sickness Questionnaire: an enhanced method for quantifying simulator sickness. Int J Aviat Psych 1993; 3: pp. 203-220.
18. Yamashita T., Yamashita K., Kamimura R.: A stepwise AIC method for variable selection in linear regression. Commun Stat Theory Methods 2007; 36: pp. 2395-2403.
19. Rawlings J.O., Pantula S.G., Dickey D.A.: Applied regression analysis: a research tool.2nd ed.1998.Springer-Verlag New YorkNew York, NY
20. Brennan P.C., McEntee M., Evanoff M., et. al.: Ambient lighting: effect of illumination on soft-copy viewing of radiographs of the wrist. AJR Am J Roentgenol 2007; 188: pp. W177-W180.
21. Scharitzer M., Prokop M., Weber M., et. al.: Detectability of catheters on bedside chest radiographs: comparison between liquid crystal display and high-resolution cathode-ray tube monitors. Radiology 2005; 234: pp. 611-616.
22. Pollard B.J., Samei E., Chawla A.S., et. al.: The influence of increased ambient lighting on mass detection in mammograms. Acad Radiol 2009; 16: pp. 299-304.
23. Pollard B.J., Samei E., Chawla A.S., et. al.: The effects of ambient lighting in chest radiology reading rooms. J Digit Imaging 2012; 25: pp. 520-526.
24. Takahashi K., Sueoka M., Yoon Y., et. al.: Detectability of a lung nodule displayed on a liquid-crystal display monitor with different maximum luminance settings. Radiol Phys Technol 2010; 3: pp. 10-15.
25. Takahashi K., Morishita J., Hiwasa T., et. al.: Comparison of detectability of a simple object with low contrast displayed on a high-brightness color LCD and a monochrome LCD. Radiol Phys Technol 2010; 3: pp. 178-184.
26. Geijer H., Geijer M., Forsberg L., et. al.: Comparison of color LCD and medical-grade monochrome LCD displays in diagnostic radiology. J Digit Imaging 2007; 20: pp. 114-121.
27. Kamitani T., Yabuuchi H., Soeda H., et. al.: Detection of masses and microcalcifications of breast cancer on digital mammograms: comparison among hard-copy film, 3-megapixel liquid crystal display (LCD) monitors and 5-megapixel LCD monitors: an observer performance study. Eur Radiol 2007; 17: pp. 1365-1371.
28. Yin J., Guo Q., Zhang W., et. al.: Effect of greyscale liquid crystal displays of different resolutions on observer performance during detection of small solitary pulmonary nodules. Br J Radiol 2012; 85: pp. e549-e555.
29. Siddiqui K.M., Chia S., Knight N., et. al.: Design and ergonomic considerations for the filmless environment. J Am Coll Radiol 2006; 3: pp. 456-467.