
Rationale and Objectives
We sought to examine heart rate and heart rate variability during cardiac computed tomography (CT).
Materials and Methods
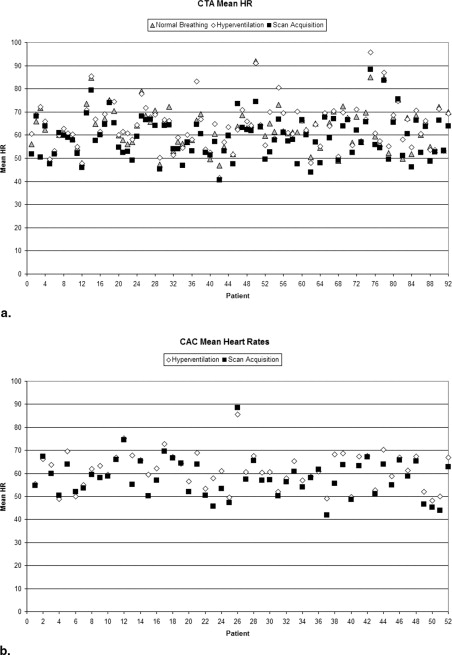
Ninety patients (59.0 ± 13.5 years) underwent coronary CT angiography (CTA), with 52 patients also undergoing coronary artery calcium scanning (CAC). Forty-two patients with heart rate greater than 70 bpm were pretreated with oral β-blockers (in five patients, use of β-blocker was not known). Sixty-four patients were given sublingual nitroglycerin. Mean heart rate and percentage of beats outside a ±5 bpm region about the mean were compared between baseline (free breathing), prescan hyperventilation, and scan acquisition (breath-hold).
Results
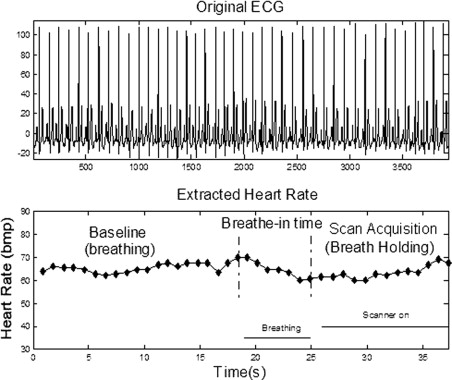
Mean scan acquisition time was 13.1 ± 1.5 seconds for CAC scanning and 14.2 ± 2.9 seconds for coronary CTA. Mean heart rate during scan acquisition was significantly lower than at baseline (CAC 58.2 ± 8.5 bpm; CTA 59.2 ± 8.8 bpm; baseline 62.8 ± 8.9 bpm; P < .001). The percentage of beats outside a ±5 bpm about the mean were not different between baseline and CTA scanning (3.5% versus 3.3%, P = .87). The injection of contrast had no significant effect on heart rate (58.2 bpm versus 59.2 bpm, P = .24) or percentage of beats outside a ±5 bpm about the mean (3.0% versus 3.3%, P = .64). No significant difference was found between gender and age groups ( P > .05).
Conclusions
Breath-holding during cardiac CT scan acquisition significantly lowers the mean heart rate by approximately 4 bpm, but heart rate variability is the same or less compared with normal breathing.
The patient’s heart rate and heart rate variation play a very important role in cardiac computed tomography (CT) examinations, e.g., CT coronary artery calcium (CAC) and coronary CT angiography (CTA) ( ), due to the limit of temporal resolution available in current CT systems (for single segment image reconstruction, this is as fast as 0.165 second using single-source CT or 0.85 second using dual-source CT) ( ). A study to evaluate the effect of heart rate on the quality of CT angiography exams obtained with 16-channel multidetector row CT (MDCT) demonstrated a significant negative correlation between mean heart rate and image quality ( ). Besides mean heart rate, significant variations in heart rate (e.g., from 41 to 100 bpm [beats per minute] during scanning, equivalent to an R-R interval ranging from 1463 to 600 msec), result in misregistration of ECG-gated data and severe discontinuities in the reconstructed cardiac images ( Fig. 1 ). Thus, most vendors offer an ECG editor that allows the operator to modify the synchronization and thereby reduce artifacts caused by short-term variations of the patient’s heart rate ( ).
 Open full size image
Figure 1
An example of an erratic heart rate and the resultant CT images in a patient with atrial fibrillation or other arrhythmia. The heart rate changed from 40 bpm to 100 bpm during CT scan acquisitions. This variation in the heart rate resulted in significant discontinuities in the CT images ( arrows ).
Get Radiology Tree app to read full this article<
Get Radiology Tree app to read full this article<
Materials and methods
Get Radiology Tree app to read full this article<
Data Acquisition
Get Radiology Tree app to read full this article<
Inclusion Criteria
Get Radiology Tree app to read full this article<
Exclusion Criteria
Get Radiology Tree app to read full this article<
Scanning Protocol
Get Radiology Tree app to read full this article<
Get Radiology Tree app to read full this article<
Get Radiology Tree app to read full this article<
Data Analysis
Get Radiology Tree app to read full this article<
Get Radiology Tree app to read full this article<
Get Radiology Tree app to read full this article<
Get Radiology Tree app to read full this article<
Statistical Analysis
Get Radiology Tree app to read full this article<
Get Radiology Tree app to read full this article<
Get Radiology Tree app to read full this article<
Get Radiology Tree app to read full this article<
Results
Get Radiology Tree app to read full this article<
Get Radiology Tree app to read full this article<
Get Radiology Tree app to read full this article<
Table 1
Mean heart rate and percentage of heartbeats with a variable rate ⁎ for each of the five time periods shown
CAC (n = 52) CTA (n = 90) Parameter Baseline Hyperventilation Scan Acquisition Hyperventilation Scan Acquisition Heart rate (bpm; mean ± SD) 62.8 ± 8.9 61.4 ± 7.8 58.2 ± 8.5 63.9 ± 9.5 59.2 ± 8.8 Heart rate range (bpm) 46.9–92.0 48.2–85.6 41.9–88.4 41.6–95.7 40.6–88.3 Percentage of beats with variable heart rate ⁎ 3.5 ± 11.0 12.7 ± 22.3 3.0 ± 8.4 14.5 ± 24.8 3.3 ± 10.2
Get Radiology Tree app to read full this article<
Table 2
Comparison of mean heart rates during five time periods
Time Period 1 Time Period 2 No. of Patients Mean Difference (SD) in Heart Rates (Across All Patients) ⁎ Significance (Paired t -Test) CTA baseline breathing CTA hyperventilation 90 −1.2 (3.3) <.001 CTA baseline breathing CTA scanning 90 3.6 (4.4) <.001 CTA hyperventilation CTA scanning 90 4.8 (5.0) <.001 CAC scanning CTA scanning 52 −0.9 (5.1) .24 CAC hyperventilation CAC scanning 52 3.2 (3.4) <.001
Get Radiology Tree app to read full this article<
Get Radiology Tree app to read full this article<
Get Radiology Tree app to read full this article<
Table 3
Comparison of heart rate variability during time periods
Time Period 1 Time Period 2 No. of Patients Mean Difference (SD) in Percentage of Variable Beats (Across All Patients) ⁎ Significance (Paired t -Test) CTA baseline breathing CTA hyperventilation 90 −11.0 (25.3) <.001 CTA baseline breathing CTA scanning 90 0.3 (14.5) .87 CAC scanning CTA scanning 52 −1.0 (15.4) .64 CAC hyperventilation CTA hyperventilation 52 −2.3 (23.2) .47 CAC scanning CTA scanning 52 −1.0 (15.4) .64 CAC hyperventilation CAC scanning 52 9.7 (23.5) .004
The percentage of beats more than 5 bpm different from the mean heart rate were compared for each patient between the time periods shown.
Get Radiology Tree app to read full this article<
Get Radiology Tree app to read full this article<
Get Radiology Tree app to read full this article<
Table 4
Heart rate and heart rate variation during CT scan acquisition by age, gender, β-blockade, and nitroglycerin administration
Age (yr) Gender β-Blockade † Nitroglycerin Parameter <63.6 (n = 45) >63.6 (n = 45) Male (n = 52) Female (n = 38) With (n = 42) Without (n = 43) With (n = 64) Without (n = 26) Heart rate (bpm) Mean ± SD 59.8 ± 10.2 58.5 ± 7.2 59.4 ± 10.2 58.8 ± 6.6 59.2 ± 7.6 59.0 ± 10.2 58.9 ± 18.8 59.9 ± 9.4 Range 40.6–88.3 46.0–75.5 40.6–88.3 46.9–74.4 45.3–79.3 40.6–88.3 40.6–88.3 46.0–75.5 Percentage beats with variable heart rate ⁎ Mean ± SD 3.7 ± 9.9 2.9 ± 10.6 4.3 ± 13.0 1.9 ± 3.8 2.9 ± 8.3 3.7 ± 12.2 2.8 ± 8.6 5.0 ± 14.8 Range 0 –50 0–68 0–68 0–13 0–50 0–68 0–50 0–68
Get Radiology Tree app to read full this article<
Get Radiology Tree app to read full this article<
Get Radiology Tree app to read full this article<
Get Radiology Tree app to read full this article<
Get Radiology Tree app to read full this article<
Get Radiology Tree app to read full this article<
Discussion
Get Radiology Tree app to read full this article<
Get Radiology Tree app to read full this article<
Get Radiology Tree app to read full this article<
Get Radiology Tree app to read full this article<
Get Radiology Tree app to read full this article<
Conclusions
Get Radiology Tree app to read full this article<
Get Radiology Tree app to read full this article<
References
1. Lu B., Zhuang N., Mao S.S., Child J., Carson S., Budoff M.J.: Baseline heart rate-adjusted electrocardiographic triggering for coronary artery electron-beam CT angiography. Radiology 2004; 233: pp. 590-595.
2. Lu B., Mao S.S., Zhuang N., et. al.: Coronary artery motion during the cardiac cycle and optimal ECG triggering for coronary artery imaging. Invest Radiol 2001; 36: pp. 250-256.
3. Boll D.T., Gilkeson R.C., Merkle E.M., Fleiter T.R., Duerk J.L., Lewin J.S.: Functional cardiac CT and MR: Effects of heart rate and software applications on measurement validity. J Thorac Imaging 2005; 20: pp. 10-16.
4. Hong C., Becker C.R., Huber A., et. al.: ECG-gated reconstructed multi–detector row CT coronary angiography: Effect of varying trigger delay on image quality. Radiology 2001; 220: pp. 712-717.
5. Flohr T.G., Stierstorfer K., Ulzheimer S., Bruder H., Primak A.N., McCollough C.H.: Image reconstruction and image quality evaluation for a 64-slice CT scanner with z-flying focal spot. Med Phys 2005; 32: pp. 2536-2547.
6. Flohr T.G., McCollough C.H., Bruder H., et. al.: First performance evaluation of a dual-source CT (DSCT) system. Eur Radiol 2006; 16: pp. 256-268.
7. Hoffmann M.H., Shi H., Manzke R., et. al.: Noninvasive coronary angiography with 16-detector row CT: Effect of heart rate. Radiology 2005; 234: pp. 86-97.
8. Cademartiri F., Mollet N.R., Runza G., et. al.: Improving diagnostic accuracy of MDCT coronary angiography in patients with mild heart rhythm irregularities using ecg editing. AJR Am J Roentgenol 2006; 186: pp. 634-638.
9. Mollet N.R., Cademartiri F., Nieman K., et. al.: Multislice spiral computed tomography coronary angiography in patients with stable angina pectoris. J Am Coll Cardiol 2004; 43: pp. 2265-2270.
10. Garcia M.J.: Tips and tricks to optimize image quality.2005. Boston, Massachusetts
11. Song S.H., Lee W.K., Chung Y.A., Hong S.K.: Mechanism of apneic bradycardia in man. J Appl Physiol 1969; 27: pp. 323-327.