
Rationale and Objectives
The objective of this study was to investigate the contrast-enhanced ultrasound (CEUS) characteristics of tumor angiogenesis in mouse mammary cancer.
Materials and Methods
Twenty-four mice were examined with ultrasound and CEUS at 2–12 days after implantation. Four to five mice were assessed daily, and one to three mice were then sacrificed for histology. All of the histologic slides were reviewed and correlated with CEUS findings.
Results
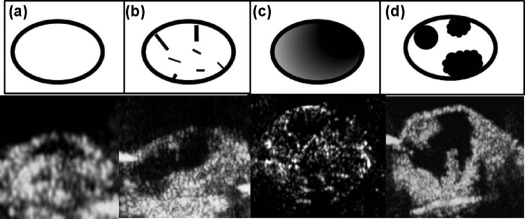
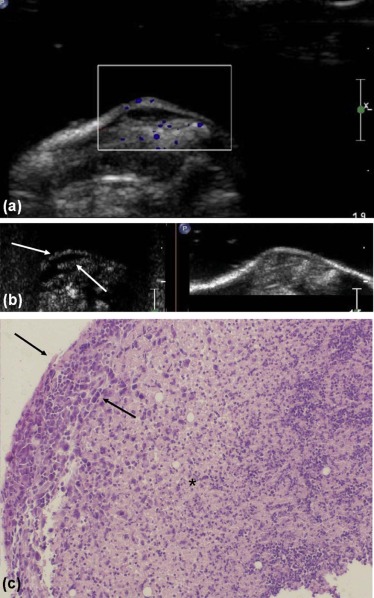
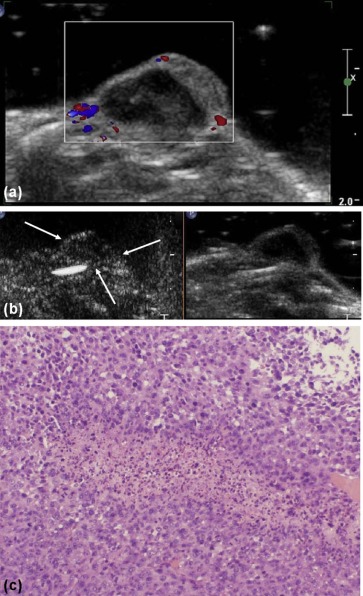
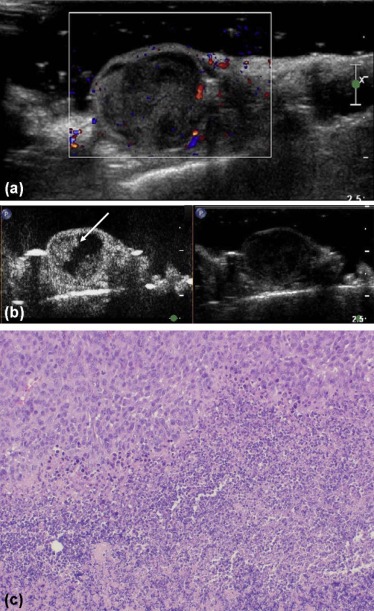
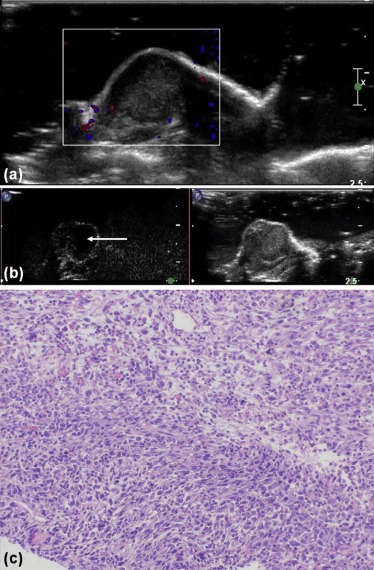
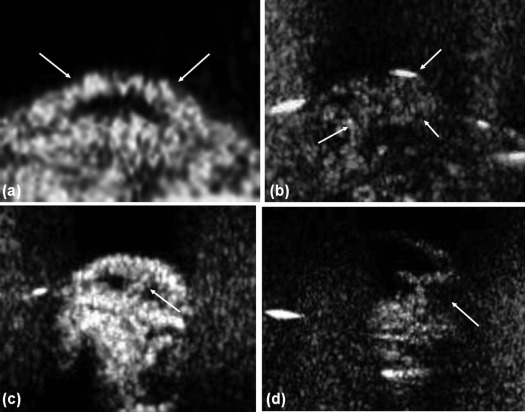
A total of 46 cases of ultrasound examination had been performed in 24 mice. The mice were classified into three groups according to the tumor growth: group 1 (2~6 days after implantation, n = 20 cases), group 2 (7~9 days after implantation, n = 15 cases), and group 3 (10~12 days after implantation, n = 11 cases). In group 1, all tumors presented as a homogeneous hypoechoic mass with no color Doppler signals. However, three CEUS patterns were observed: 14 tumors presented as type I (peripheral ring enhancement with no enhancement within the tumor), 4 tumors presented as type II (peripheral ring enhancement with deep penetration), and 2 tumors presented as type III (homogeneous or heterogeneous enhancement in the entire tumor). In group 2, there was only difference in the echo (heterogeneous or not) and color Doppler signals (with or without) among the tumors in conventional ultrasound, but four CEUS patterns were observed and most presented as type III (53.3%, 8/15). In group 3, most tumors presented as a heterogeneous solid mass (81.8%, 9/11) with color signals (100%, 11/11), and almost all tumors presented as enhancement of type IV (peripheral ring enhancement with focal nodular enhancement) (90.9%, 10/11).The histologic results showed that the enhanced areas mainly corresponded to tumor cells, large tortuous vessels, and an inflammatory cell infiltrate. Nonenhanced areas corresponded to large areas of necrotic tissue or tumor cells, which arranged loosely with the small zone of necrosis.
Conclusions
CEUS could image the progression of vessel formation. Moreover, most importantly, CEUS is able to identify angiogenesis before the change of tumor color Doppler, and presents different enhanced patterns at different tumor growth times, which corresponded to tumor histologic features.
Breast cancer angiogenesis plays an essential role in tumor growth, invasion, and metastasis. The assessment and follow-up of the angiogenic process are important for breast cancer diagnosis and for evaluating therapeutic efficacy . Compared to a genetically engineered mouse model and a dimethylbenz(a)anthracene-induced animal model, a transplanted mouse model has the characteristics of stable tumor incidence rate and reproducibility, which made it suitable for tumor study. Therefore, transplanted mouse models are widely used in the field of pharmaceutical development and research, such as the field of targeted tumor therapies . Therefore, a kind of effective imaging method to assess dynamic changes in tumor angiogenesis in vivo is urgently needed.
The recent developments of microbubble contrast agents and the ability to use microvascular imaging techniques (MVIs) have improved the detection of characteristic neovascular morphologic features by depicting microvessel perfusion . Furthermore, recent studies of breast tumors have indicated a significant correlation between direct pathologic vascularity assessments, such as the microvessel density (MVD), and postcontrast ultrasonic vascularity measurements, particularly for vessels 20–39 µm in diameter ( r 2 = 0.16; P = .01) . This correlation suggests that contrast-enhanced ultrasound (CEUS) may provide a noninvasive measure of breast tumor neovascularity. In the present study, we establish a mouse mammary cancer model and monitor the tumor size and blood dynamics characteristics in different growth time points with ultrasound and CEUS to assess tumor angiogenesis dynamics in vivo.
Materials and Methods
Mice Mammary Cancer Samples
Get Radiology Tree app to read full this article<
Get Radiology Tree app to read full this article<
Acquisition of Ultrasound and Pathology Data
Get Radiology Tree app to read full this article<
Get Radiology Tree app to read full this article<
Get Radiology Tree app to read full this article<
Image Analysis
Get Radiology Tree app to read full this article<
Get Radiology Tree app to read full this article<
Get Radiology Tree app to read full this article<
Histology
Get Radiology Tree app to read full this article<
Statistical Analysis
Get Radiology Tree app to read full this article<
Results
Mouse Mammary Cancer Model
Get Radiology Tree app to read full this article<
TABLE 1
Mean Tumor Sizes at 2–12 days After Implantation ( n = 46 Cases)
Tumor Size Time After Implantation (d) 2 d 3 d 4 d 5 d 6 d 7 d 8 d 9 d 10 d 11 d 12 d ( n = 4) ( n = 4) ( n = 4) ( n = 4) ( n = 4) ( n = 5) ( n = 5) ( n = 5) ( n = 4) ( n = 4) ( n = 3) Width (cm) 0.45 ± 0.13 0.52 ± 0.13 0.53 ± 0.06 0.60 ± 0.08 0.60 ± 0.10 1.4 ± 0.26 1.33 ± 0.12 1.33 ± 0.50 1.67 ± 0.31 1.77 ± 0.21 1.63 ± 0.23 Depth (cm) 0.40 ± 0.08 0.48 ± 0.08 0.13 ± 0.06 0.50 ± 0.08 0.23 ± 0.06 1.03 ± 0.15 0.67 ± 0.15 0.80 ± 0.40 1.17 ± 0.15 1.20 ± 0.10 1.12 ± 0.06 Volume (cm 3 ) 0.01 0.03 0.04 0.03 0.04 0.31 0.2 0.82 1.06 1.2 1.03
Get Radiology Tree app to read full this article<
Get Radiology Tree app to read full this article<
Conventional Ultrasound Manifestations of Mouse Mammary Cancer
Get Radiology Tree app to read full this article<
TABLE 2
Conventional Ultrasound for 46 Cases of Mouse Mammary Cancer
Conventional Ultrasound Days After Implantation 2–6 d ( n = 20) 7–9 d ( n = 15) 10-12 d ( n = 11) Echogenicity Hypoechoic 20 (100%) 15 (100%) 11 (100%) Isoechoic 0 0 0 Hyperechoic 0 0 0 Distribution of the echo \* Homogeneous 20 (100%) 11 (73.3%) 2 (18.2%) Heterogeneous 0 4 (26.7%) 9 (81.8%) Shape Regular 20 (100%) 15 (100%) 9 (81.8%) Irregular 0 0 2 (18.2%) Margin Defined 14 (70%) 11 (73.3%) 11 (100%) Ill-defined 6 (30%) 4 (26.7%) 0 CDFI \* Without 20 (100%) 8 (53.3%) 0 With 0 7 (46.7%) 11 (100%)
CDFI, Color Doppler Flow Imaging.
Get Radiology Tree app to read full this article<
Get Radiology Tree app to read full this article<
Get Radiology Tree app to read full this article<
Contrast-enhanced Patterns of Mouse Mammary Cancer
Get Radiology Tree app to read full this article<
TABLE 3
Contrast-enhanced Patterns of Ultrasound for 46 Cases of Mouse Mammary Cancer
Days After Implantation Contrast-enhanced Patterns of Ultrasound_P_ Value Type I Type II Type III Type IV 2–6 d ( n = 20) 14 (70%) 4 (6.7%) 2 (10%) 0 <.01 7–9 d ( n = 15) 1 (6.7%) 4 (26.7%) 8 (53.3%) 2 (13.3%) 10–12 d ( n = 11) 0 0 1 (9.1%) 10 (90.9%)
Get Radiology Tree app to read full this article<
Get Radiology Tree app to read full this article<
CEUS Performance of Mice Mammary Cancer at 2–12 Days After Implantation
Get Radiology Tree app to read full this article<
TABLE 4
Consecutive Contrast-enhanced Ultrasound Pattern of Mice Mammary Cancer from 2 to 12 days After Implantation ( n = 13)
No. Time After Implantation (d) 2 d 3 d 4 d 5 d 6 d 7 d 8 d 9 d 10 d 11 d 12 d A1 I I A3 I I II A4 I I III A6 II III III A7 II III III A8 I I A9 I II IV B2 I III IV IV B3 I II IV B4 I I B7 III IV IV B8 III IV IV B9 IV IV
Get Radiology Tree app to read full this article<
Histology Analysis
Get Radiology Tree app to read full this article<
Get Radiology Tree app to read full this article<
Get Radiology Tree app to read full this article<
Get Radiology Tree app to read full this article<
Discussion
Get Radiology Tree app to read full this article<
Get Radiology Tree app to read full this article<
Get Radiology Tree app to read full this article<
Get Radiology Tree app to read full this article<
Get Radiology Tree app to read full this article<
Get Radiology Tree app to read full this article<
Conclusions
Get Radiology Tree app to read full this article<
Acknowledgments
Get Radiology Tree app to read full this article<
Get Radiology Tree app to read full this article<
References
1. Holmgren L., O’Reilly M.S., Folkman J.: Dormancy of micrometastases: balanced proliferation and apoptosis in the presence of angiogenesis suppression. Nat Med 1995; 1: pp. 149-153.
2. Weidner N., Carroll P.R., Flax J., et. al.: Tumor angiogenesis correlates with metastasis in invasive prostate carcinoma. Am J Pathol 1993; 143: pp. 401-409.
3. Poon W., Zhang X., Bekah D., et. al.: Targeting B16 tumors in vivo with peptide-conjugated gold nanoparticles. Nanotechnology 2015; 26: pp. 285101.
4. Alexandrova E.M., Yallowitz A.R., Li D., et. al.: Improving survival by exploiting tumour dependence on stabilized mutant p53 for treatment. Nature 2015; 523: pp. 352-356.
5. Jiang Y.X., Liu H., Liu J.B., et. al.: Breast tumor size assessment: comparison of conventional and contrast-enhanced ultrasound. Ultrasound Med Biol 2007; 33: pp. 1873-1881.
6. Forsberg F., Kuruvilla B., Pascua M.B., et. al.: Comparing contrast-enhanced color flow imaging and pathological measures of breast lesion vascularity. Ultrasound Med Biol 2008; 34: pp. 1365-1372.
7. Lucidarme O., Nguyen T., Kono Y., et. al.: Angiogenesis model for ultrasound contrast research: exploratory study. Acad Radiol 2004; 11: pp. 4-12.
8. O’Reilly M.S., Holmgren L., Shing Y.: Angiostatin: a novel angiogenesis inhibitor that mediates the suppression of metastases by a Lewis lung carcinoma. Cell 1994; 79: pp. 315-328.
9. Ferrara K.F., Merritt C.R.B., Burns P.N., et. al.: Evaluation of tumor angiogenesis with US: imaging, Doppler and contrast agents. Acad Radiol 2000; 7: pp. 824-839.
10. Liu H., Jiang Y.X., Liu J.B., et. al.: Contrast-enhanced breast ultrasonography: imaging features with histopathologic correlation. J Ultrasound Med 2009; 28: pp. 911-920.
11. Cha J.H., Moon W.K., Cho N., et. al.: Differentiation of benign from malignant solid breast masses: conventional US versus spatial compound imaging 1. Radiology 2005; 237: pp. 841-846.
12. Xiao X., Dong L., Jiang Q., et. al.: Incorporating contrast-enhanced ultrasound into the BI-RADS scoring system improves accuracy in breast tumor diagnosis: a preliminary study in China. Ultrasound Med Biol 2016; 42: pp. 2630-2638.
13. Wang Y., Fan W., Zhao S., et. al.: Qualitative, quantitative and combination score systems in differential diagnosis of breast lesions by contrast-enhanced ultrasound. Eur J Radiol 2016; 85: pp. 48-54.
14. Ohlerth S., Wergin M., Bley C.R., et. al.: Correlation of quantified contrast-enhanced power Doppler ultrasonography with immunofluorescent analysis of microvessel density in spontaneous canine tumours. Vet J 2010; 183: pp. 58-62.
15. Chen J.J.1., Chen J.J., Chiang C.S., et. al.: Assessment of tumor vasculature for diagnostic and therapeutic applications in a mouse model in vivo using 25-MHz power Doppler imaging. Ultrasonics 2011; 51: pp. 925-931.
16. Lee H.J., Hwang S.I., Chung J.H., et. al.: Evaluation of tumor angiogenesis in a MousePC-3 prostate cancer model using dynamic contrast-enhanced sonography. J Ultrasound Med 2012; 31: pp. 1223-1231.
17. Eisenbrey J.R., Wilson C.C., Ro R.J., et. al.: Correlation of ultrasound contrast agent derived blood flow parameters with immunohistochemical angiogenesis markers in murine xenograft tumor models. Ultrasonics 2013; 53: pp. 1384-1391.
18. Wang L., Lv K., Chang X.Y., et. al.: Contrast-enhanced ultrasound study of primary hepatic angiosarcoma: a pitfall of non-enhancement. Eur J Radiol 2012; 81: pp. 2054-20594.
19. Drees R., Hünigen H., Wagner S., et. al.: Peripheral washout phenomenon in an animal tumour model: comparison of dynamic magnetic resonance imaging using a small molecular contrast medium with histology. Vet Comp Oncol 2008; 6: pp. 151-161.
20. Wapnir I.L., Barnard N., Wartenberg D., et. al.: The inverse relationship between microvessel counts and tumor volume in breast cancer. Breast J 2001; 7: pp. 184-188.
21. Weind K.L., Maier C.F., Rutt B.K., et. al.: Invasive carcinoma and fibroadenomas of the breast: comparison of microvessel distributions-implications for imaging modalities. Radiology 1998; 208: pp. 477-483.