
Rationale and Objectives
To investigate if anisotropy at two-dimensional shear wave elastography (SWE) suggests malignancy and whether it correlates with prognostic and predictive factors in breast cancer.
Materials and Methods
Study group A of 244 solid breast lesions was imaged with SWE between April 2013 and May 2014. Each lesion was imaged in radial and in antiradial planes, and the maximum elasticity, mean elasticity, and standard deviation were recorded and correlated with benign/malignant status, and if malignant, correlated with conventional predictive and prognostic factors. The results were compared to a study group B of 968 solid breast lesions, which were imaged in sagittal and in axial planes between 2010 and 2013.
Results
Neither benign nor malignant lesion anisotropy is plane dependent. However, malignant lesions are more anisotropic than benign lesions ( P ≤ 0.001). Anisotropy correlates with increasing elasticity parameters, breast imaging-reporting and data system categories, core biopsy result, and tumor grade. Large cancers are significantly more anisotropic than small cancers ( P ≤ 0.001). The optimal anisotropy cutoff threshold for benign/malignant differentiation of 150 kPa 2 achieves the best sensitivity (74%) with a reasonable specificity (63%).
Conclusions
Anisotropy may be useful during benign/malignant differentiation of solid breast masses using SWE. Anisotropy also correlates with some prognostic factors in breast cancer.
Introduction
Supersonic shear wave elastography (SWE) is an ultrasound imaging modality that visualizes the elasticity of tissue. It was introduced by Bercoff et al. in 2004 and has been in clinical use since 2009 . During examinations, the propagation speed of the shear wave is measured and the elasticity, represented as Young’s modulus E, is calculated as
E=3ϱc2 E
=
3
ϱ
c
2
where c is the propagation speed of the shear wave and ϱ is the density of the tissue. Thus. SWE is a quantitative measurement method. The elasticity is visualized as a color map overlaying the grayscale B-mode ultrasound image of the lesion. As the shear wave is induced by applying an acoustic radiation force, there is no need to move the transducer. A good interobserver reproducibility can be achieved . Furthermore, Berg et al. have shown that analyzing the quantitative elasticity of a lesion with SWE is useful for the differentiation of benign and malignant lesions as malignant tissue is generally stiffer than benign tissue . Berg et al. recommended the use of a cutoff threshold for the maximum elasticity (E max ) of 80 kPa for the optimal benign/malignant differentiation . Evans et al. recommended a cutoff threshold for the mean elasticity (E mean ) of 50 kPa .
Get Radiology Tree app to read full this article<
Get Radiology Tree app to read full this article<
Get Radiology Tree app to read full this article<
Materials and Methods
Study Groups
Get Radiology Tree app to read full this article<
Get Radiology Tree app to read full this article<
Ultrasound Device
Get Radiology Tree app to read full this article<
Image Evaluation
Get Radiology Tree app to read full this article<
AD=antiradial−radial A
D
=
antiradial
−
radial
Get Radiology Tree app to read full this article<
Get Radiology Tree app to read full this article<
AF=(antiradial−radial)2 A
F
=
(
antiradial
−
radial
)
2
Get Radiology Tree app to read full this article<
Get Radiology Tree app to read full this article<
AF=(sagittal−axial)2 A
F
=
(
sagittal
−
axial
)
2
Get Radiology Tree app to read full this article<
Get Radiology Tree app to read full this article<
Get Radiology Tree app to read full this article<
Get Radiology Tree app to read full this article<
Statistics
Get Radiology Tree app to read full this article<
Get Radiology Tree app to read full this article<
Results
Evaluation of the Study Groups
Get Radiology Tree app to read full this article<
TABLE 1
Subtypes of Solid Breast Lesions in Study Group A and Study Group B
Study Group A Study Group B Subtype Number % Number % Malignant Ductal carcinoma in situ 4 2 18 3 Ductal carcinoma of no specific type 110 66 482 74 Lobular carcinoma 34 21 78 12 Mucinous carcinoma 7 4 9 1 Tubular carcinoma 6 4 23 4 Other 5 3 52 9 Benign Fibroadenoma 44 56 148 49 Fibrocystic changes 7 9 56 18 Liponecrosis 3 4 15 5 Papilloma 2 3 14 5 Other 22 28 73 23
TABLE 2
Ultrasound Assessment and Histological Features of Study Group A and Study Group B
Study Group A Study Group B Feature Number % Number % Source Screening 75 31 339 35 Symptomatic 170 69 629 65 Imaging US size <15 mm 115 47 454 47 US size ≥15 mm 130 53 514 53 US BIRADS 3 34 14 53 11 US BIRADS 4a 25 10 68 15 US BIRADS 4b 28 11 88 19 US BIRADS 4c 70 29 109 23 BIRADS 5 88 36 152 32 E max <80 kPa 97 40 336 35 E max ≥80 kPa 148 60 615 65 E mean <50 kPa 73 30 250 26 E mean ≥50 kPa 172 70 717 74 SD <7 kPa 104 42 393 41 SD ≥7 kPa 141 58 572 59 Histology Core result B1 0 0 7 1 Core result B2 70 29 261 27 Core result B3 8 3 39 4 Core result B5a 9 4 33 3 Core result B5b 158 64 626 65 Core result B5c 0 0 2 0 Characteristics of invasive cancers HER2+ 15 10 85 13 ER+ 136 83 522 81 PR+ 111 68 437 68 Grade 1 15 9 71 11 Grade 2 85 52 274 43 Grade 3 65 39 289 46 Lymph node positive 49 38 174 31 Vascular invasion 40 31 156 28
BIRADS, breast imaging-reporting and data system; E max , maximum elasticity; E mean , mean elasticity; ER, estrogen receptor; HER2, human epidermal growth factor 2; PR, progesterone receptor; SD, standard deviation; US, ultrasound.
Size, nodal status, and vascular invasion were not available in those women treated initially with systematic therapy. HER status is missing in women with equivocal enzyme-linked immunosorbent assay (ELISA) results who were not candidates for chemotherapy.
Get Radiology Tree app to read full this article<
Plane Dependency
Get Radiology Tree app to read full this article<
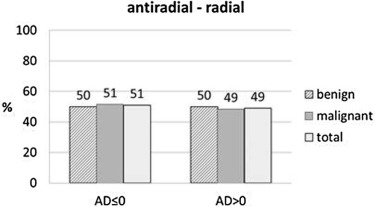
Get Radiology Tree app to read full this article<
Get Radiology Tree app to read full this article<
Get Radiology Tree app to read full this article<
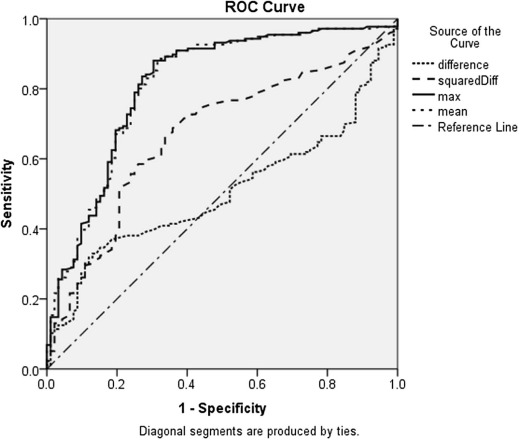
Anisotropy Threshold
Get Radiology Tree app to read full this article<
Get Radiology Tree app to read full this article<
TABLE 3
Diagnostic Performance of Anisotropy Factor (AF)
Threshold Study Group A Study Group B Se Sp DA Se Sp DA 150 74 63 71 72 59 68 200 70 68 69 69 62 67 250 68 71 69 68 68 68
DA, diagnostic accuracy; Se, sensitivity; Sp, specificity.
Get Radiology Tree app to read full this article<
Get Radiology Tree app to read full this article<
Correlation with Source of Referral
Get Radiology Tree app to read full this article<
Get Radiology Tree app to read full this article<
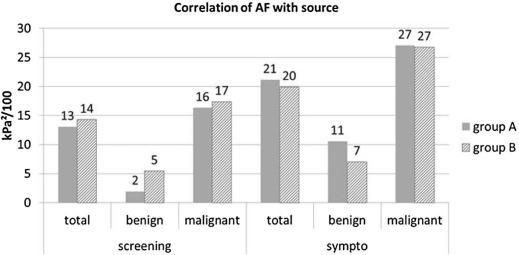
Get Radiology Tree app to read full this article<
Get Radiology Tree app to read full this article<
Correlation with Ultrasound Imaging and Elasticity Characteristics
Get Radiology Tree app to read full this article<
![Figure 4, Larger lesions are more anisotropic on SWE than smaller lesions. Small benign lesions are less anisotropic than small cancers; large benign lesions are less anisotropic than large cancers. Furthermore, anisotropy on SWE correlates with stiffness (maximum elasticity [E max ], mean elasticity [E mean ], standard deviation [SD]). There is no further correlation of AF with malignancy in soft or in hard lesions.](https://storage.googleapis.com/dl.dentistrykey.com/clinical/AnisotropyofSolidBreastLesionsin2DShearWaveElastographyisanIndicatorofMalignancy/3_1s20S1076633215004250.jpg)
Get Radiology Tree app to read full this article<
Get Radiology Tree app to read full this article<
Get Radiology Tree app to read full this article<
Get Radiology Tree app to read full this article<
Correlation with Ultrasound BIRADS
Get Radiology Tree app to read full this article<
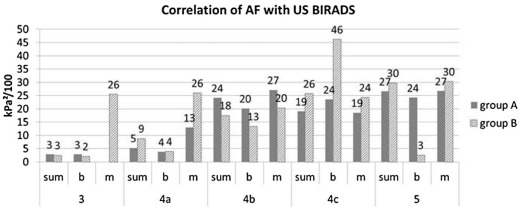
Get Radiology Tree app to read full this article<
Get Radiology Tree app to read full this article<
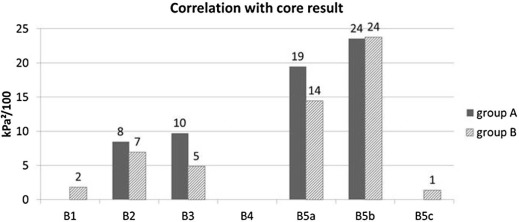
Correlation with Core Result
Get Radiology Tree app to read full this article<
Get Radiology Tree app to read full this article<
Get Radiology Tree app to read full this article<
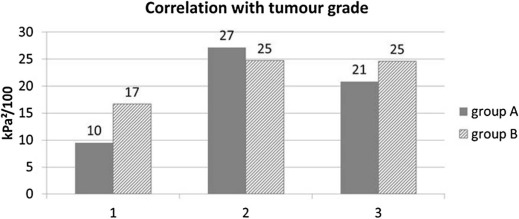
Correlation with Tumor Grade
Get Radiology Tree app to read full this article<
Get Radiology Tree app to read full this article<
Get Radiology Tree app to read full this article<
Correlation with Other Histological Features
Get Radiology Tree app to read full this article<
Get Radiology Tree app to read full this article<
Correlation with Subtypes
Get Radiology Tree app to read full this article<
TABLE 4
Correlation of AF with Tissue Subtype of the Lesions of Study Group A and Study Group B
Subtype Study Group A Study Group B AF (kPa 2 /100) AF (kPa 2 /100) Benign Fibroadenoma 5 4 Fibrocystic changes 6 13 Liponecrosis 42 4 Papilloma 6 5 Other 13 8 Malignant Ductal carcinoma in situ 26 7 Ductal carcinoma of no specific type 23 24 Lobular carcinoma 32 24 Mucinous carcinoma 5 11 Tubular carcinoma 7 15 Papillary carcinoma 2 32 Other 17 22
AF, anisotropy factor.
Get Radiology Tree app to read full this article<
Discussion
Get Radiology Tree app to read full this article<
Get Radiology Tree app to read full this article<
Get Radiology Tree app to read full this article<
Get Radiology Tree app to read full this article<
Get Radiology Tree app to read full this article<
Get Radiology Tree app to read full this article<
Get Radiology Tree app to read full this article<
Get Radiology Tree app to read full this article<
Get Radiology Tree app to read full this article<
Get Radiology Tree app to read full this article<
Acknowledgment
Get Radiology Tree app to read full this article<
References
1. Bercoff J., Tanter M., Fink M.: Supersonic shear imaging: a new technique for soft tissue elasticity mapping. IEEE Trans Ultrason Ferroelectr Freq Control 2004; 51: pp. 396-409.
2. Berg W.A., Cosgrove D.O., Doré C.J., et. al.: Shear-wave elastography improves the specificity of breast US: the BE1 multinational study of 939 masses. Radiology 2012; 262: pp. 435-449.
3. Fleury Ede F.1., Fleury J.C., Piato S., et. al.: New elastographic classification of breast lesions during and after compression. Diagn Interv Radiol 2009; 15: pp. 96-103.
4. Evans A., Whelehan P., Thomson K., et. al.: Differentiating benign from malignant solid breast masses: value of shear wave elastography according to lesion stiffness combined with greyscale ultrasound according to BI-RADS classification. Br J Cancer 2012; 107: pp. 224-229.
5. Evans A., Whelehan P., Thomson K., et. al.: Quantitative shear wave ultrasound elastography: initial experience in solid breast masses. Breast Cancer Res 2010; 12: pp. R104.
6. Ciurea A.I., Bolboaca S.D., Ciortea C.A., et. al.: The influence of technical factors on sonoelastographic assessment of solid breast nodules. Ultraschall Med 2011; 32: pp. S27-S34.
7. Thomson J.Z., Evans A.J., Pinder S.E., et. al.: Growth pattern of ductal carcinoma in situ (DCIS): a retrospective analysis based on mammographic findings. Br J Cancer 2001; 85: pp. 225-227.
8. Conklin M.W., Eickhoff J.C., Riching K.M., et. al.: Aligned collagen is a prognostic signature for survival in human breast carcinoma. Am J Pathol 2011; 178: pp. 1221-1232.
9. Skerl K., Thompson K., Vinnicombe S., et. al.: Anisotropy in solid breast lesions at shear wave elastography: relationship to the radial plane and implications for benign/malignant differentiation. Oral presentation at British Society of Breast Radiology Conference BSBR, November 10–12, Liverpool, United Kingdom2013.
10. Evans A., Whelehan P., Thomson K., et. al.: Invasive breast cancer: relationship between shear-wave elastographic findings and histologic prognostic factors. Radiology 2012; 263: pp. 673-677.
11. Evans A., Rauchhaus P., Whelehan P., et. al.: Does shear wave ultrasound independently predict axillary lymph node metastasis in women with invasive breast cancer?. Breast Cancer Res Treat 2014; 143: pp. 153-157.
12. Vinnicombe S.J., Whelehan P., Thomson K., et. al.: What are the characteristics of breast cancers misclassified as benign by quantitative ultrasound shear wave elastography?. Eur Radiol 2014; 24: pp. 921-926.
13. Evans A., Armstrong S., Whelehan P., et. al.: Can shear-wave elastography predict response to neoadjuvant chemotherapy in women with invasive breast cancer?. Br J Cancer 2013; 109: pp. 2798-2802.
14. National Research Ethics Service : Approval for medical devices research: guidance for researchers, manufacturers. Research Ethics Committees and NHS R&D Offices; Version 2 London: National Patient Safety Agency; Available at: www.hra.nhs.uk Accessed August 05, 2014
15. NHSBSP : Guidelines for pathology reporting in breast disease, Version 2.2005.National Patient Safety AgencyLondon
16. Skerl K., Thompson K., Vinnicombe S., et. al.: Influence of region of interest (ROI) size on the performance of shear wave elastography in solid breast masses. Poster presented at 12th International Tissue Elasticity Conference (ITEC), October 1–4, Lingfield, United Kingdom2013.
17. Barnes C., Speroni L., Quinn K.P., et. al.: From single cells to tissues: interactions between the matrix and human breast cells in real time. PLoS ONE 2014; 9: pp. e93325.
18. Provenzano P.P., Eliceiri K.W., Campbell J.M., et. al.: Collagen reorganization at the tumor-stromal interface facilitates local invasion. BMC Med 2006; 4: pp. 38.
19. Partridge S.C., Ziadloo A., Murthy R., et. al.: Diffusion tensor MRI: preliminary anisotropy measures and mapping of breast tumors. J Magn Reson Imaging 2010; 31: pp. 339-347.
20. Partridge S.C., Murthy R.S., Ziadloo A., et. al.: Diffusion tensor magnetic resonance imaging of the normal breast. Magn Reson Imaging 2010; 28: pp. 320-328.
21. Baltzer P.A.T., Schäfer A., Dietzel M., et. al.: Diffusion tensor magnetic resonance imaging of the breast: a pilot study. Eur Radiol 2011; 21: pp. 1-10.
22. Tagliafico A., Rescinito G., Monetti F., et. al.: Diffusion tensor magnetic resonance imaging of the normal breast: reproducibility of DTI-derived fractional anisotropy and apparent diffusion coefficient at 3.0 T. Radiol Med (Torino) 2012; 117: pp. 992-1003.
23. Sinkus R., Tanter M., Catheline S., et. al.: Imaging anisotropic and viscous properties of breast tissue by magnetic resonance-elastography. Magn Reson Med 2005; 53: pp. 372-387.