
Rationale and Objectives
This study explored tumor behavior in patients with breast cancer during neoadjuvant chemotherapy (NAC) by sequential measurements of tumor apparent diffusion coefficient (ADC) after each chemotherapy cycle. The aim was to determine if the tumor ADC is useful to differentiate complete pathological response (cPR) from partial pathological response (pPR) during NAC.
Materials and Methods
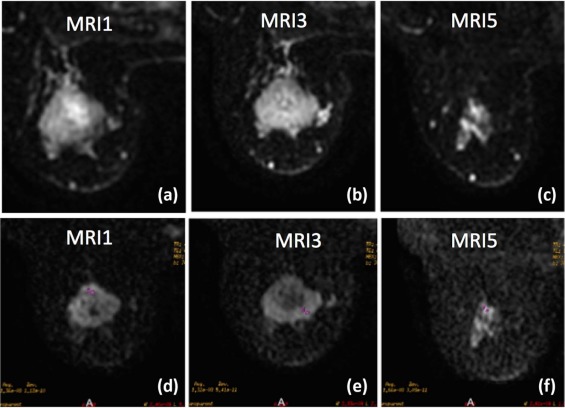
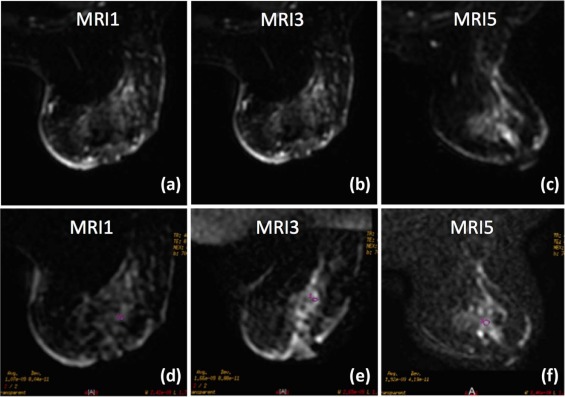
A total of 16 cases (in 14 patients) with diagnosis of breast cancer eligible to receive NAC were included. There were 70 magnetic resonance imaging examinations performed, 5 for each patient, during NAC cycles. Diffusion-weighted imaging was performed on a 1.5T system (b values of 0 and 700s/mm 2 ). Four ADC ratios between the five MRI examinations were obtained to assess ADC changes during NAC. Absence of invasive breast cancer at surgical specimens (Miller-Payne 5) was considered as cPR and was used as reference for ADC cutoff ratios.
Results
In this study, we were able to differentiate between cPR and pPR, after two cycles of NAC until the end of NAC before surgery (ADC ratios 2–4). The thresholds to differentiate between cPR and pPR of ADC ratios 2, 3, and 4, were 1.14 × 10 −3 mm 2 /s, 1.08 × 10 −3 mm 2 /s, and 1.25 × 10 −3 mm 2 /s, respectively, and have a cross-validated sensitivity and specificity of 79.2%, 79.7% (ADC ratio 2); 100%, 66.7% (ADC ratio 3); and 100%, 83.8% (ADC ratio 4), respectively.
Conclusions
The ADC ratios were useful to differentiate cPR from pPR in breast cancer tumors after NAC. Thus, it may be useful in tailoring treatment in these patients.
Introduction
Neoadjuvant chemotherapy (NAC), also known as primary or preoperatory chemotherapy, is used before surgical treatment. NAC is generally used as a part of conventional treatment in patients with locally advanced breast cancer with the potential to convert unresectable tumors into resectable tumors, to increase the possibility of breast conserving surgery, and also to provide an early management of micro-metastatic disease . In breast cancer, the survival benefit of patients receiving NAC is similar to that observed in patients who receive chemotherapy after surgery. Furthermore, the complete pathological response (cPR) or the absence of residual invasive disease in NAC is considered a favorable long-term predictive indicator or surrogate for survival . Even the measurement of tumor response in vivo to NAC may change the type and number of cycles of proposed chemotherapy .
The development of new anticancer therapies has prompted the search for new tools to assess the response to these therapies . The reference standard for evaluating the effects of new drugs is direct assessment of tumor tissue samples obtained through invasive techniques . In phase 2 and 3 clinical trials, the evaluation of the response to treatment is mainly measured in an indirect and less invasive manner using biological markers .
Get Radiology Tree app to read full this article<
Get Radiology Tree app to read full this article<
Get Radiology Tree app to read full this article<
Get Radiology Tree app to read full this article<
Get Radiology Tree app to read full this article<
Get Radiology Tree app to read full this article<
Materials and Methods
Patients
Get Radiology Tree app to read full this article<
Get Radiology Tree app to read full this article<
Breast Tumor Marking
Get Radiology Tree app to read full this article<
Chemotherapy Regimens
Get Radiology Tree app to read full this article<
MRI Acquisition
Get Radiology Tree app to read full this article<
Get Radiology Tree app to read full this article<
Image Postprocessing
Get Radiology Tree app to read full this article<
Get Radiology Tree app to read full this article<
Get Radiology Tree app to read full this article<
Get Radiology Tree app to read full this article<
Assessment of Tumor Response
Get Radiology Tree app to read full this article<
Data Collection
Get Radiology Tree app to read full this article<
Statistical Analysis
Get Radiology Tree app to read full this article<
Get Radiology Tree app to read full this article<
Results
Get Radiology Tree app to read full this article<
TABLE 1
Clinicopathological Characteristics of the Population
Characteristic Breast Cancer Cases n = 16
Mean ± SD or n (%) cPR n = 4
Mean (SD) or n (%) pPR n = 12
Mean (SD) or n (%)P Values Age, years mean (SD) 48.5 (7.8) 51.5 (10.3) 47.5 (7.0) .39 Tumor grade, n (%) .99 Grade 2 (moderately differentiated) 11 (68.8) 3 (75) 8 (66.7) Grade 3 (poorly differentiated) 5 (31.3) 1 (25) 4 (33.3) Immunohistochemical expressions of ER, PR, and Her2/neu receptors, n (%) .40 Positive hormonal receptor 7 (43.8) 1 (25) 6 (50) Triple negative 5 (31.3) 1 (25) 4 (33.3) Her2/neu overexpressing 4 (25) 2 (50) 2 (16.7) Ki-67 protein status, n (%) .53 Low proliferation (<20%) 13 (81.3) 4 (100) 9 (75) High proliferation (≥20%) 3 (18.8) 0 (0) 3 (25) MRI tumor size at diagnosis, mm mean (SD) 36.6 (17.6) 41.2 (29.5) 35.1 (13.1) .56 MRI tumor size at diagnosis, n (%) .59 <20 mm 2 (12.5) 1 (25) 1 (8.3) 20–50 mm 11 (68.8) 2 (50) 9 (75) >50 mm 3 (18.8) 1 (25) 2 (16.7) MRI tumor volume at diagnosis, cm 3 mean (SD) 15.9 (16.7) 18.7 (27.5) 15 (13.1) .71 MRI tumor size after second cycle NAC, mm mean (SD) 30 (16.6) 35.5 (27.4) 28.2 (12.5) .64 MRI tumor size after second cycle NAC, n (%) .09 <20 mm 5 (31.3) 2 (50) 3 (25) 20–50 mm 10 (62.5) 1 (25) 9 (75) >50 mm 1 (6.3) 1 (25) 0 (0) MRI tumor volume after second cycle NAC, cm 3 mean (SD) 10.3 (14) 12.8 (19.1) 9.4 (12.8) .69 MRI tumor size after NAC, mm mean (SD) 24.9 (15.9) 32.2 (25.5) 22.4 (11.8) .50 MRI tumor size after NAC, n (%) .16 <20 mm 7 (43.8) 2 (50) 5 (41.7) 20–50 mm 8 (50) 1 (25) 7 (58.3) >50 mm 1 (6.3) 1 (25) 0 (0) MRI tumor volume after NAC, cm 3 mean (SD) 3.36 (3.3) 3.18 (3.6) 3.43 (3.4) .90 Surgical specimen tumor size, mm mean (SD) 16.47 (14.6) 0 (0) 21.9 (12.7) .004 Tumor pathological response Miller-Payne, n (%) .001 Grade 1 (no reduction in overall cellularity) 2 (12.5) 0 (0) 2 (16.7) Grade 3 (30%–90% reduction in tumor cells) 6 (37.5) 0 (0) 6 (50) Grade 4 (>90% loss of tumor cells) 4 (25) 0 (0) 4 (33.3) Grade 5 (no malignant cells identifiable) 4 (25) 4 (100) 0 (0)
cPR, complete pathological response; ER, estrogen receptor; MRI, magnetic resonance imaging; NAC, neoadjuvant chemotherapy; pPR, partial pathological response; PR, progesterone receptor; SD, standard deviation.
P values calculated by Pearson χ 2 test or Fisher exact test for categorical variables and independent Student t test for numerical variables.
Get Radiology Tree app to read full this article<
Measures of the ADC Ratios
Get Radiology Tree app to read full this article<
TABLE 2
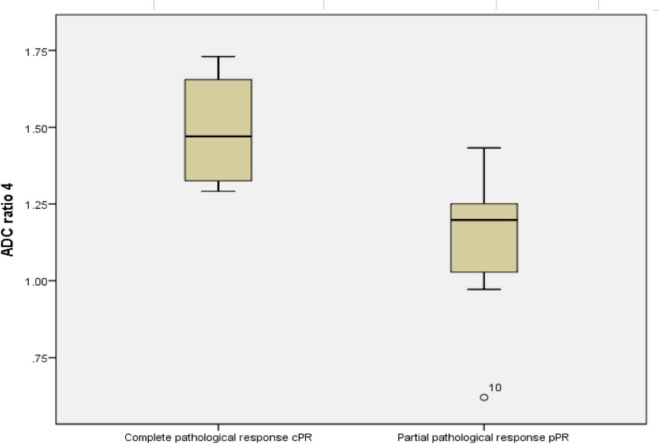
Comparison Chart Between Mean ADC Ratios of cPR and pPR
ADC Ratios cPR n = 4
Mean ± SD pPR n = 12
Mean ± SD_P_ Values ADC ratio 1 1.08 ± 0.04 1.12 ± 0.09 .44 ADC ratio 2 1.30 ± 0.28 1.10 ± 0.10 .25 ADC ratio 3 1.35 ± 0.28 1.10 ± 0.15 .17 ADC ratio 4 1.49 ± 0.20 1.13 ± 0.21 .01
ADC, apparent diffusion coefficient; cPR, complete pathological response; pPR, partial pathological response; SD, standard deviation.
Get Radiology Tree app to read full this article<
Get Radiology Tree app to read full this article<
Get Radiology Tree app to read full this article<
Get Radiology Tree app to read full this article<
Cross-validated Analysis
Get Radiology Tree app to read full this article<
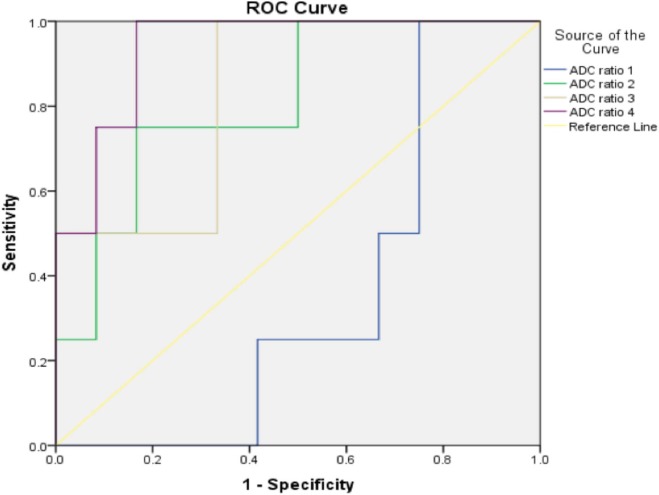
TABLE 3
Cross-validated Threshold, Sensitivity, Specificity, and AUC
ADC Ratios Threshold (× 10 −3 mm 2 /s) Sensitivity (%) Specificity (%) AUC_P_ Values ADC ratio 1 ≤1.09 85.9 58.6 0.641 .34 ADC ratio 2 >1.14 79.2 79.7 0.807 .03 ADC ratio 3 >1.08 100 66.7 0.826 .01 ADC ratio 4 >1.25 100 83.8 0.938 .0001
ADC, apparent diffusion coefficient; AUC, area under the curve.
Get Radiology Tree app to read full this article<
Get Radiology Tree app to read full this article<
Get Radiology Tree app to read full this article<
Get Radiology Tree app to read full this article<
Get Radiology Tree app to read full this article<
Discussion
Get Radiology Tree app to read full this article<
Get Radiology Tree app to read full this article<
Get Radiology Tree app to read full this article<
Get Radiology Tree app to read full this article<
Get Radiology Tree app to read full this article<
Get Radiology Tree app to read full this article<
Get Radiology Tree app to read full this article<
Get Radiology Tree app to read full this article<
Get Radiology Tree app to read full this article<
Get Radiology Tree app to read full this article<
Get Radiology Tree app to read full this article<
Acknowledgments
Get Radiology Tree app to read full this article<
References
1. Boughey J.C., Peintinger F., Meric-Bernstam F., et. al.: Impact of preoperative versus postoperative chemotherapy on the extent and number of surgical procedures in patients treated in randomized clinical trials for breast cancer. Ann Surg 2006; 244: pp. 464-470.
2. Ogston K.N., Miller I.D., Payne S., et. al.: A new histological grading system to assess response of breast cancers to primary chemotherapy: prognostic significance and survival. Breast 2003; 9776: pp. 320-327.
3. Lobbes M., Prevos R., Smidt M.: Response monitoring of breast cancer patients receiving neoadjuvant chemotherapy using breast MRI—a review of current knowledge. J Cancer Ther Res 2012;
4. Sawyers C.L.: The cancer biomarker problem. Nature 2008; 452: pp. 548-552.
5. Tan D.S.W., Thomas G.V., Garrett M.D., et. al.: Biomarker-driven early clinical trials in oncology: a paradigm shift in drug development. Cancer J 2009; 15: pp. 406-420.
6. Van Beers B.E., Vilgrain V.: Biomarkers in abdominal imaging. Abdom Imaging 2009; 34: pp. 663-667.
7. Rezai P., Pisaneschi M.J., Feng C., et. al.: A radiologist’s guide to treatment response criteria in oncologic imaging: anatomic imaging biomarkers. Am J Roentgenol 2013; 201: pp. 237-245.
8. Sadeghi-Naini A., Vorauer E., Chin L., et. al.: Early detection of chemotherapy-refractory patients by monitoring textural alterations in diffuse optical spectroscopic images. Med Phys 2015; 42: pp. 6130-6146.
9. Sadeghi-Naini A., Papanicolau N., Falou O., et. al.: Quantitative ultrasound evaluation of tumor cell death response in locally advanced breast cancer patients receiving chemotherapy. Clin Cancer Res 2013; 19: pp. 2163-2175.
10. Falou O., Sadeghi-Naini A., Prematilake S., et. al.: Evaluation of neoadjuvant chemotherapy response in women with locally advanced breast cancer using ultrasound elastography. Transl Oncol 2013; 6: pp. 17-24.
11. Pio B.S., Park C.K., Pietras R., et. al.: Usefulness of 3′-[F-18]Fluoro-3′-deoxythymidine with Positron Emission Tomography in Predicting Breast Cancer Response to Therapy. Mol Imaging Biol 2006; 8: pp. 36-42.
12. Chou C.-P., Wu M.-T., Chang H.-T., et. al.: Monitoring breast cancer response to neoadjuvant systemic chemotherapy using parametric contrast-enhanced MRI: a pilot study. Acad Radiol 2007; 14: pp. 561-573.
13. Ahmed A., Gibbs P., Pickles M., et. al.: Texture analysis in assessment and prediction of chemotherapy response in breast cancer. J Magn Reson Imaging 2013; 101: pp. 89-101.
14. Cheung Y.C., Chen S.C., Su M.Y., et. al.: Monitoring the size and response of locally advanced breast cancers to neoadjuvant chemotherapy (weekly paclitaxel and epirubicin) with serial enhanced MRI. Breast Cancer Res Treat 2003; 78: pp. 51-58.
15. Rieber A., Brambs H.J., Gabelmann A., et. al.: Breast MRI for monitoring response of primary breast cancer to neo-adjuvant chemotherapy. Eur Radiol 2002; 12: pp. 1711-1719.
16. Gilles R., Guinebreti J., Toussaint C., et. al.: Locally advanced breast cancer: contrast-enhanced subtraction MR imaging of response to preoperative chemotherapy. Radiology 1994; 191: pp. 633-638.
17. Witney T., Kettunen M., Hu D., et. al.: Detecting treatment response in a model of human breast adenocarcinoma using hyperpolarised [1–13 C] pyruvate and [1,4–13 C2] fumarate. Br J Cancer 2010; 103: pp. 1400-1406.
18. Jagannathan N.R., Kumar M., Seenu V., et. al.: Evaluation of total choline from in-vivo volume localized proton MR spectroscopy and its response to neoadjuvant chemotherapy in locally advanced breast cancer. Br J Cancer 2001; 84: pp. 1016-1022. May 1999
19. Tardivon A.A., Ollivier L., El Khoury C., et. al.: Monitoring therapeutic efficacy in breast carcinomas. Eur Radiol 2006; 16: pp. 2549-2558.
20. Larkin T.J., Canuto H.C., Kettunen M.I., et. al.: Analysis of image heterogeneity using 2D Minkowski functionals detects tumor responses to treatment. Magn Reson Med 2014; 410: pp. 402-410.
21. Pickles M.D., Gibbs P., Lowry M., et. al.: Diffusion changes precede size reduction in neoadjuvant treatment of breast cancer. Magn Reson Imaging 2006; 24: pp. 843-847.
22. Sharma U., Kalathil K., Danishad A., et. al.: Longitudinal study of the assessment by MRI and diffusion-weighted imaging of tumor response in patients with locally advanced breast cancer undergoing neoadjuvant chemotherapy. NMR Biomed 2009; 22: pp. 104-113.
23. Gutiérrez-Sánchez J.B., Montemayor-Martínez A., Ornelas-Cortinas G., et. al.: Caso clínico Utilidad del carbón activado en el marcaje de mama. Med Univ 2009; 11: pp. 55-59.
24. Grimm L.J., Breast M.R.I.: Radiogenomics: current status and research implications. J Magn Reson Imaging 2016; 43: pp. 1269-1278.
25. Liu S., Ren R., Chen Z., et. al.: Diffusion-weighted imaging in assessing pathological response of tumor in breast cancer subtype to neoadjuvant chemotherapy. J Magn Reson Imaging 2015; 42: pp. 779-787.
26. Masuda N., Lee S.J., Ohtani S., et. al.: Adjuvant capecitabine for breast cancer after preoperative chemotherapy. N Engl J Med 2017; 376: pp. 2147-2159.
27. Teshome M., Kuerer H.M.: Breast conserving surgery and locoregional control after neoadjuvant chemotherapy. EJSO 2017; 43: pp. 865-874.