
Rationale and Objectives
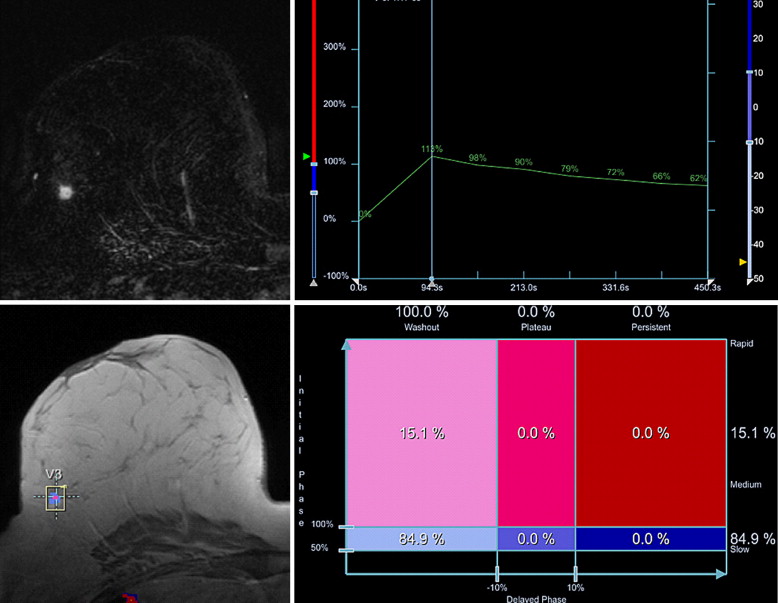
The identification of the most suspect enhancing part of a lesion is regarded as a major diagnostic criterion in dynamic magnetic resonance mammography. Computer-aided diagnosis (CAD) software allows the semi-automatic analysis of the kinetic characteristics of complete enhancing lesions, providing additional information about lesion vasculature. The diagnostic value of this information has not yet been quantified.
Materials and Methods
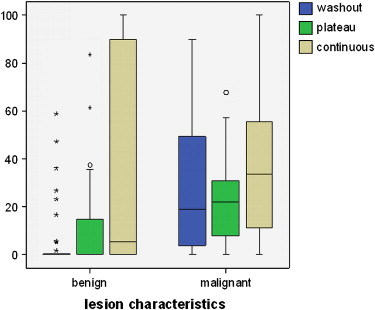
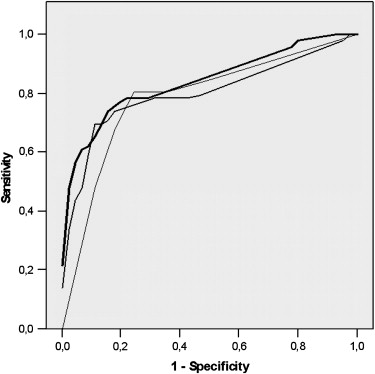
Consecutive patients from routine diagnostic studies (1.5 T, 0.1 mmol gadopentetate dimeglumine, dynamic gradient-echo sequences at 1-minute intervals) were analyzed prospectively using CAD. Dynamic sequences were processed and reduced to a parametric map. Curve types were classified by initial signal increase (not significant, intermediate, and strong) and the delayed time course of signal intensity (continuous, plateau, and washout). Lesion enhancement was measured using CAD. The most suspect curve, the curve-type distribution percentage, and combined dynamic data were compared. Statistical analysis included logistic regression analysis and receiver-operating characteristic analysis.
Results
Fifty-one patients with 46 malignant and 44 benign lesions were enrolled. On receiver-operating characteristic analysis, the most suspect curve showed diagnostic accuracy of 76.7 ± 5%. In comparison, the curve-type distribution percentage demonstrated accuracy of 80.2 ± 4.9%. Combined dynamic data had the highest diagnostic accuracy (84.3 ± 4.2%). These differences did not achieve statistical significance. With appropriate cutoff values, sensitivity and specificity, respectively, were found to be 80.4% and 72.7% for the most suspect curve, 76.1% and 83.6% for the curve-type distribution percentage, and 78.3% and 84.5% for both parameters.
Conclusions
The integration of whole-lesion dynamic data tends to improve specificity. However, no statistical significance backs up this finding.
Magnetic resonance imaging (MRI) is the most sensitive method for the detection of breast cancer, especially the preoperative detection of multifocality or multicentricity . Since the first application of fast gradient-echo sequences with repetitive measurements of signal intensity after contrast material injection , several studies have shown the diagnostic value of signal-intensity time-course data for differentiation between benign and malignant breast lesions on MRI . Essential for the different signal-intensity time courses after contrast material injection in benign and malignant lesions is the stronger neoangiogenesis in malignant lesions, which is the basis of exponential tumor growth .
It is well known that signal-intensity time-curve analysis, mainly performed using the region-of-interest (ROI) method, can differentiate between benign and malignant lesions. Kuhl et al reported sensitivity and specificity of 91% and 83%, respectively, and diagnostic accuracy of 86%. According to the American College of Radiology’s Breast Imaging Reporting and Data System (BI-RADS) lexicon , kinetic enhancement features besides morphologic criteria are a major diagnostic criterion in magnetic resonance mammography (MRM). The most suspect part of a lesion is mostly identified by the manual placement of several ROIs by a radiologist. This practice may lead to mistakes if an ROI is placed in a less vital and thus less enhancing area. Furthermore, the detection of the most suspect enhancing part of a lesion is regarded as a time-consuming process . To minimize interobserver variability, Mussurakis et al proposed semi-automatic ROI analysis. In a database of 121 lesions, similar classification performance between time curves obtained by an experienced radiologist and those obtained with semi-automatic curve analysis was found .
Get Radiology Tree app to read full this article<
Get Radiology Tree app to read full this article<
Materials and methods
Patients
Get Radiology Tree app to read full this article<
MRI
Get Radiology Tree app to read full this article<
CAD System Analysis
Get Radiology Tree app to read full this article<
Get Radiology Tree app to read full this article<
Get Radiology Tree app to read full this article<
Data Collection and Statistical Analysis
Get Radiology Tree app to read full this article<
Get Radiology Tree app to read full this article<
Get Radiology Tree app to read full this article<
Results
Tumor Characteristics and Lesions
Get Radiology Tree app to read full this article<
Get Radiology Tree app to read full this article<
CAD Lesion Detection and Color Coding
Get Radiology Tree app to read full this article<
Table 1
Lesion Characteristics and Size of Threshold-passing (CAD-Detected) and Non-CAD–detected Lesions
Lesion Detected by CAD (all lesions) Detected by CAD (≤10 mm) Median (IQR) Size (mm) Not Detected by CAD Detected by CAD Benign ( n = 46) 24/46 (52.2%) 11/26 (42.3%) 8 (6.3) 12 (8.8) Malignant ( n = 46) 39/46 (84.8%) 11/16 (68.8%) 8 (6.0) 14 (9.0)
CAD, computed-aided diagnosis; IQR, interquartile range.
Get Radiology Tree app to read full this article<
Get Radiology Tree app to read full this article<
Most Suspect Curve Characteristics
Get Radiology Tree app to read full this article<
Table 2
Most Suspect Curve Types in Benign and Malignant Lesions
Curve Type Continuous Plateau Washout Lesion <50% (Threshold) 50%–100% >100% 50%–100% >100% 50%–100% >100% Benign ( n = 44) 20 (45%) 7 (16%) 5 (11%) 2 (5%) 2 (5%) 3 (7%) 5 (11%) Malignant ( n = 46) 7 (15%) 2 (4%) 0 (0%) 4 (9%) 2 (4%) 9 (20%) 22 (48%)
Get Radiology Tree app to read full this article<
Get Radiology Tree app to read full this article<
Curve-type Distribution Patterns
Get Radiology Tree app to read full this article<
Table 3
Sensitivity, Specificity, and Diagnostic Accuracy of Curve-type Distribution in the Whole Lesion Volume (receiver-operating characteristic analysis)
Voxel Distribution Variable Washout Plateau Continuous Plateau and/or Washout Sensitivity 76.1% 76.1% 76.1% 78.3% Specificity 78.3% 73.9% 52.2% 80.4% Accuracy 78.9 ± 4.9% 75.1 ± 5.4% 54.7 ± 6.5% 79.0 ± 5%
Get Radiology Tree app to read full this article<
Get Radiology Tree app to read full this article<
Get Radiology Tree app to read full this article<
LRA
Get Radiology Tree app to read full this article<
Table 4
Sensitivity, Specificity, and Diagnostic Accuracy of Most Suspect Curve and Logistic Regression Results for Curve-type Distribution in the Whole Lesion and Combined Most Suspect Curve and Curve-type Distribution Data (receiver-operating characteristic analysis)
Variable Most Suspect Curve Curve-Type Distribution Combined Dynamic Data Sensitivity 80.4% 76.1% 78.3% Specificity 72.7% 83.6% 84.5% Accuracy 76.7 ± 5% 80.2 ± 4.9% 84.3 ± 4.2%
Get Radiology Tree app to read full this article<
Discussion
Get Radiology Tree app to read full this article<
Get Radiology Tree app to read full this article<
Get Radiology Tree app to read full this article<
Get Radiology Tree app to read full this article<
Get Radiology Tree app to read full this article<
Get Radiology Tree app to read full this article<
References
1. Berg W.A., Gutierrez L., NessAiver M.S., et. al.: Diagnostic accuracy of mammography, clinical examination, US, and MR imaging in preoperative assessment of breast cancer. Radiology 2004; 233: pp. 830-849.
2. Echevarria J.J., Martin M., Saiz A., et. al.: Overall breast density in MR mammography: diagnostic and therapeutic implications in breast cancer. J Comput Assist Tomogr 2006; 30: pp. 140-147.
3. Sardanelli F., Giuseppetti G.M., Panizza P., et. al.: Sensitivity of MRI versus mammography for detecting foci of multifocal, multicentric breast cancer in fatty and dense breasts using the whole-breast pathologic examination as a gold standard. AJR Am J Roentgenol 2004; 183: pp. 1149-1157.
4. Winnekendonk G., Krug B., Warm M., Gohring U.J., Mallmann P., Lackner K.: Diagnostic value of preoperative contrast-enhanced MR imaging of the breast. Rofo 2004; 176: pp. 688-693.
5. Kaiser W.A., Zeitler E.: MR imaging of the breast: fast imaging sequences with and without Gd-DTPA. Preliminary observations. Radiology 1989; 170: pp. 681-686.
6. Heywang-Kobrunner S.H., Viehweg P., Heinig A., Kuchler C.: Contrast-enhanced MRI of the breast: accuracy, value, controversies, solutions. Eur J Radiol 1997; 24: pp. 94-108.
7. Mussurakis S., Buckley D.L., Drew P.J., et. al.: Dynamic MR imaging of the breast combined with analysis of contrast agent kinetics in the differentiation of primary breast tumours. Clin Radiol 1997; 52: pp. 516-526.
8. Kuhl C.K., Mielcareck P., Klaschik S., et. al.: Dynamic breast MR imaging: are signal intensity time course data useful for differential diagnosis of enhancing lesions?. Radiology 1999; 211: pp. 101-110.
9. Malich A., Fischer D.R., Wurdinger S., et. al.: Potential MRI interpretation model: differentiation of benign from malignant breast masses. AJR Am J Roentgenol 2005; 185: pp. 964-970.
10. Naumov G.N., Bender E., Zurakowski D., et. al.: A model of human tumor dormancy: an angiogenetic switch from the nonangiogenic phenotype. J Natl Cancer Inst 2006; 98: pp. 316-325.
11. Ikeda D.M., Hylton N.M., Kuhl C.K., et. al.: MRI Breast Imaging Reporting and Data System atlas.2003.American College of RadiologyReston, VA
12. Mussurakis S., Buckley D.L., Horsman A.: Dynamic MRI of invasive breast cancer: assessment of three region-of-interest analysis methods. J Comput Assist Tomogr 1997; 21: pp. 431-438.
13. Chen W., Giger M.L., Bick U., Newstead G.M.: Automatic identification and classification of characteristic kinetic curves of breast lesions on DCE-MRI. Med Phys 2006; 33: pp. 2878-2887.
14. Williams T.C., DeMartini W.B., Partridge S.C., Peacock S., Lehman C.D.: Breast MR imaging: computer aided evaluation program for discriminating benign from malignant lesions. Radiology 2007; 244: pp. 94-103.
15. Lehman C.D., Peacock S., Demartini W.B., Chen X.: A new automated software system to evaluate breast MR examinations: improved specificity without decreased sensitivity. AJR Am J Roentgenol 2006; 187: pp. 51-56.
16. Demartini W.B., Lehman C.D., Peacock S., Russell M.T.: Computer-aided detection applied to breast MRI: assessment of CAD-generated enhancement and tumor sizes in breast cancers before and after neoadjuvant chemotherapy. Acad Radiol 2005; 12: pp. 806-814.
17. Hauth E.A., Stockamp C., Maderwald S., et. al.: Evaluation of the three-time-point method for diagnosis of breast lesions in contrast-enhanced MR mammography. Clin Imaging 2006; 30: pp. 160-165.
18. Hauth E.A., Jaeger H., Maderwald S., et. al.: Evaluation of quantitative parametric analysis for characterization of breast lesions in contrast-enhanced MR mammography. Eur Radiol 2006; 16: pp. 2834-2841.
19. Baum F., Fischer U., Vosshenrich R., Grabbe E.: Classification of hypervascularized lesions in CE MR imaging of the breast. Eur Radiol 2002; 12: pp. 1087-1092.
20. Bossuyt P.M., Reitsma J.B., Bruns D.E., et. al.: Towards complete and accurate reporting of studies of diagnostic accuracy: the STARD Initiative. Radiology 2003; 226: pp. 24-28.
21. Pediconi F., Catalano C., Venditti F., et. al.: Color-coded automated signal intensity curves for detection and characterization of breast lesions. Preliminary evaluation of a new software package for integrated magnetic resonance-based breast imaging. Invest Radiol 2005; 40: pp. 448-457.
22. Tofts P.S., Berkowitz B.A.: Measurement of capillary permeability from the Gd enhancement curve: a comparison of bolus and constant infusion injection methods. Magn Reson Imaging 1994; 12: pp. 81-91.
23. Neubauer H., Li M., Kuehne-Heid R., Schneider A., Kaiser W.A.: High grade and non-high grade ductal carcinoma in situ on dynamic MR mammography: characteristic findings for signal increase and morphological pattern of enhancement. Br J Radiol 2003; 76: pp. 3-12.
24. Buadu L., Murakami J., Murayama S., et. al.: Breast lesions: correlation of contrast medium enhancement patterns on MR images with histopathologic findings and tumor angiogenesis. Radiology 1996; 200: pp. 639-649.
25. Fischer U., von Heyden D., Vosshenrich R., Vieweg I., Grabbe E.: Signal characteristics of malignant and benign lesions in dynamic 2D-MRT of the breast. Rofo 1993; 158: pp. 287-292.
26. Stomper P.C., Winston J.S., Herman S., Klippenstein D.L., Arredondo M.A., Blumenson L.E.: Angiogenesis and dynamic MR imaging gadolinium enhancement of malignant and benign breast lesions. Breast Cancer Res Treat 1997; 45: pp. 39-46.
27. Warren R.M., Thompson D., Pointon L.J., et. al.: Evaluation of a prospective scoring system designed for a multicenter breast MR imaging screening study. Radiology 2006; 239: pp. 677-685.
28. Pabst T., Kenn W., Kaiser W.A., Hahn D.: Understanding why contrast enhancement in dynamic MRI is not reproducible: illustration with a simple phantom. Breast J 2001; 7: pp. 166-170.