
Rationale and Objectives
The study aimed to investigate the role of applying quantitative image features computed from computed tomography (CT) images for early prediction of tumor response to chemotherapy in the clinical trials for treating ovarian cancer patients.
Materials and Methods
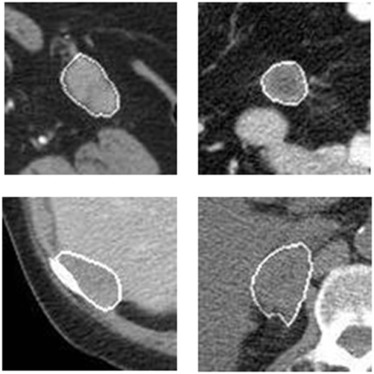
A dataset involving 91 patients was retrospectively assembled. Each patient had two sets of pre- and post-therapy CT images. A computer-aided detection scheme was applied to segment metastatic tumors previously tracked by radiologists on CT images and computed image features. Two initial feature pools were built using image features computed from pre-therapy CT images only and image feature difference computed from both pre- and post-therapy images. A feature selection method was applied to select optimal features, and an equal-weighted fusion method was used to generate a new quantitative imaging marker from each pool to predict 6-month progression-free survival. The prediction accuracy between quantitative imaging markers and the Response Evaluation Criteria in Solid Tumors (RECIST) criteria was also compared.
Results
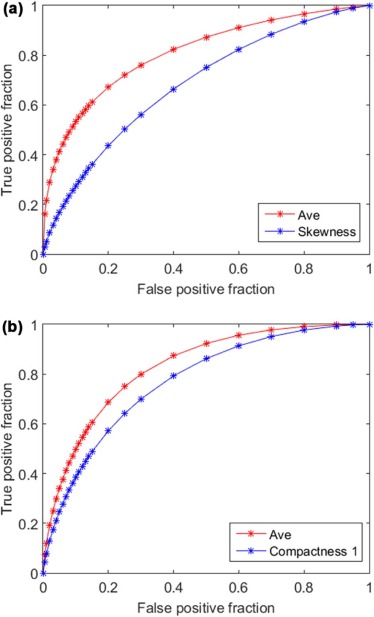
The highest areas under the receiver operating characteristic curve are 0.684 ± 0.056 and 0.771 ± 0.050 when using a single image feature computed from pre-therapy CT images and feature difference computed from pre- and post-therapy CT images, respectively. Using two corresponding fusion-based image markers, the areas under the receiver operating characteristic curve significantly increased to 0.810 ± 0.045 and 0.829 ± 0.043 ( P < 0.05), respectively. Overall prediction accuracy levels are 71.4%, 80.2%, and 74.7% when using two imaging markers and RECIST, respectively.
Conclusions
This study demonstrated the feasibility of predicting patients’ response to chemotherapy using quantitative imaging markers computed from pre-therapy CT images. However, using image feature difference computed between pre- and post-therapy CT images yielded higher prediction accuracy.
Introduction
Ovarian cancer has the highest mortality rate among all the gynecologic malignancies because majority of the cancers are diagnosed at an advanced stage . To improve survival rate of ovarian cancer patients after surgeries to remove primary ovarian tumors, applying effective chemotherapy to treat metastasized tumors also plays an important role. As a result, a large number of clinical trials are performed to test new chemotherapy drugs or procedures. However, as the metastasized tumors are typically p53-driven and genetically unstable , responses to the chemotherapy vary significantly across the individual patients. To improve efficacy of clinical trials, how to effectively identify patients who are likely to receive benefit from the clinical trials at an early stage remains a big challenge.
To address this clinical challenge, extensive research efforts have been conducted to develop and test variety of imaging modalities for monitoring or predicting tumor response to chemotherapies . For example, one review article compared many modalities for imaging ovarian cancer and peritoneal metastases, including computed tomography (CT), positron emission tomography/CT, diffusion-weighted magnetic resonance imaging (MRI), dynamic contrast-enhanced MRI, magnetic resonance spectroscopy, ultrasound, and optical imaging. It reviewed a large number of studies performed from 1980 to 2010 for ovarian cancer diagnosis, evaluation of cancer response to therapies, surveillance and detection of cancer recurrence. The study summarized that CT had superior advantages, including wide availability, good reproducibility, high cost-efficiency, and fast image scanning time. Only ultrasound is lower in cost than CT, but its accuracy is much lower than CT . Although MRI may provide additional functional information, it has equivalent performance in detecting and staging abdominal-pelvic disease to CT, but the high cost and longer examination times preclude the use of MRI for most ovarian cancer patients . Thus, CT is the only imaging modality routinely used in current clinical practice for ovarian cancer diagnosis and treatment evaluation .
Get Radiology Tree app to read full this article<
Get Radiology Tree app to read full this article<
Materials and Methods
Get Radiology Tree app to read full this article<
Get Radiology Tree app to read full this article<
TABLE 1
Patient Information for Both PFS “Yes” and “No” Groups
6-Month PFS Yes No Number of patients 52 39 Patient average age 66 ± 8 67 ± 9 Number of totally tracked metastatic tumors 101 96 Average tumor diameter (before therapy) 27 mm 24 mm
PFS, progression-free survival.
Get Radiology Tree app to read full this article<
Get Radiology Tree app to read full this article<
Get Radiology Tree app to read full this article<
Get Radiology Tree app to read full this article<
TABLE 2
List of the Computed 159 Image Features in Four Groups for Estimating Tumor Characteristics
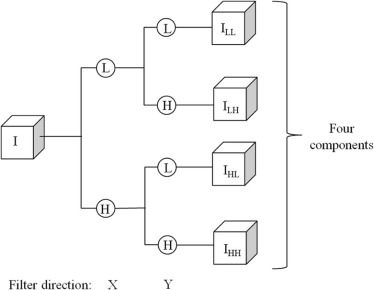
Feature Class Feature Number Feature Description Shape 1–10 Volume, convexity, maximum radius, radius standard deviation (STD) , surface area, compactness feature 1, compactness feature 2, maximum three-dimensional diameter, spherical disproportion, spherical ratio, ratio of surface area to volume Density 11–31 Density, density STD, gradient mean, gradient STD, isointensity, fluctuation mean, fluctuation STD, mean contrast, contrast, skewness, kurtosis, STD ratio of tumor to boundary, energy, entropy, maximum intensity, mean absolute deviation, median, minimum, range, RMS, uniformity Texture 32–75 11 gray-level run length-based features on four directions (0°, 45°, 90°, and 135°) (defined in References ) Wavelet 76–159 Apply the density features on the four wavelet decompositions
RMS, root mean square.
Get Radiology Tree app to read full this article<
Get Radiology Tree app to read full this article<
Get Radiology Tree app to read full this article<
Results
Get Radiology Tree app to read full this article<
TABLE 3
Summary of the Areas Under the ROC Curve (AUCs) of Using Each of the 12 Best Performed Image Features Computed From Using Pre-therapy CT Images Only and Image Feature Difference Computed Between Pre- and Post-therapy CT Images to Predict 6-Month PFS
Pre-treatment Feature Group Performance Pre–post Treatment Feature Group Performance Skewness 0.684 ± 0.056 Compactness 1 0.771 ± 0.050 Contrast-LH 0.652 ± 0.059 Volume 0.755 ± 0.051 Contrast-HL 0.643 ± 0.058 Surface area 0.739 ± 0.052 Uniformity 0.637 ± 0.058 Fluctuation STD-LL 0.711 ± 0.054 Skewness-HH 0.623 ± 0.059 Energy 0.707 ± 0.055 Sphericity 0.621 ± 0.058 Median 0.695 ± 0.054 Entropy 0.619 ± 0.059 Entropy-HL 0.687 ± 0.055 Density STD ratio-HL 0.618 ± 0.058 RMS 0.685 ± 0.055 Kurtosis-HL 0.615 ± 0.059 Density 0.684 ± 0.055 Compactness 2 0.602 ± 0.059 Maximum density 0.682 ± 0.056 Mean contrast-LH 0.596 ± 0.060 Density range 0.677 ± 0.056 Kurtosis 0.592 ± 0.060 Energy-HH 0.670 ± 0.057
CT, computed tomography; PFS, progression-free survival; RMS, root mean square; ROC, receiver operating characteristic; STD, standard deviation.
Get Radiology Tree app to read full this article<
Get Radiology Tree app to read full this article<
Get Radiology Tree app to read full this article<
Get Radiology Tree app to read full this article<
TABLE 4
Summary of Three Confusion Matrices to Predict 6-Month PFS Using Two Fusion-based QI Markers and Pre-recorded Radiologists’ Assessment Results Based on RECIST Criteria
Open full size image
CT, computed tomography; PFS, progression-free survival; QI, quantitative imaging; RECIST, Response Evaluation Criteria in Solid Tumors.
Get Radiology Tree app to read full this article<
Discussion
Get Radiology Tree app to read full this article<
Get Radiology Tree app to read full this article<
Get Radiology Tree app to read full this article<
Get Radiology Tree app to read full this article<
Get Radiology Tree app to read full this article<
Acknowledgments
Get Radiology Tree app to read full this article<
Get Radiology Tree app to read full this article<
Get Radiology Tree app to read full this article<
References
1. Siegel R.L., Miller K.D., Jemal A.: Cancer statistics, 2016. CA Cancer J Clin 2016; 66: pp. 7-30.
2. The Cancer Genome Atlas Research Network : Integrated genomic analyses of ovarian carcinoma. Nature 2011; 474: pp. 609-615.
3. Tempany C.M.C., Zou K.H., Silverman S.G., et. al.: Staging of advanced ovarian cancer: comparison of imaging modalities—report from the Radiological Diagnostic Oncology Group. Radiology 2000; 215: pp. 761-767.
4. Gu P., Pan L.L., Wu S.Q., et. al.: CA 125, PET alone, PET-CT, CT and MRI in diagnosing recurrent ovarian carcinoma: a systematic review and meta-analysis. Eur J Radiol 2009; 71: pp. 164-174.
5. Kyriazi S., Kaye S.B., deSouza N.M.: Imaging ovarian cancer and peritoneal metastases-current and emerging techniques. Nat Rev Clin Oncol 2010; 7: pp. 381-393.
6. Fischerova D., Burgetova A.: Imaging techniques for the evaluation of ovarian cancer. Best Prac Res Clin Obstet Gynaecol 2014; 28: pp. 697-720.
7. Foti P.V., Attina G., Spadola S., et. al.: MR imaging of ovarian masses: classification and differential diagnosis. Insights Imaging 2016; 7: pp. 21-41.
8. Eisenhauer E.A., Therasse P., Bogaerts J., et. al.: New response evaluation criteria in solid tumours: revised RECIST guideline (version 1.1). Eur J Cancer 2009; 45: pp. 228-247.
9. Sharma M.R., Maitland M.L., Ratain M.J.: RECIST: no longer the sharpest tool in the oncology clinical trials toolbox point. Cancer Res 2012; 72: pp. 5145-5149.
10. Abramson R.G., McGhee C.R., Lakomkin N., et. al.: Pitfalls in RECIST data extraction for clinical trials: beyond the basics. Acad Radiol 2015; 22: pp. 779-786.
11. Qiu Y.C., Tan M., McMeekin S., et. al.: Early prediction of clinical benefit of treating ovarian cancer using quantitative CT image feature analysis. Acta Radiol 2016; 57: pp. 1149-1155.
12. Fallowfield L.J., Fleissig A.: The value of progression-free survival to patients with advanced-stage cancer. Nat Rev Clin Oncol 2012; 9: pp. 41-47.
13. Danala G., Wang Y., Thai T., et. al.: Improving efficacy of metastatic tumor segmentation to facilitate early prediction of ovarian cancer patients’ response to chemotherapy. Proc SPIE 2017; 10065: 100650J-1-6
14. te Brake G.M., Karssemeijer N., Hendriks J.: An automatic method to discriminate malignant masses from normal tissue in digital mammograms. Phys Med Biol 2000; 45: pp. 2843-2857.
15. Zheng B., Lu A., Hardesty L.A., et. al.: A method to improve visual similarity of breast masses for an interactive computer-aided diagnosis environment. Med Phys 2006; 33: pp. 111-117.
16. Aerts H., Velazquez E.R., Leijenaar R.T.H., et. al.: Decoding tumour phenotype by noninvasive imaging using a quantitative radiomics approach. Nat Commun 2014; 5: pp. 4006.
17. Haralick R.M., Shanmugam K., Dinstein I.: Textural features for image classification. IEEE Trans Syst Man Cybern 1973; SMC3: pp. 610-621.
18. Tang X.O.: Texture information in run-length matrices. IEEE Trans Image Process 1998; 7: pp. 1602-1609.
19. Metz C.E., Herman B.A., Shen J.H.: Maximum likelihood estimation of receiver operating characteristic (ROC) curves from continuously-distributed data. Stat Med 1998; 17: pp. 1033-1053.
20. van der Heijden F., Duin R.P., Ridder D., et. al.: Classification, parameter estimation and state estimation: an engineering approach using MATLAB.2004.John Wiley & SonsHoboken, NJ
21. Collins F.S., Varmus H.: A new initiative on precision medicine. N Engl J Med 2015; 372: pp. 793-795.
22. Wang Y., Thai T., Moore K., et. al.: Quantitative measurement of adiposity using CT images to predict the benefit of bevacizumab-based chemotherapy in epithelial ovarian cancer patients. Oncol Lett 2016; 12: pp. 680-686.
23. Tan M., Li Z., Qiu Y., et. al.: A new approach to evaluate drug treatment response of ovarian cancer patients based on deformable image registration. IEEE Trans Med Imaging 2016; 35: pp. 316-325.
24. Wang Y., Qiu Y., Thai T., et. al.: A two-step convolutional neural network based computer-aided detection scheme for automatically segmenting adipose tissue depicting on CT images. Comput Methods Programs Biomed 2017; 144: pp. 97-104.
25. Aghaei F., Tan M., Hollingsworth A.B., et. al.: Applying a new quantitative global breast MRI feature analysis scheme to assess tumor response to chemotherapy. J Magn Reson Imaging 2016; 44: pp. 1099-1106.
26. Yan S., Qian W., Guan Y., et. al.: Improving lung cancer prognosis assessment by incorporating synthetic minority oversampling technique and score fusion method. Med Phys 2016; 43: pp. 2694-2703.